Happiness of the younger, the older, and those in between
Chapter Contents
- Key Insights
- Measuring and Explaining National Differences in Life Evaluations
- How do happiness rankings vary by age group?
- Is life getting better or worse, and for which age groups?
- Emotions at different ages
- How unequal is happiness at different ages?
- Are there generational differences in benevolence?
- Social support, loneliness and social interactions by generation
- What are the happiest and least happy stages of life in different countries?
- Summary
- References
- Endnotes
Key Insights
- Ranking convergence continues between the two halves of Europe, with Czechia, Lithuania and Slovenia at positions 18, 19 and 21, contributing to the fall of the United States and Germany from 15 and 16 last year to 23 and 24 this year.
- Rankings differ a lot for the young and the old. In some cases these differences favour the old, as in the United States and Canada, where the rankings for those aged 60 and older are 50 or more places higher than for those under 30. In other cases, especially in Central and Eastern Europe, the reverse is true, with many rankings being more than 40 places higher for the young than for the old.
- From 2006-2010 to 2021-2023 changes in overall happiness varied greatly from country to country, ranging from increases as large as 1.8 points in Serbia, (up 69 ranks from WHR2013 to WHR2024) and 1.6 points in Bulgaria (up 63 ranks from WHR2013 to WHR2024) to decreases as large as 2.6 points in Afghanistan (13th from bottom in WHR2013 to unhappiest country in WHR2024).
- Happiness changes also varied by global region. Central and Eastern Europe had the largest increases, of the same size for all age groups. Gains were half as large in the CIS countries. East Asia also had large increases, especially for the older population. By contrast, life evaluations fell in South Asia in all age groups, especially in the middle age groups. Happiness fell significantly in the country group including the United States, Canada, Australia and New Zealand, by twice as much for the young as for the old. Happiness has fallen from 2006-2010 to 2021-2023 in the Middle East and North Africa, with larger declines for those in the middle age groups than for the old and the young.
- For those under 30, happiness levels are now equal in both halves of Europe. For those ever 60, the gap between the two halves of Europe is about half of what it was in 2006-2010. But it is still very large, more than a full point in 2021-2023.
- In 2021-2023 negative emotions were in every region more prevalent for females than males, with almost everywhere the gender gap being larger at higher ages.
- Negative emotions are more frequent than in 2006-2010 everywhere except East Asia and both parts of Europe. In Central and Eastern Europe, in contrast to the rest of the world, but consistently with the happiness convergence taking place within Europe, negative emotions are now less frequent in all age groups than they were in 2006-2010.
- Positive emotions have not changed much, while still remaining more frequent for the young than for older age groups.
- Global happiness inequality has increased by more than 20% over the past dozen years, in all regions and age groups, to an extent that differs a lot by age and by region.
- Post-COVID increases in benevolence, whether measured as shares of the population, or percentage increases from pre-pandemic levels, are large for all generations, but especially so for the Millennials and Generation Z, who are even more likely than their predecessors to help others in need.
- New global social connections data show feelings of social support to have been more than twice as prevalent as loneliness in 2022. Both social support and loneliness affect happiness, with social support usually having the larger effect. Social interactions add to happiness, with their effects flowing through increases in social support and reductions in loneliness.
- Age and generation both matter for happiness. As between generations, those born before 1965 (Boomers and their predecessors) have life evaluations about one-quarter of a point higher than those born after 1980 (Millennials and Gen Z). Within each generation, life evaluations rise with age for those in the older generations and fall with age for the younger ones, with little age effect for those in between.
This chapter is about happiness during different life stages and of those in different generations. It is not the first time we have looked at happiness by age and gender.[1] But it is the first time we have enough survey years to start separating the life course from the ever-changing patterns of history. Some important parts of life are tied mainly to age, such as schooling, employment and health. Others depend more on what is going on in society and the world. These society-wide factors range from violence, earthquakes and pandemics to how new technologies and changing natural and social environments interact with also-changing ways of seeing history, facing inequalities, and connecting with each other. While most of our analysis deals with life at different ages, we bring in generational effects where we find them most salient.
Our early sections relate to happiness as measured by life evaluations and emotions, showing their levels and changes for the younger (<30), the older (60+), and those in between divided into two groups, aged 30-44 and 45-59. For our later analysis by generation, we make a three-way split: those born before 1965, 1965-1980, and after 1980. Although the best separation points for generational differences will differ from country to country, depending on their key events, our separation does match some widely used definitions,[2] and also divides the sample fairly evenly, with roughly 30% in each of the first two groups, and 40% in the youngest cohort, which includes millennials and their successors.
We start by presenting our usual ranking and modelling of national happiness of the population as a whole. In Figure 2.1 we rank countries by their average life evaluations over the three preceding years, 2021-2023. We have two versions of Figure 2.1. The first version presents actual life evaluations alone on centre stage. We include horizontal whiskers showing the 95% confidence bands for our national estimates, supplemented by a measure for each country of the range of rankings within which its own ranking is likely to be. The second version includes bars showing how much each of the six variables explains each country’s average life evaluation. We also present the latest version, in Table 2.1, of the equation we use to explain how and why life evaluations vary among countries and over time.
Subsequent sections look separately at the life evaluations for the young, the old, and those in between, compare country rankings for each age group, and show how life evaluations at different ages have changed from a base period[3] of 2006-2010 to the three most recent years, 2021-2023.
We then consider differences among age groups in the levels and trends of positive and negative emotions, proceeding from there to the important topic of inequality. We show that inequality of well-being is generally greater at higher age (perhaps due to differences in health status increasing more among people as individuals age), and has been increasing in all age groups in most global regions.
In the subsequent sections of the chapter, we consider differences by generation as well as by age. In the first of these sections we return to one of the most striking findings in our two previous reports: the sharp increase, in every global region, of benevolent acts in 2020 and after, relative to their levels in the three pre-COVID years 2017-2019. This year we ask whether there have been differences in the extent to which different generations stepped to help others during the pandemic.
We then use new evidence from the Gallup/Meta global state of social connections survey included in the 2022 round of the Gallup World Poll for 140 countries to show how generational differences in feelings of social support, loneliness, and being socially connected relate to six types of reported social interactions and to overall life evaluations.
Finally, we return to international differences in life evaluations at different agesand in different generations. We assess the extent to which the often-found U-shape in age is present or absent across the globe, how these results have changed between 2006-2010 and 2021-2023, and attempt to separate the age-related changes from generational ones.
The concluding section highlights our key results.

Measuring and Explaining National Differences in Life Evaluations
Technical Box 1: Measuring Subjective Well-Being
Our measurement of subjective well-being continues to rely on three main well-being indicators: life evaluations, positive emotions, and negative emotions (described in the report as positive and negative affect). Our happiness rankings are based on life evaluations, as the more stable measure of the quality of people’s lives.
Life evaluations. The Gallup World Poll, which remains the principal source of data in this report, asks respondents to evaluate their current life as a whole using the image of a ladder, with the best possible life for them as a 10 and worst possible as a 0. Each respondent provides a numerical response on this scale, referred to as the Cantril ladder. Typically, around 1,000 responses are gathered annually for each country. Weights are used to construct population-representative national averages for each year in each country. We base our usual happiness rankings on a three-year average of these life evaluations, since the larger sample size enables more precise estimates.
Positive emotions. Positive affect is given by the average of individual yes or no answers about three emotions: laughter, enjoyment, and interest (for details see Technical Box 2).
Negative emotions. Negative affect is given by the average of individual yes or no answers about three emotions: worry, sadness, and anger.
Comparing life evaluations and emotions:
- Life evaluations provide the most informative measure for international comparisons because they capture quality of life in a more complete and stable way than do emotional reports based on daily experiences.
- Life evaluations vary more between countries than do emotions and are better explained by the diverse life experiences in different countries. Emotions yesterday are well explained by events of the day being asked about, while life evaluations more closely reflect the circumstances of life as a whole. We show later in the chapter that emotions are significant supports for life evaluations.
- Positive emotions are still more than twice as frequent as negative emotions, even during the years since the onset of COVID.

Ranking of Happiness 2021-2023
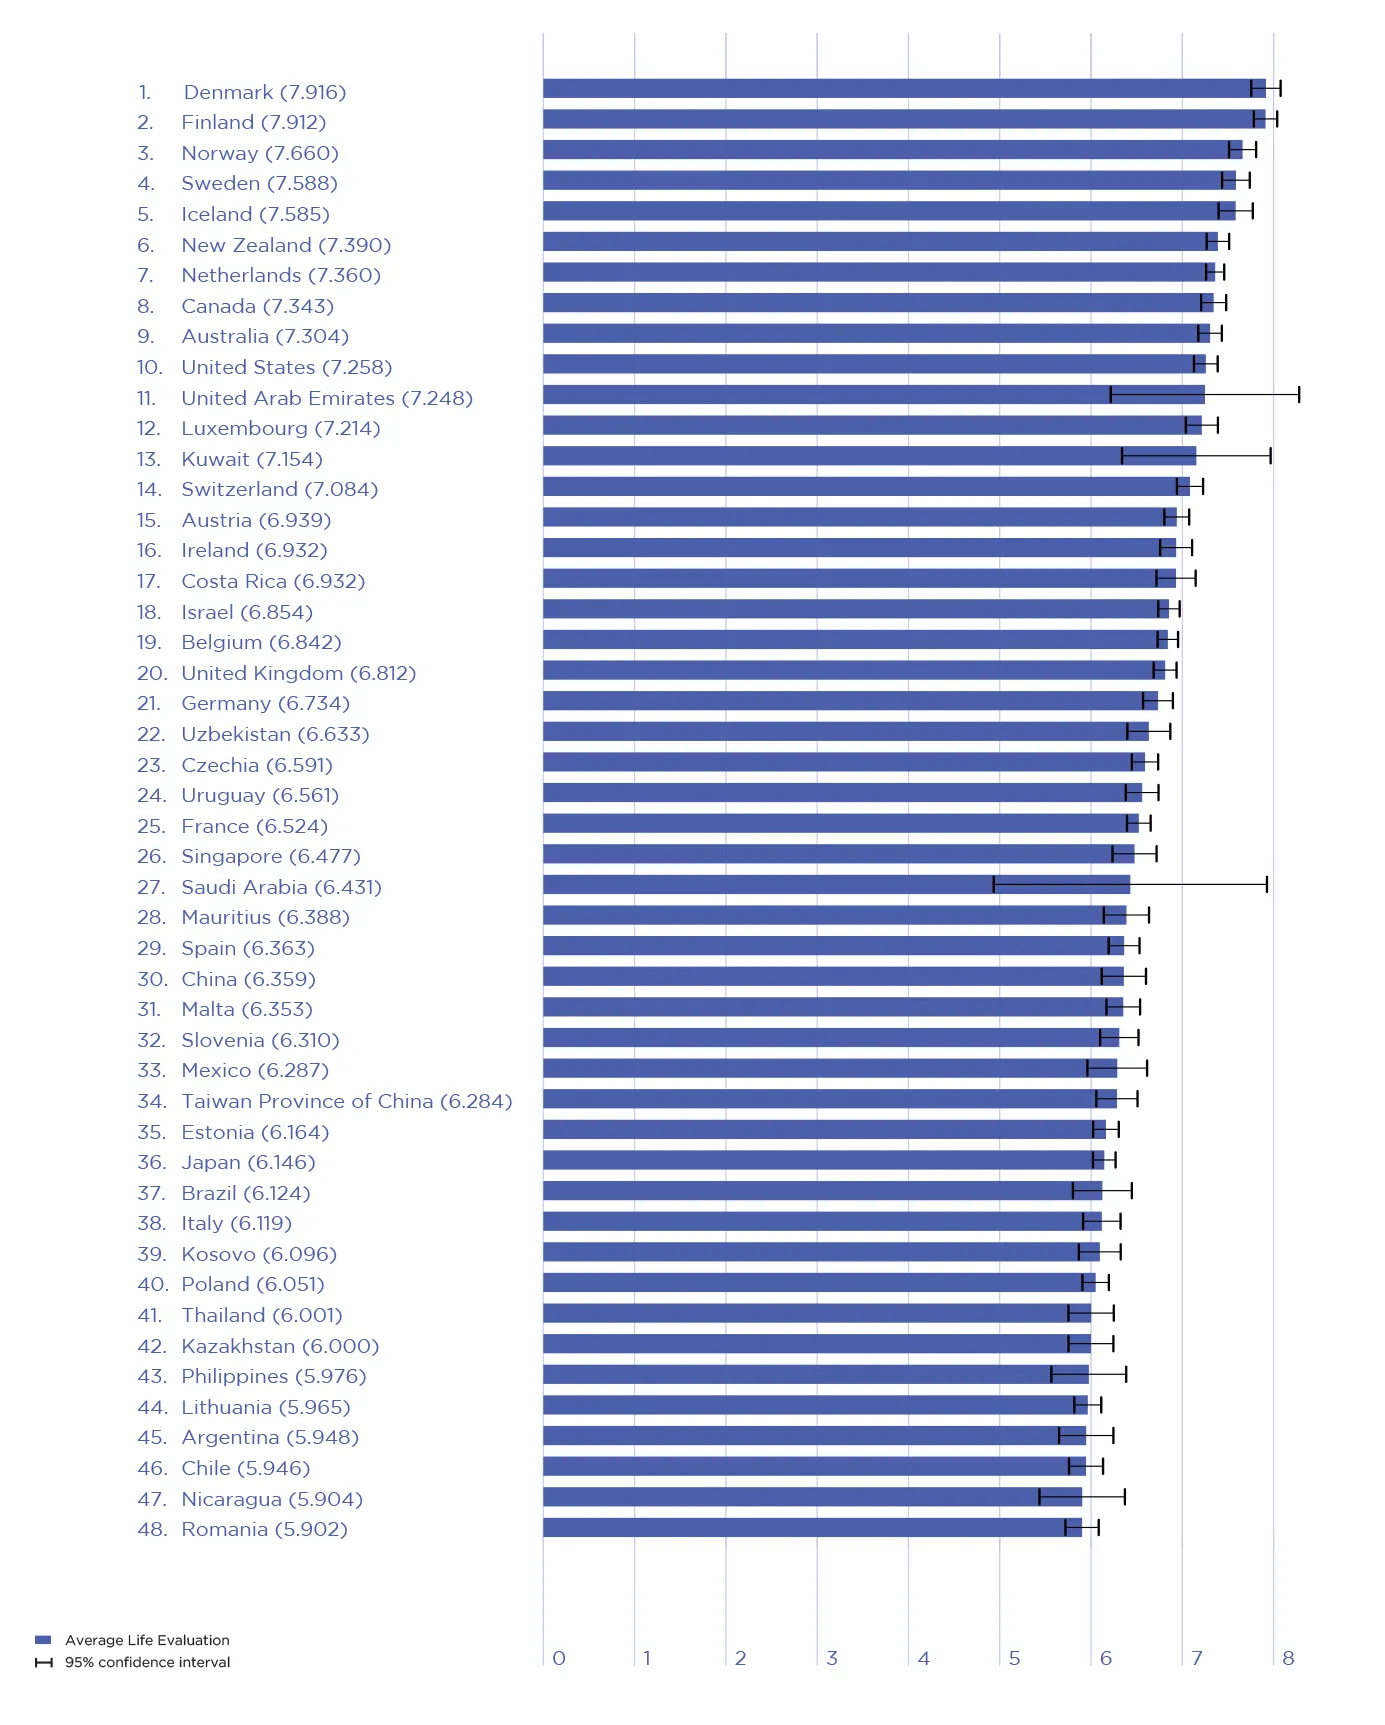
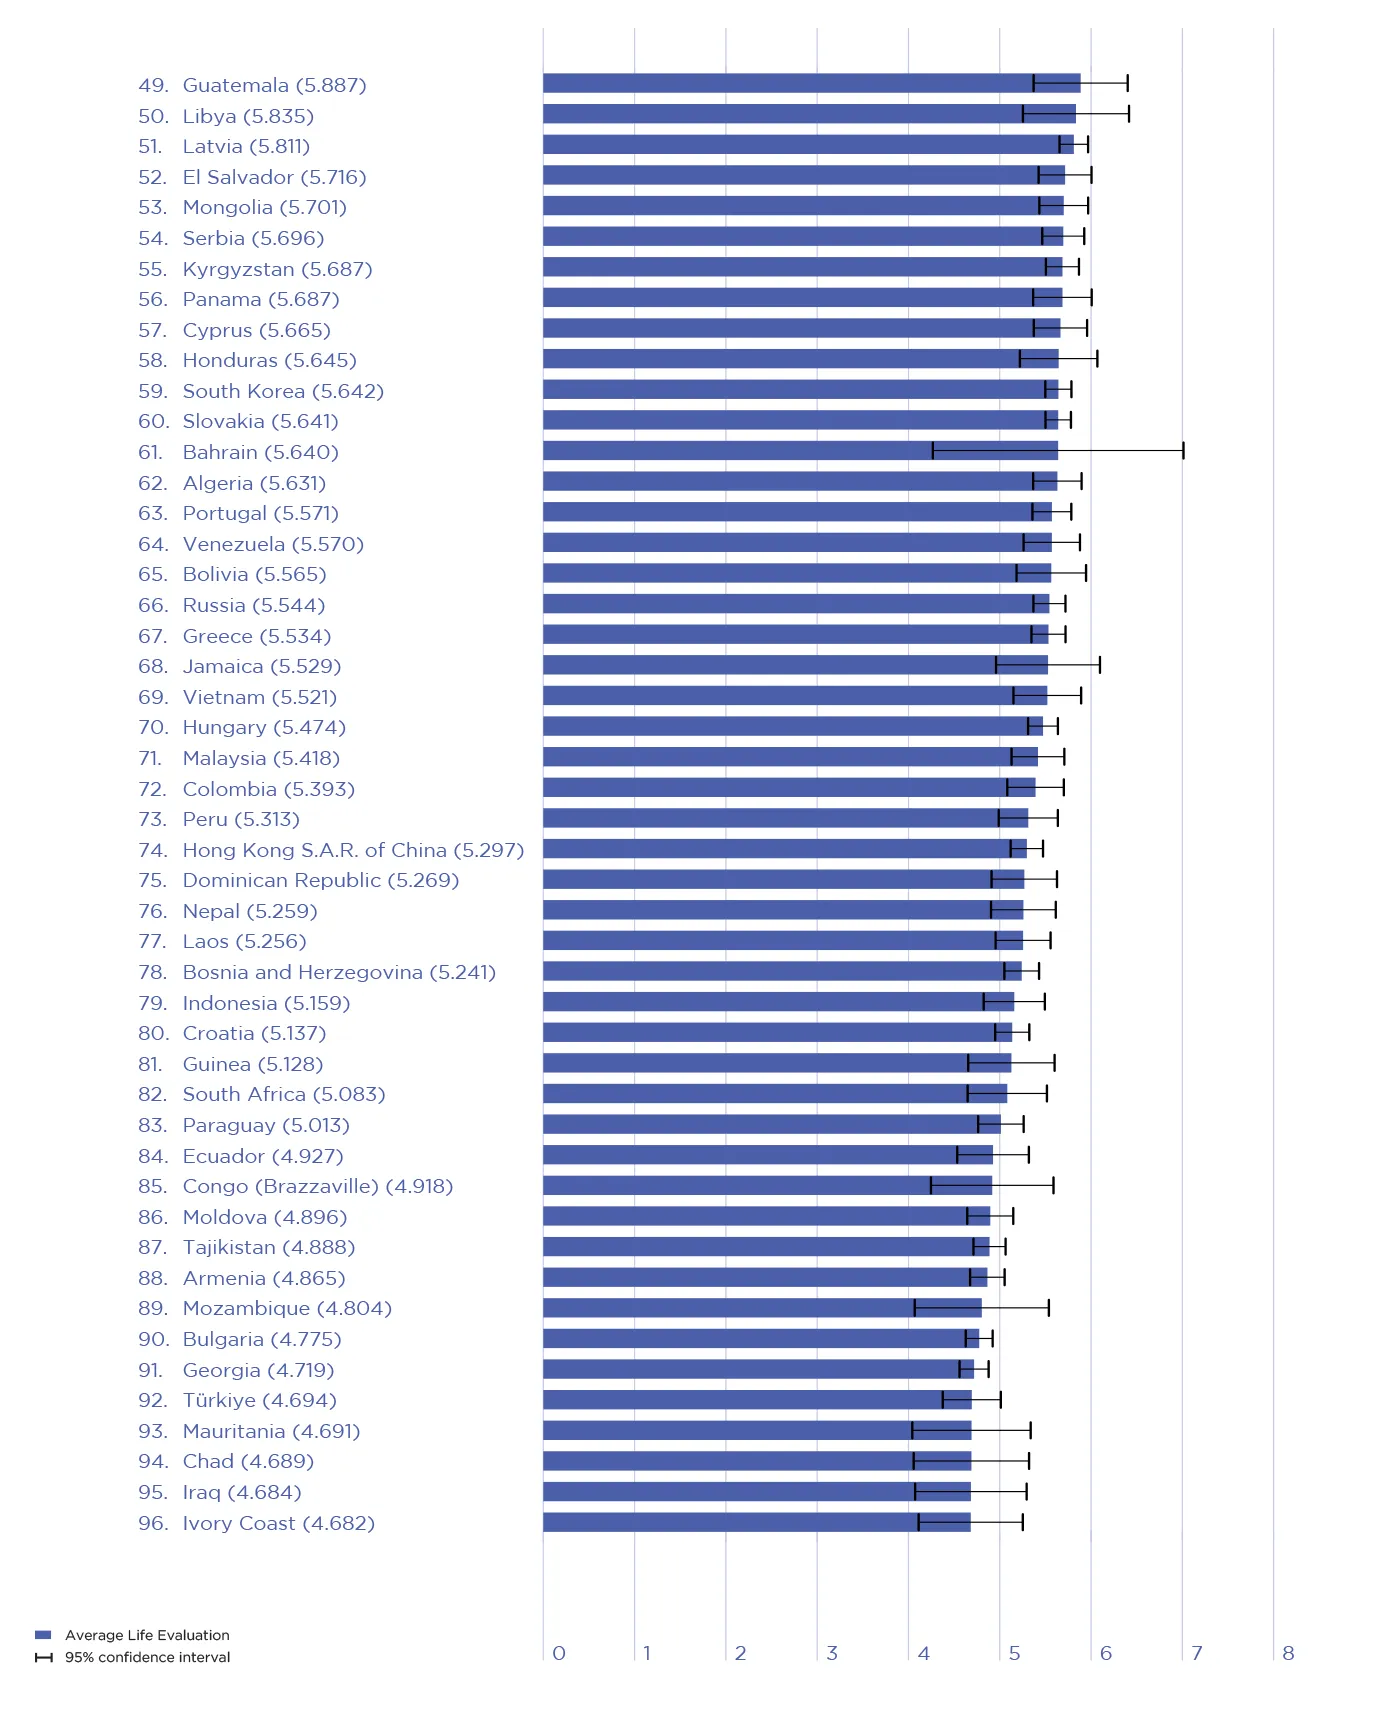
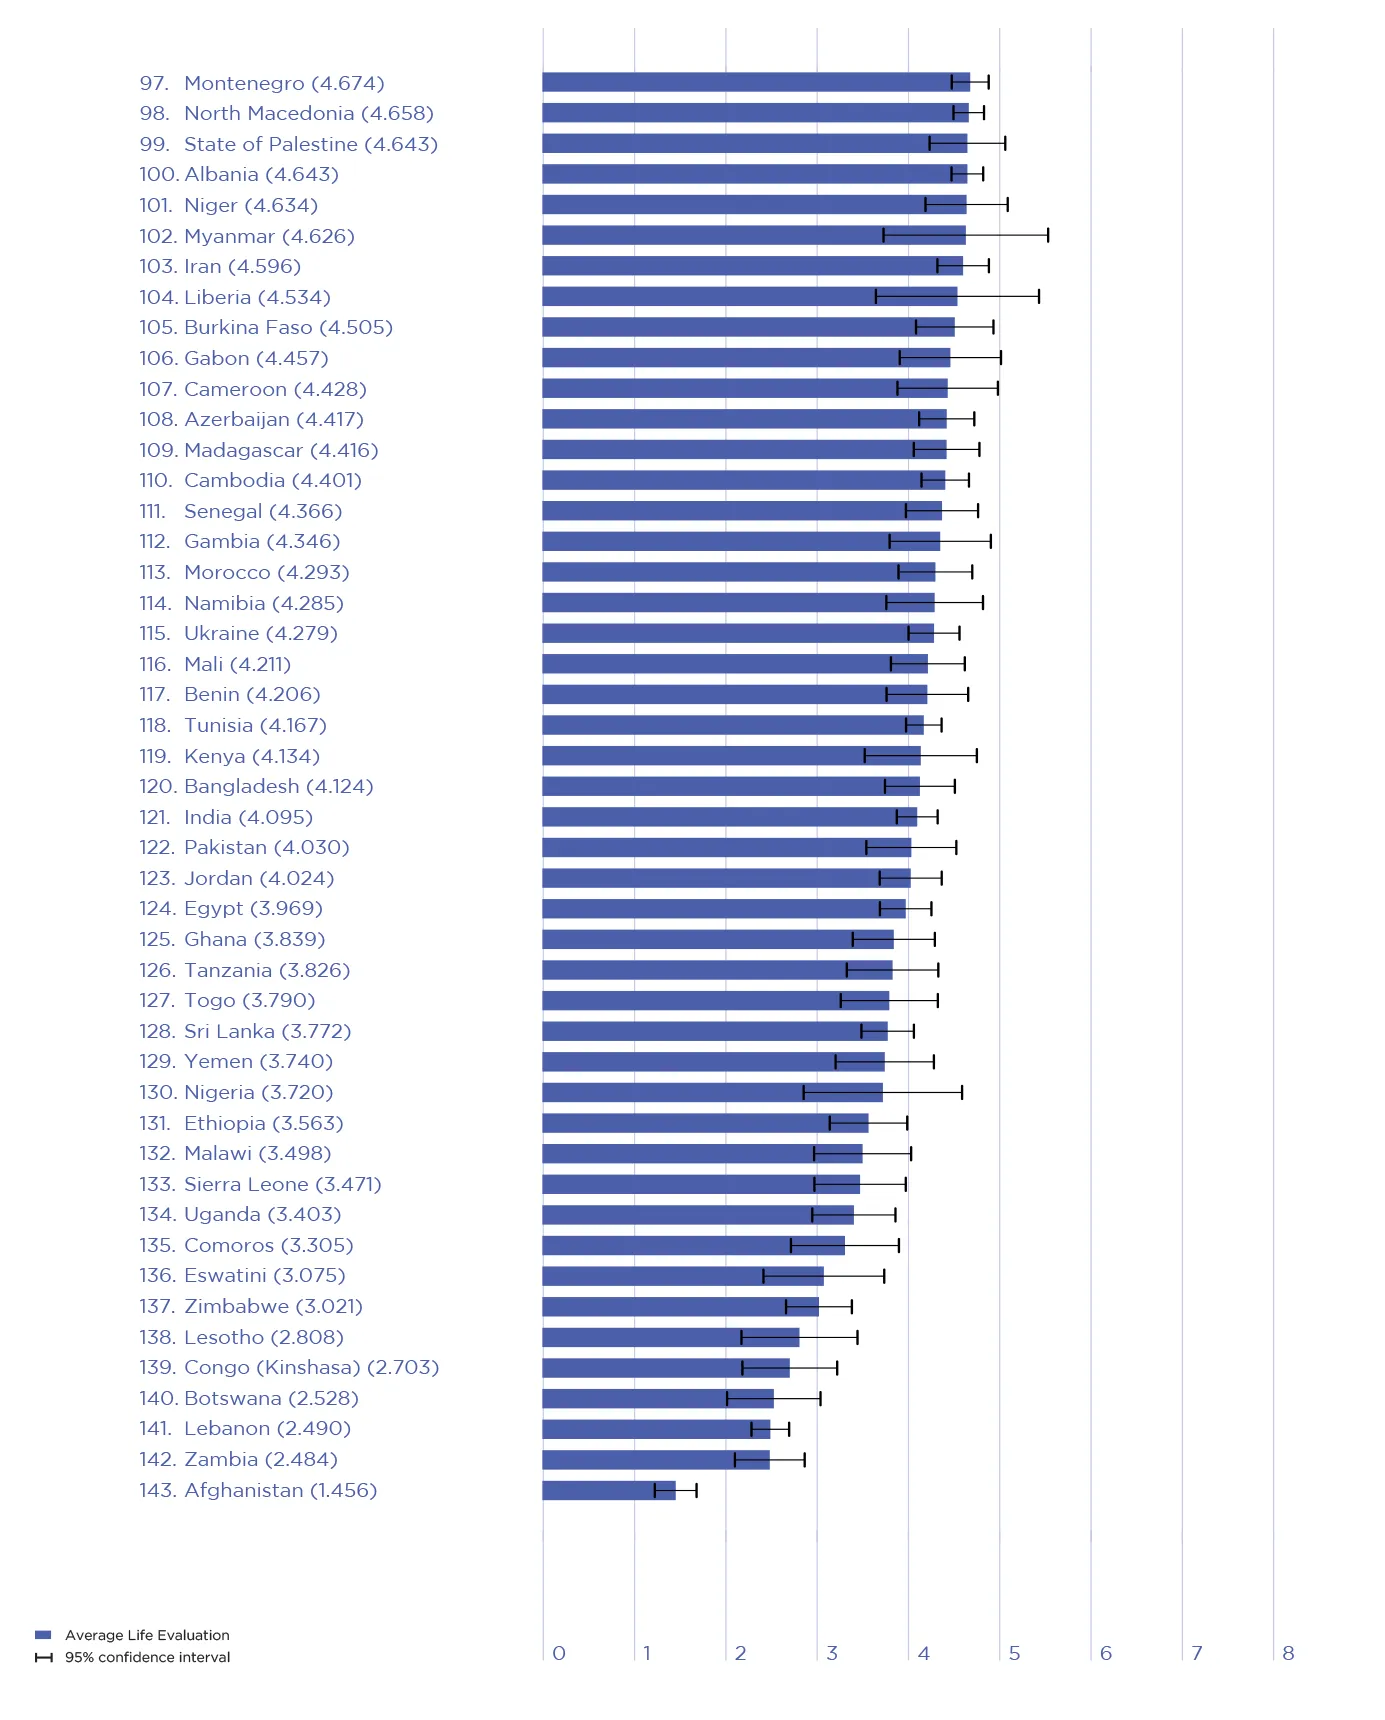
Countries are ranked according to their self-assessed life evaluations (answers to the Cantril ladder question in the Gallup World Poll), averaged over the years 2021-2023.[4] The overall length of each country bar in Figure 2.1 represents the average response to the ladder question. The confidence intervals for each country’s average life evaluation are shown by horizontal whiskers at the right-hand end of each country bar. Confidence intervals for the rank of a country are are shown as part of the online version of Figure 2.1.[5] These ranking ranges are wider where there are many countries with similar averages, and for countries with smaller sample sizes.[6]
The online version Figure 2.1 also includes colour-coded sub-bars in each country row, representing the extent to which six key variables contribute to explaining life evaluations. These variables (described in more detail in Technical Box 2) are GDP per capita, social support, healthy life expectancy, freedom, generosity, and corruption. As already noted, our happiness rankings are not based on any index of these six factors. Rather, scores are based on individuals’ own assessments of their lives, in particular their answers to the single-item Cantril ladder life-evaluation question. We use observed data on the six variables and estimates of their associations with life evaluations to help explain the variation of life evaluations across countries, much as epidemiologists estimate the extent to which life expectancy is affected by factors such as smoking, exercise, and diet.
Figure 2.1: Country Rankings by Life Evaluations in 2021-2023
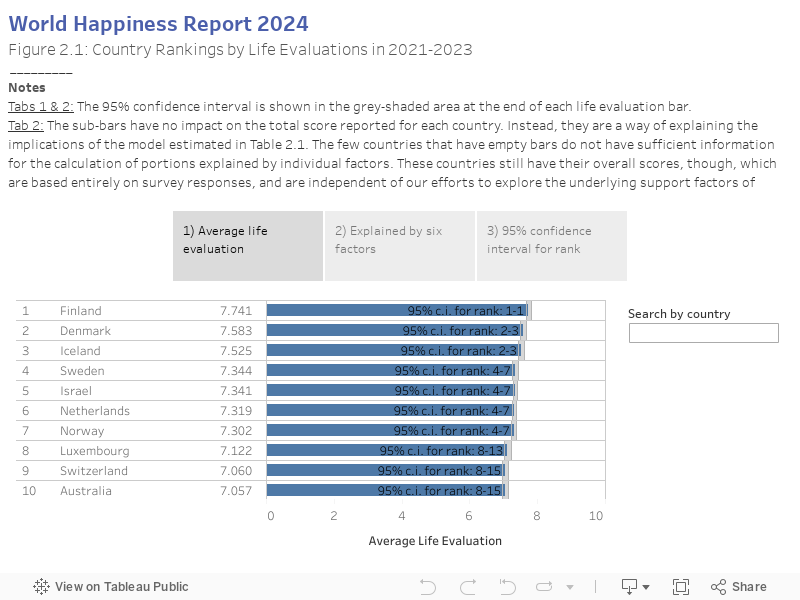
What do the latest data show for the 2021-2023 country rankings?[7]
Two features carry over from previous editions of the World Happiness Report. First, there is still a lot of year-to-year consistency in the way people rate their lives in different countries, and since our rankings are based on a three-year average there is information carried forward from one year to the next. In the case of cataclysmic events happening during a particular year, their effect on the rankings will depend on when the survey took place, and will be muted by the three-year averaging. In the case of the October 7th attack on Israel and the subsequent war between Israel and Hamas, the survey in Palestine took place earlier in the year and the Israel survey after the hostage taking but before much of the subsequent warfare. Life evaluations fell sharply in Israel, by 0.9 on the 10-point scale, only one-third of which will enter the three-year averages discussed below. (See the Statistical Appendix for individual country trajectories on an annual basis, plotted separately by age group and by generation).[8]
Second, there remains a large gap between the top and bottom countries, a full six points (on the 0 to 10 scale) between Finland at the top and Afghanistan at the bottom. The top countries are more tightly grouped than the bottom ones. The top twenty countries all fall within 1 point of each other, compared with a 2.5 point spread among the bottom twenty. The remaining 100-odd countries cover the remaining 2.5 points of the total range. This means that relatively modest changes in a national average can lead to a large shift in ranks, as illustrated by the 95% confidence region exceeding 25 ranks for several countries in the middle of the global list.
Happiness scores are based on the resident populations in each country, rather than their citizenship or place of birth. In World Happiness Report 2018 we split the responses between the locally and foreign-born populations in each country and found the happiness rankings to be essentially the same for the two groups.[9] There was some footprint effect after migration, and some tendency for migrants to move to happier countries, so that among 20 happiest countries in that report, the average happiness for the locally born was about 0.2 points higher than for the foreign-born.
How have the rankings changed since last year? While the top ten countries remain largely unchanged, there has been much more action in the top twenty. Costa Rica and Kuwait are both new entrants[10] to the top 20, at positions 12 and 13. The continuing convergence in happiness levels between the two sides of Europe led last year to Czechia and Lithuania being in the top twenty, nearly joined now by Slovenia in 21st place. The new entrants are matched by the departures of the United States and Germany from the top 20, dropping from 15 and 16 last year to 23 and 24 this year.
The top countries no longer include any of the largest countries. In the top ten countries only the Netherlands and Australia have populations over 15 million. In the whole of the top twenty, only Canada and the United Kingdom have populations over 30 million.

Why do happiness levels differ?
In Table 2.1 we present our latest modelling of national average life evaluations and measures of positive and negative emotions (affect) by country and year.[11] The results in the first column explain national average life evaluations in terms of six key variables: GDP per capita, healthy life expectancy, having someone to count on, freedom to make life choices, generosity, and freedom from corruption.[12] Taken together, these six variables explain more than three-quarters of the variation in national annual average ladder scores across countries and years, using data from 2005 through 2023.[13] The six variables were originally chosen as the best available measures of factors established in both experimental and survey data as having significant links to subjective well-being, and especially to life evaluations.[14] The explanatory power of the unchanged model has gradually increased as we have added more years to the sample, which is now almost three times as large as when the equation was first introduced in World Happiness Report 2013. We keep looking for possible improvements when and if new evidence becomes available.[15]
The second and third columns of Table 2.1 use the same six variables to estimate equations for national averages of positive and negative affect, where both are based on answers about yesterday’s emotional experiences (see Technical Box 2 for how the affect measures are constructed). In general, emotional measures, and especially negative ones, are differently and much less fully explained by the six variables than are life evaluations. Per-capita income and healthy life expectancy have significant effects on life evaluations,[16] but not, in these national average data, on positive emotions.[17] But the social variables do have significant effects on both positive and negative emotions. Bearing in mind that positive and negative emotions are measured on a 0 to 1 scale, while life evaluations are on a 0 to 10 scale, having someone to count on can be seen to have similar proportionate effects on positive and negative emotions as on life evaluations. Freedom and generosity have even larger associations with positive emotions than with the Cantril ladder. Negative emotions are significantly reduced by social support, a sense of freedom, and the absence of corruption.
In the fourth column, we re-estimate the life evaluation equation from column 1, adding both positive and negative emotions to partially implement the Aristotelian presumption that sustained positive emotions are important supports for a good life.[18] The results continue to buttress a finding in psychology that the existence of positive emotions matters more than the absence of negative ones when predicting either longevity[19] or resistance to the common cold.[20] Consistent with this evidence, we find that positive affect has a large and highly significant impact in the final equation of Table 2.1, while negative affect has none. In a parallel way, we show in a later section of this chapter that the effects of a positive social environment are larger than the effects of loneliness in all age groups and generations.
As for the coefficients on the other variables in the fourth column, the changes are substantial only on those variables – especially freedom and generosity – that have the largest impacts on positive affect. Thus we can infer that positive emotions play a strong role in supporting life evaluations, and that much of the impact of freedom and generosity on life evaluations is channelled through their influence on positive emotions. That is, freedom and generosity have large impacts on positive affect, which in turn has a major impact on life evaluations. The Gallup World Poll does not have a widely available measure of life purpose to test whether it also would play a strong role in support of high life evaluations.
| Independent Variable | Dependent Variable | |||
|---|---|---|---|---|
| Cantril Ladder | Positive Affect | Negative Affect | Cantril Ladder | |
| Log GDP per capita | 0.349 | -.015 | -.002 | 0.382 |
| (0.068)*** | (0.009) | (0.007) | (0.066)*** | |
| Social support | 2.563 | 0.315 | -.342 | 1.936 |
| (0.349)*** | (0.056)*** | (0.045)*** | (0.349)*** | |
| Healthy life expectancy at birth | 0.028 | -.0007 | 0.003 | 0.029 |
| (0.011)*** | (0.001) | (0.001)*** | (0.011)*** | |
| Freedom to make life choices | 1.378 | 0.376 | -.090 | 0.571 |
| (0.295)*** | (0.044)*** | (0.039)** | (0.273)** | |
| Generosity | 0.487 | 0.084 | 0.029 | 0.296 |
| (0.252)* | (0.032)*** | (0.027) | (0.241) | |
| Perceptions of corruption | -.733 | -.012 | 0.093 | -.724 |
| (0.256)*** | (0.027) | (0.022)*** | (0.243)*** | |
| Positive affect | 2.206 | |||
| (0.33)*** | ||||
| Negative affect | 0.193 | |||
| (0.381) | ||||
| Year fixed effects | Included | Included | Included | Included |
| Number of countries | 155 | 155 | 155 | 155 |
| Number of obs. | 2103 | 2098 | 2102 | 2097 |
| Adjusted R-squared | 0.757 | 0.43 | 0.343 | 0.781 |
Notes: This is a pooled OLS regression for a tattered panel explaining annual national average Cantril ladder responses from all available surveys from 2005 through 2023. See Technical Box 2 for detailed information about each of the predictors. Coefficients are reported with robust standard errors clustered by country (in parentheses). ***, **, and * indicate significance at the 1, 5, and 10 percent levels respectively.
Technical Box 2: Detailed information about each of the predictors in Table 2.1
- GDP per capita is in terms of Purchasing Power Parity (PPP) adjusted to constant 2017 international dollars, taken from the World Development Indicators (WDI) by the World Bank (version 23, metadata last updated on September 27, 2023). See Statistical Appendix for more details. GDP data for 2023 are not yet available, so we extend the GDP time series from 2022 to 2023 using country-specific forecasts of real GDP growth from the OECD Economic Outlook No. 113 (June 2023) or, if missing, from the World Bank’s Global Economic Prospects (last updated: June 6, 2023), after adjustment for population growth. The equation uses the natural log of GDP per capita, as this form fits the data significantly better than GDP per capita.
- The time series for healthy life expectancy at birth are constructed based on data from the World Health Organization (WHO) Global Health Observatory data repository, with data available for 2005, 2010, 2015, 2016, and 2019. To match this report’s sample period (2005-2023), interpolation and extrapolation are used. See Statistical Appendix for more details.
- Social support is the national average of the binary responses (0=no, 1=yes) to the Gallup World Poll (GWP) question “If you were in trouble, do you have relatives or friends you can count on to help you whenever you need them, or not?”
- Freedom to make life choices is the national average of binary responses to the GWP question “Are you satisfied or dissatisfied with your freedom to choose what you do with your life?”
- Generosity is the residual of regressing the national average of GWP responses to the donation question “Have you donated money to a charity in the past month?” on log GDP per capita.
- Perceptions of corruption are the average of binary answers to two GWP questions: “Is corruption widespread throughout the government or not?” and “Is corruption widespread within businesses or not?” Where data for government corruption are missing, the perception of business corruption is used as the overall corruption-perception measure.
- Positive affect is defined as the average of previous-day affect measures for laughter, enjoyment, and doing interesting things. The inclusion of doing interesting things (first added for World Happiness Report 2022), gives us three components in each of positive and negative affect, and slightly improves the equation fit in column 4. The general form for the affect questions is: Did you experience the following feelings during a lot of the day yesterday? See Statistical Appendix 1 for more details.
- Negative affect is defined as the average of previous-day affect measures for worry, sadness, and anger.
The variables we use in our Table 2.1 modelling may be taking credit properly due to other variables, or to unmeasured factors. There are also likely to be vicious or virtuous circles, with two-way linkages among the variables. For example, there is much evidence that those who have happier lives are likely to live longer,[21] and be more trusting, more cooperative, and generally better able to meet life’s demands.[22] This will double back to improve health, income, generosity, corruption, and a sense of freedom. Collectively, these possibilities suggest that we should interpret the observed relationships with some caution.
Another possible reason for a cautious interpretation of our results is that some of the data come from the same respondents as the life evaluations and are thus possibly determined by common factors. This is less likely when comparing national averages because individual differences in personality and individual life circumstances tend to average out at the national level. To provide even more assurance that our results are not significantly biassed because we are using the same respondents to report life evaluations, social support, freedom, generosity, and corruption, we tested the robustness of our procedure by splitting each country’s respondents randomly into two groups (see Table 10 of Statistical Appendix 1 of World Happiness Report 2018 for more detail). We then examined whether the average values of social support, freedom, generosity, and absence of corruption from one half of the sample explained average life evaluations in the other half of the sample. The coefficients on each of the four variables fell slightly, just as we expected.[23] But the changes were reassuringly small (ranging from 1% to 5%) and were not statistically significant.[24]
Overall, the model explains average life evaluation levels quite well within regions, among regions, and for the world as a whole.[25] On average, the countries of Latin America still have mean life evaluations that are significantly higher (by about 0.5 on the 0 to 10 scale) than predicted by the model. This difference has been attributed to a variety of factors, including some unique features of family and social life in Latin American countries.[26] In partial contrast, countries in East Asia have average life evaluations below predictions, although only slightly and insignificantly so in our latest results.[27] This may reflect, at least in part, cultural differences in the way people think about and report on the quality of their lives.[28] It is reassuring that our findings about the relative importance of the six factors are generally unaffected by whether or not we make explicit allowance for these regional differences.[29]
We once again used the model of Table 2.1 to assess the overall effects of COVID-19 on life evaluations. If we add an indicator for the four COVID years 2020-2023 to our Table 2.1 equation, we find no net increase or decrease in life evaluations.[30] This suggests, in a preliminary way, that the undoubted pains of living through a pandemic were offset by increases in countervailing forces, such as the extent to which respondents had been able to discover and share the capacity to care for each other in difficult times.
How do happiness rankings vary by age group?
Figure 2.2 shows the happiness rankings for the young (under 30), and Figure 2.3 does the same for those over 60.[31]
Figure 2.2: Ranking of Happiness - the Young (Age below 30): 2021-2023
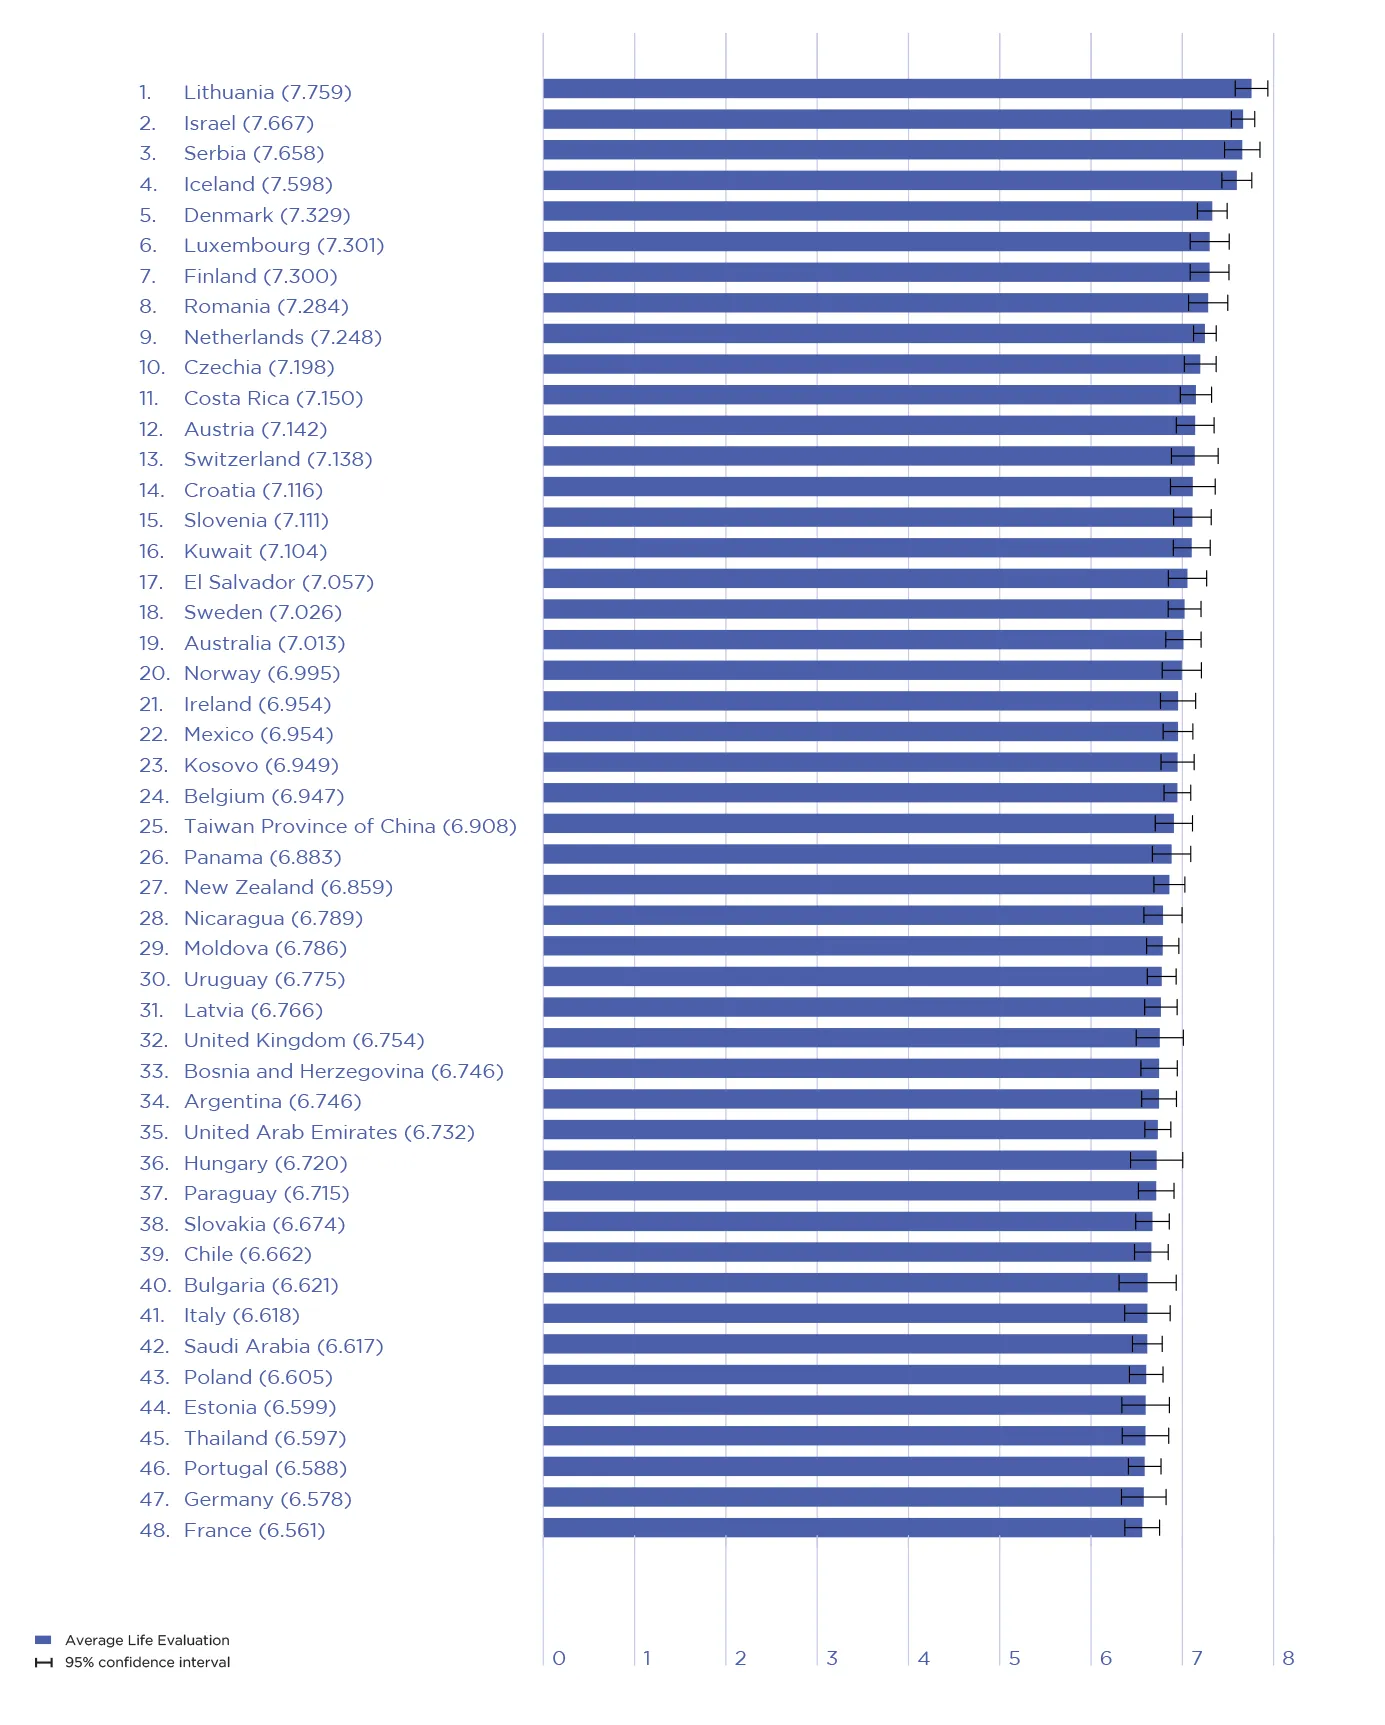
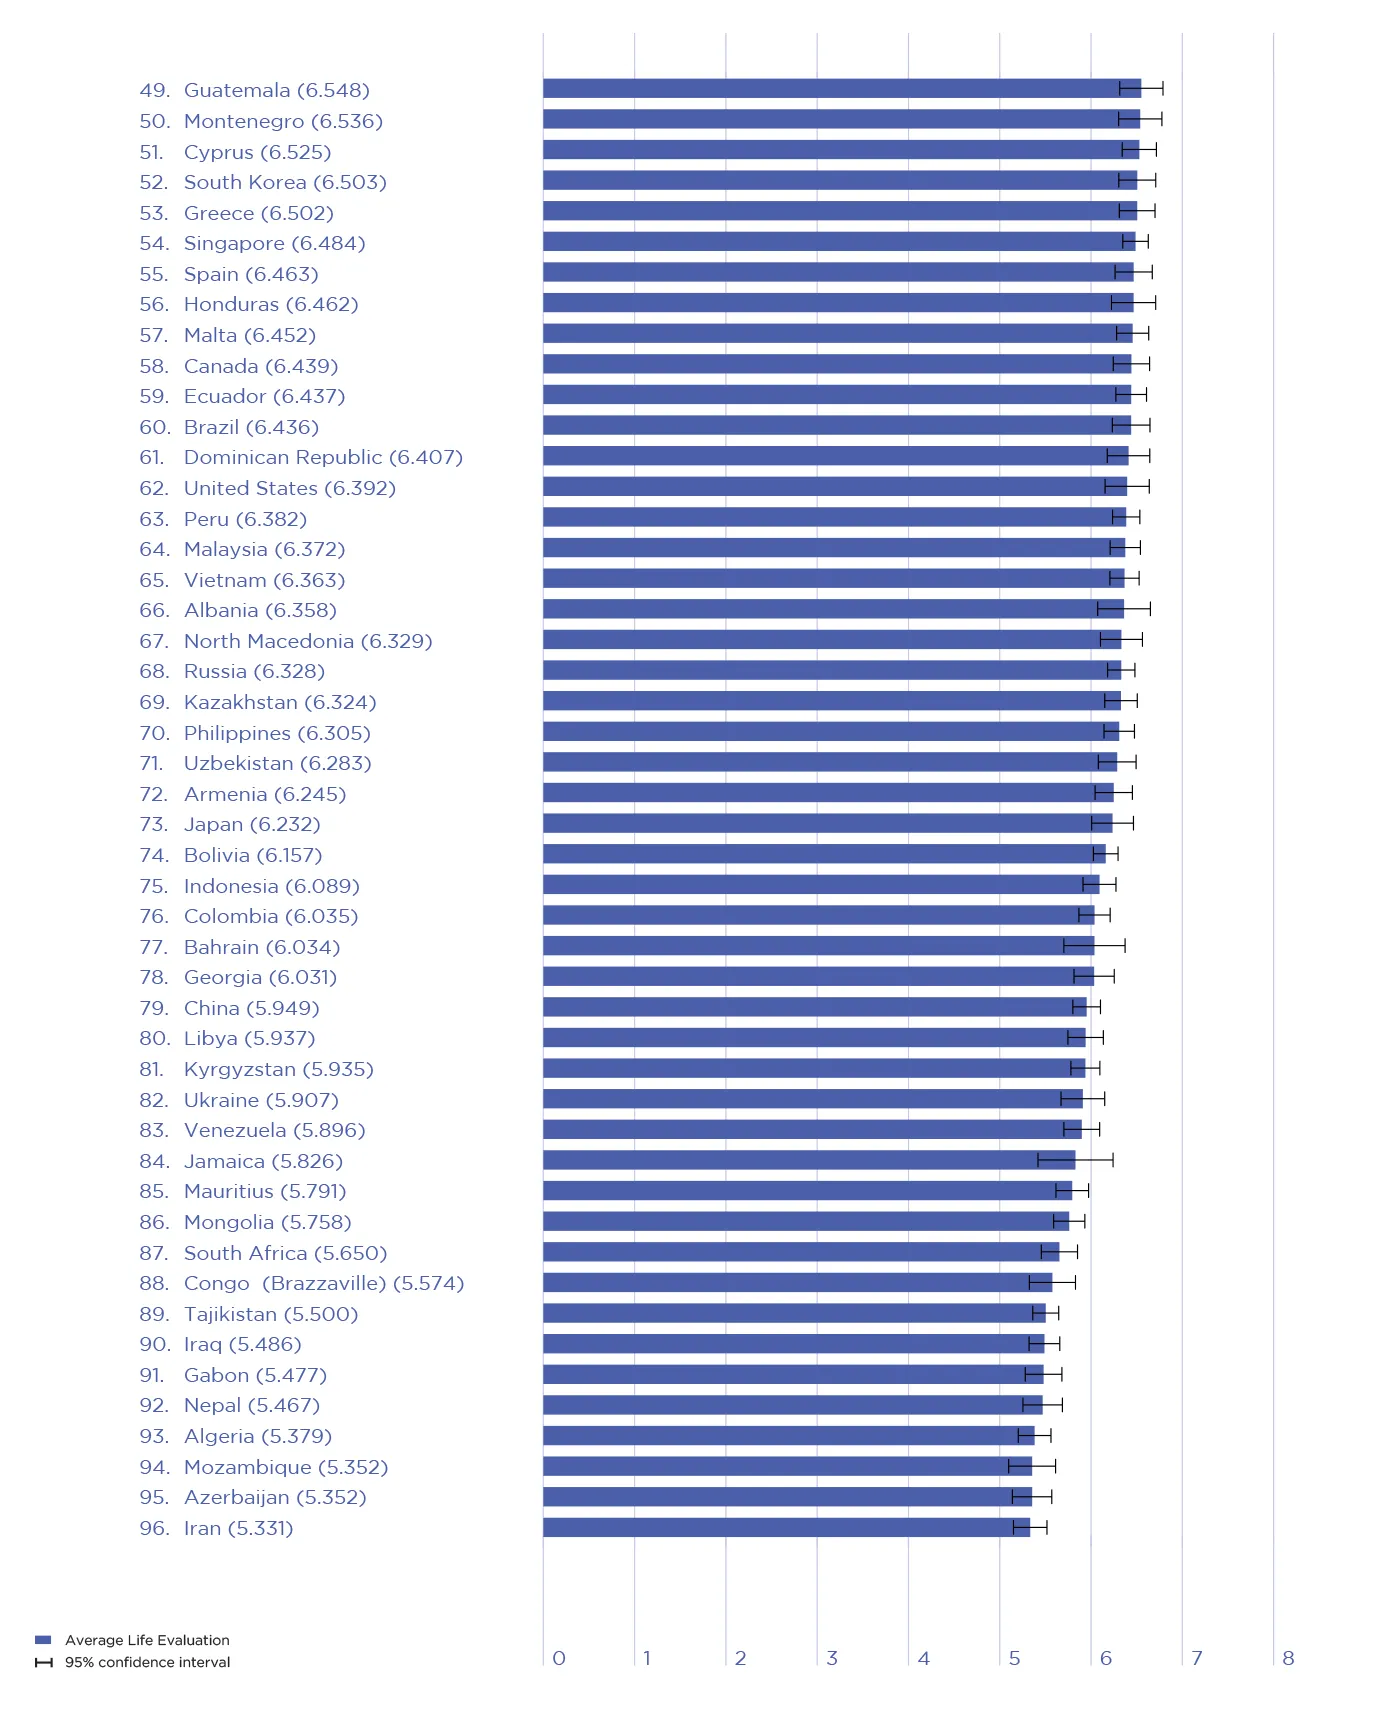
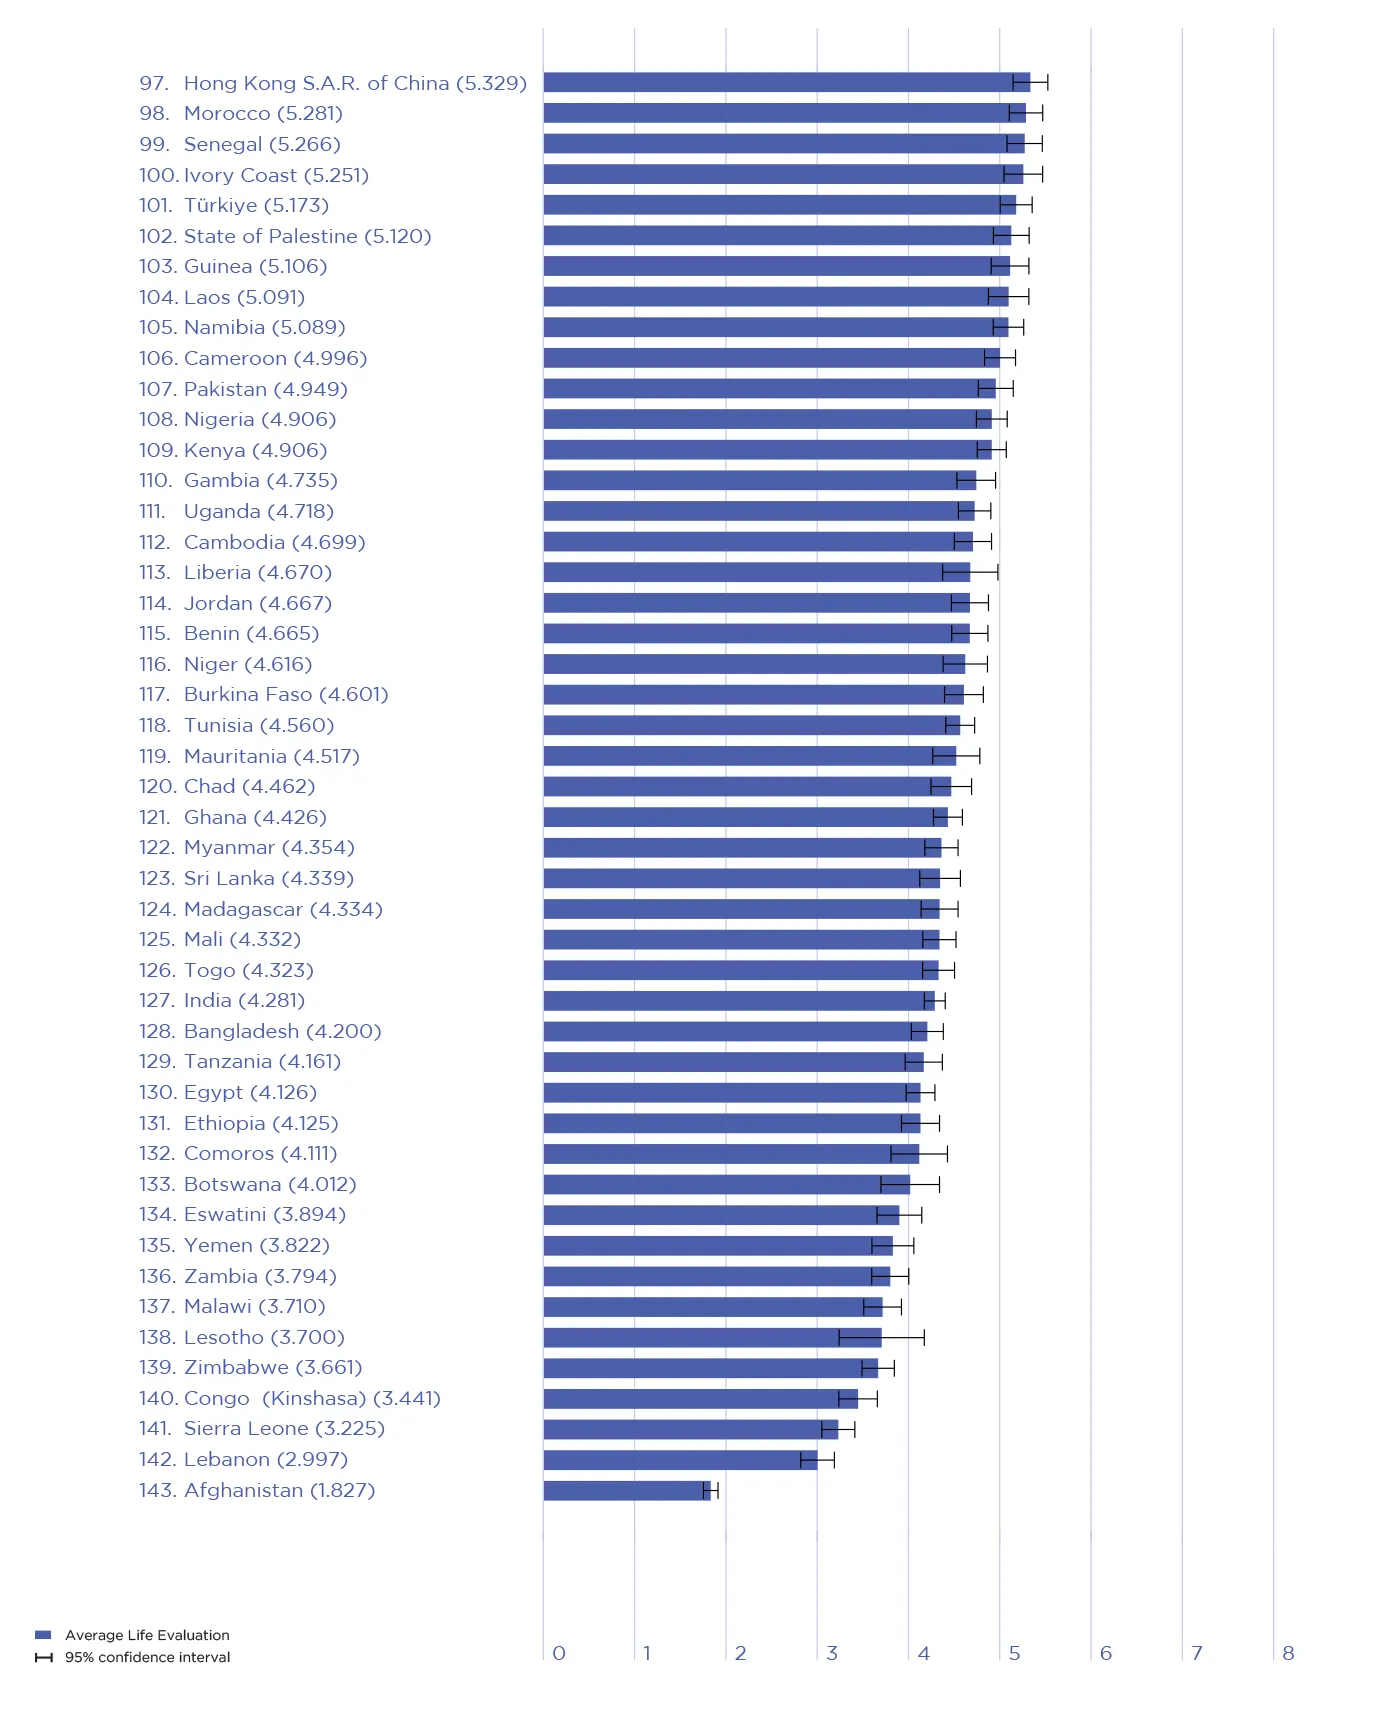
Figure 2.3: Ranking of Happiness - the Old (age 60 and above): 2021-2023

As shown by Figures 2.2 and 2.3, country rankings for the young and the old are quite different, and systematically so. For example, Lithuania, a recent entrant to the overall top twenty, ranks number 1 for those under 30 compared to 44 for those over 60, underscoring the fact that convergence between the two halves of Europe has been driven mainly by the rising happiness of the young. Countries ranking highest for the old are generally countries with high overall rankings, but include several where the young have recently fared very poorly.
To better illustrate the overall patterns of international differences in happiness at different ages, Table 2.2 shows for each country the ranking of its life evaluations for the whole population (in the first column) and then four age groups- under 30, 30-44, 45-59, and 60+. The two columns at the right hand side of the table show for each country the happiest and least happy ages. The countries are listed in order of 2021-2023 average life evaluations for the whole population, the same order as is used for Figure 2.1. Countries with very different rankings at different ages reflect something unusual, relative to the world average experience for each age group. For example, the four countries in the NANZ group - the United States, Canada, Australia and New Zealand - all have rankings for the young that are much worse than for the old, with the biggest discrepancies in the United States and Canada where the gap is 50 places or more. As we shall see in the following sections, these gaps have mainly arisen since 2010, and probably involve some mix of generational and age effects.
There are many more countries where the rankings for the young are more than 40 places higher than for the old, mainly in Central and Eastern Europe and Latin America. The biggest gap is in Croatia, where the ranking for the young is 66 places higher than for the old. There are gaps of 50 or more places for Bulgaria, Moldova, and Serbia, and between 40 and 50 places in Romania, Bosnia and Herzegovina, Montenegro, and Paraguay. There are clearly generational as well as age effects at play here as well, as the older populations of Bosnia, Serbia, Croatia, and Montenegro bear the most scars from the early 1990s wars and genocide following the breakup of the former Yugoslavia.[32]
| Country | All Ages | The Young | Lower Middle | Upper Middle | The Old | Happiest | Least Happy | |
|---|---|---|---|---|---|---|---|---|
| Finland | 1 | 7 | 1 | 1 | 2 | Old | Young | |
| Denmark | 2 | 5 | 3 | 4 | 1 | Old | Young | |
| Iceland | 3 | 4 | 4 | 2 | 5 | Young | LowerMiddle | |
| Sweden | 4 | 18 | 8 | 3 | 4 | Old | Young | |
| Israel | 5 | 2 | 2 | 7 | 18 | Young | Old | |
| Netherlands | 6 | 9 | 5 | 5 | 7 | Old | Young | |
| Norway | 7 | 20 | 6 | 6 | 3 | Old | Young | |
| Luxembourg | 8 | 6 | 11 | 8 | 12 | Young | LowerMiddle | |
| Switzerland | 9 | 13 | 9 | 11 | 14 | Young | UpperMiddle | |
| Australia | 10 | 19 | 14 | 10 | 9 | Old | LowerMiddle | |
| New Zealand | 11 | 27 | 18 | 13 | 6 | Old | LowerMiddle | |
| Costa Rica | 12 | 11 | 15 | 23 | 17 | Young | UpperMiddle | |
| Kuwait | 13 | 16 | 20 | 9 | 13 | Old | LowerMiddle | |
| Austria | 14 | 12 | 17 | 18 | 15 | Young | UpperMiddle | |
| Canada | 15 | 58 | 28 | 12 | 8 | Old | Young | |
| Belgium | 16 | 24 | 13 | 15 | 19 | LowerMiddle | Old | |
| Ireland | 17 | 21 | 21 | 21 | 16 | Young | UpperMiddle | |
| Czechia | 18 | 10 | 12 | 22 | 23 | Young | Old | |
| Lithuania | 19 | 1 | 7 | 20 | 44 | Young | Old | |
| United Kingdom | 20 | 32 | 27 | 19 | 20 | Old | LowerMiddle | |
| Slovenia | 21 | 15 | 10 | 27 | 32 | Young | Old | |
| United Arab Emirates | 22 | 35 | 25 | 16 | 11 | Old | LowerMiddle | |
| United States | 23 | 62 | 42 | 17 | 10 | Old | LowerMiddle | |
| Germany | 24 | 47 | 16 | 28 | 21 | LowerMiddle | Young | |
| Mexico | 25 | 22 | 19 | 32 | 33 | Young | Old | |
| Uruguay | 26 | 30 | 22 | 34 | 24 | Young | UpperMiddle | |
| France | 27 | 48 | 23 | 26 | 25 | LowerMiddle | Old | |
| Saudi Arabia | 28 | 42 | 39 | 14 | 27 | UpperMiddle | LowerMiddle | |
| Kosovo | 29 | 23 | 37 | 33 | 39 | Young | Old | |
| Singapore | 30 | 54 | 36 | 25 | 26 | UpperMiddle | Old | |
| Taiwan Province of China | 31 | 25 | 35 | 31 | 34 | Young | Old | |
| Romania | 32 | 8 | 26 | 35 | 48 | Young | Old | |
| El Salvador | 33 | 17 | 38 | 45 | 52 | Young | Old | |
| Estonia | 34 | 44 | 24 | 30 | 35 | LowerMiddle | Old | |
| Poland | 35 | 43 | 34 | 24 | 40 | UpperMiddle | Old | |
| Spain | 36 | 55 | 40 | 29 | 29 | UpperMiddle | Old | |
| Serbia | 37 | 3 | 29 | 44 | 54 | Young | Old | |
| Chile | 38 | 39 | 32 | 42 | 46 | Young | Old | |
| Panama | 39 | 26 | 43 | 41 | 56 | Young | Old | |
| Malta | 40 | 57 | 41 | 38 | 31 | Young | UpperMiddle | |
| Italy | 41 | 41 | 31 | 39 | 38 | Young | Old | |
| Guatemala | 42 | 49 | 46 | 54 | 49 | Young | Old | |
| Nicaragua | 43 | 28 | 53 | 61 | 47 | Young | UpperMiddle | |
| Brazil | 44 | 60 | 44 | 40 | 37 | Young | Old | |
| Slovakia | 45 | 38 | 33 | 37 | 60 | Young | Old | |
| Latvia | 46 | 31 | 30 | 49 | 51 | Young | Old | |
| Uzbekistan | 47 | 71 | 62 | 36 | 22 | Old | LowerMiddle | |
| Argentina | 48 | 34 | 52 | 64 | 45 | Young | UpperMiddle | |
| Kazakhstan | 49 | 69 | 48 | 43 | 42 | Young | Old | |
| Cyprus | 50 | 51 | 49 | 62 | 57 | Young | Old | |
| Japan | 51 | 73 | 63 | 52 | 36 | Young | LowerMiddle | |
| South Korea | 52 | 52 | 45 | 55 | 59 | Young | Old | |
| Philippines | 53 | 70 | 68 | 58 | 43 | Young | LowerMiddle | |
| Vietnam | 54 | 65 | 54 | 53 | 69 | Young | Old | |
| Portugal | 55 | 46 | 50 | 46 | 63 | Young | Old | |
| Hungary | 56 | 36 | 51 | 48 | 70 | Young | Old | |
| Paraguay | 57 | 37 | 59 | 75 | 83 | Young | Old | |
| Thailand | 58 | 45 | 69 | 69 | 41 | Young | UpperMiddle | |
| Malaysia | 59 | 64 | 66 | 60 | 71 | Young | Old | |
| China | 60 | 79 | 67 | 57 | 30 | Old | LowerMiddle | |
| Honduras | 61 | 56 | 72 | 73 | 58 | Young | UpperMiddle | |
| Bahrain | 62 | 77 | 60 | 50 | 61 | Young | Old | |
| Croatia | 63 | 14 | 47 | 59 | 80 | Young | Old | |
| Greece | 64 | 53 | 58 | 56 | 67 | Young | Old | |
| Bosnia and Herzegovina | 65 | 33 | 65 | 67 | 78 | Young | Old | |
| Libya | 66 | 80 | 73 | 51 | 50 | UpperMiddle | LowerMiddle | |
| Jamaica | 67 | 84 | 61 | 47 | 68 | UpperMiddle | Old | |
| Peru | 68 | 63 | 64 | 80 | 73 | Young | UpperMiddle | |
| Dominican Republic | 69 | 61 | 70 | 79 | 75 | Young | Old | |
| Mauritius | 70 | 85 | 77 | 63 | 28 | Old | LowerMiddle | |
| Moldova | 71 | 29 | 55 | 66 | 86 | Young | Old | |
| Russia | 72 | 68 | 57 | 78 | 66 | Young | UpperMiddle | |
| Bolivia | 73 | 74 | 75 | 77 | 65 | Young | UpperMiddle | |
| Ecuador | 74 | 59 | 79 | 89 | 84 | Young | Old | |
| Kyrgyzstan | 75 | 81 | 81 | 68 | 55 | Young | LowerMiddle | |
| Montenegro | 76 | 50 | 56 | 70 | 97 | Young | Old | |
| Mongolia | 77 | 86 | 74 | 65 | 53 | Young | LowerMiddle | |
| Colombia | 78 | 76 | 78 | 71 | 72 | Young | Old | |
| Venezuela | 79 | 83 | 80 | 83 | 64 | Young | UpperMiddle | |
| Indonesia | 80 | 75 | 82 | 84 | 79 | Young | Old | |
| Bulgaria | 81 | 40 | 71 | 74 | 90 | Young | Old | |
| Armenia | 82 | 72 | 83 | 88 | 88 | Young | Old | |
| South Africa | 83 | 87 | 84 | 81 | 82 | Young | Old | |
| North Macedonia | 84 | 67 | 76 | 85 | 98 | Young | Old | |
| Algeria | 85 | 93 | 85 | 82 | 62 | Old | UpperMiddle | |
| Hong Kong S.A.R. of China | 86 | 97 | 89 | 72 | 74 | UpperMiddle | LowerMiddle | |
| Albania | 87 | 66 | 86 | 97 | 100 | Young | Old | |
| Tajikistan | 88 | 89 | 88 | 86 | 87 | Young | Old | |
| Congo (Brazzaville) | 89 | 88 | 97 | 90 | 85 | Young | Old | |
| Mozambique | 90 | 94 | 87 | 96 | 89 | Young | UpperMiddle | |
| Georgia | 91 | 78 | 91 | 91 | 91 | Young | Old | |
| Iraq | 92 | 90 | 96 | 94 | 95 | Young | Old | |
| Nepal | 93 | 92 | 101 | 93 | 76 | Young | UpperMiddle | |
| Laos | 94 | 104 | 93 | 76 | 77 | UpperMiddle | LowerMiddle | |
| Gabon | 95 | 91 | 99 | 100 | 106 | Young | Old | |
| Ivory Coast | 96 | 100 | 92 | 95 | 96 | Young | Old | |
| Guinea | 97 | 103 | 94 | 99 | 81 | Old | UpperMiddle | |
| Türkiye | 98 | 101 | 98 | 92 | 92 | Young | Old | |
| Senegal | 99 | 99 | 104 | 102 | 111 | Young | Old | |
| Iran | 100 | 96 | 100 | 104 | 103 | Young | UpperMiddle | |
| Azerbaijan | 101 | 95 | 103 | 103 | 108 | Young | Old | |
| Nigeria | 102 | 108 | 95 | 87 | 130 | UpperMiddle | Old | |
| State of Palestine | 103 | 102 | 105 | 109 | 99 | Young | UpperMiddle | |
| Cameroon | 104 | 106 | 102 | 98 | 107 | Young | Old | |
| Ukraine | 105 | 82 | 90 | 110 | 115 | Young | Old | |
| Namibia | 106 | 105 | 106 | 101 | 114 | Young | Old | |
| Morocco | 107 | 98 | 108 | 107 | 113 | Young | Old | |
| Pakistan | 108 | 107 | 109 | 113 | 122 | Young | Old | |
| Niger | 109 | 116 | 110 | 114 | 101 | Old | UpperMiddle | |
| Burkina Faso | 110 | 117 | 107 | 116 | 105 | LowerMiddle | UpperMiddle | |
| Mauritania | 111 | 119 | 112 | 106 | 93 | Old | LowerMiddle | |
| Gambia | 112 | 110 | 116 | 115 | 112 | Young | LowerMiddle | |
| Chad | 113 | 120 | 111 | 111 | 94 | Old | UpperMiddle | |
| Kenya | 114 | 109 | 119 | 123 | 119 | Young | UpperMiddle | |
| Tunisia | 115 | 118 | 113 | 108 | 118 | Young | Old | |
| Benin | 116 | 115 | 117 | 122 | 117 | Young | UpperMiddle | |
| Uganda | 117 | 111 | 118 | 124 | 134 | Young | Old | |
| Myanmar | 118 | 122 | 115 | 105 | 102 | Old | LowerMiddle | |
| Cambodia | 119 | 112 | 122 | 120 | 110 | Young | LowerMiddle | |
| Ghana | 120 | 121 | 114 | 119 | 125 | Young | Old | |
| Liberia | 121 | 113 | 126 | 127 | 104 | Young | UpperMiddle | |
| Mali | 122 | 125 | 120 | 118 | 116 | Young | LowerMiddle | |
| Madagascar | 123 | 124 | 123 | 117 | 109 | Old | LowerMiddle | |
| Togo | 124 | 126 | 121 | 112 | 127 | UpperMiddle | Old | |
| Jordan | 125 | 114 | 124 | 130 | 123 | Young | UpperMiddle | |
| India | 126 | 127 | 127 | 121 | 121 | Young | LowerMiddle | |
| Egypt | 127 | 130 | 125 | 126 | 124 | Young | UpperMiddle | |
| Sri Lanka | 128 | 123 | 128 | 128 | 128 | Young | UpperMiddle | |
| Bangladesh | 129 | 128 | 129 | 129 | 120 | Young | UpperMiddle | |
| Ethiopia | 130 | 131 | 130 | 125 | 131 | Young | LowerMiddle | |
| Tanzania | 131 | 129 | 132 | 131 | 126 | Young | UpperMiddle | |
| Comoros | 132 | 132 | 139 | 133 | 135 | Young | LowerMiddle | |
| Yemen | 133 | 135 | 135 | 136 | 129 | Young | UpperMiddle | |
| Zambia | 134 | 136 | 131 | 138 | 142 | Young | Old | |
| Eswatini | 135 | 134 | 134 | 137 | 136 | Young | UpperMiddle | |
| Malawi | 136 | 137 | 140 | 135 | 132 | Young | LowerMiddle | |
| Botswana | 137 | 133 | 133 | 140 | 140 | Young | Old | |
| Zimbabwe | 138 | 139 | 138 | 139 | 137 | Young | UpperMiddle | |
| Congo (Kinshasa) | 139 | 140 | 137 | 134 | 139 | Young | Old | |
| Sierra Leone | 140 | 141 | 136 | 132 | 133 | Old | LowerMiddle | |
| Lesotho | 141 | 138 | 141 | 142 | 138 | Young | UpperMiddle | |
| Lebanon | 142 | 142 | 142 | 141 | 141 | Young | Old | |
| Afghanistan | 143 | 143 | 143 | 143 | 143 | Young | Old | |
The ranking gaps are imperfect measures of the happiness gaps between the old and young, because the distribution of country averages is much more tightly spaced in the middle, where a small change in average happiness can translate to many ranks. There are fewer countries with large rank differences at both ends of the distribution, where the ranks are most consistent. A country at the top of the overall ranking has to have pretty high happiness in all age groups, while in the really unhappy countries there are no happy age groups. Thus to assess happiness at different ages it is better to look at the average reported happiness levels at different ages, as we now do.
What is typical for happiness at different ages?[33] Figure 2.4 shows average life evaluations in the four age groups for the world as a whole and for each of ten regions, separately for males and females. For the world as a whole, in recent years, there is a gradual slight decline in average happiness as age increases.[34] As will be shown by Figure 2.5 and 2.6 in the next section, it has not always been thus, as in the early years of the Gallup World Poll (2006-2010) the young were the happiest group, followed by those over 60 and then those 30 to 44, with 45-59 as the least happy group.
Figure 2.4 Happiness at different ages, 2021-2023
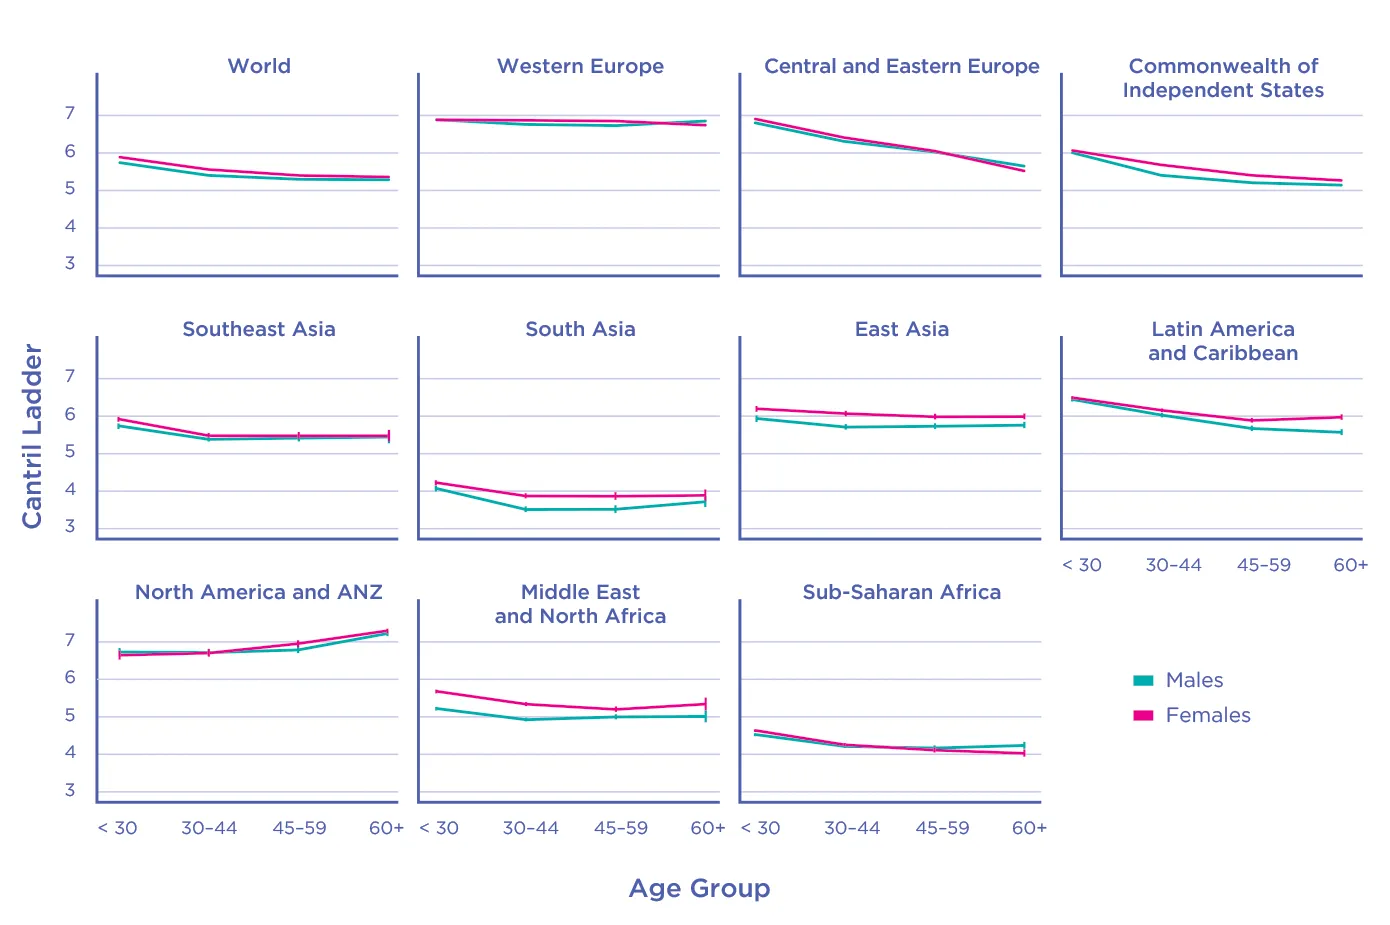
The first panel of Figure 2.4 displays a fairly flat global pattern of life evaluations across age groups, with the young on average happier than the old, and a slight gender difference favouring females.[35] This global average obscures a range of regional experiences. When considering the regional differences, and how they contribute to the global average, it is important to remember that every country has equal weight in the regional and global averages, so that the regions with more countries contribute correspondingly more to the global averages.[36] Considering the regions in the order shown in Table 2.4, Western Europe has an almost completely flat profile across the age groups, although Table 2.2 and Figures 2.2 and 2.3 show a variety of experiences within the region. For example, Norway, Sweden, Germany, France, the United Kingdom and Spain are countries where the old are now significantly happier than the young, while Portugal and Greece show the reverse pattern.
The countries of Central and Eastern Europe show much higher life evaluations for the young, with a steady decline across age groups thereafter, accumulating to a gap between the young and the old of more than a full point on the 0 to 10 scale. This pattern is slightly more pronounced for females than for males. The twelve countries in the Commonwealth of Independent States, with Russia and Ukraine as the largest, show a more muted pattern than in Central and Eastern Europe, and with a larger mid-life drop for males than for females.
The ten countries of Southeast Asia, with Indonesia the largest and Singapore the smallest, show a declining structure of happiness across age groups and a gender difference favouring young females, with the largest contribution to this effect coming from Singapore.
In South Asia, happiness is lowest in the middle age groups, especially for males, exposing a large middle age life evaluation gap favouring females, with a definite U-shape for males.
In East Asia, there is a general slight downward tilt with age, with females happier than males in all age groups.
In Latin America and the Caribbean, there is a general downward trend across ages less than 60, with an increase thereafter for females. Male and female happiness is equal under the age of 30, with a growing age gap thereafter favouring females.
In North America, Australia and New Zealand, life evaluations in 2021-2023 were lowest among the young, rising gradually with age to be highest among the old. The age gap favouring the old is evident in all four countries, while being much larger in the United States and Canada. The only significant gender gap is in older middle age, favouring females.
For the twenty countries of the Middle East and North Africa, by contrast, happiness is highest for the young, especially young females, and then falls steadily thereafter before rising again for females 60 and over. There is diversity within the region, with the gap favouring the young found especially in Israel, while being reversed in the UAE and Saudi Arabia, both of which have large numbers of foreign-born workers in their lower age groups.
Averaging across more than 40 countries in Sub-Saharan Africa, life evaluations are highest for the young, fairly similar in the two middle age groups, and then higher for males and lower for females in the 60+ age group.
What about global differences within age groups? Within the group of those under the age of 30, average life evaluations drop significantly with age,[37] a finding that has echoes in Chapter 3 dealing with a broader range of evidence on adolescent and youth well-being. Within the global sample of those over 60, we find life evaluations rising with age, as is also found in the Indian evidence in Chapter 5.[38] For a global sample including both of the middle age groups, there is a negative influence from age and a positive one from age-squared, with an implied low point slightly below age 50.[39] Within the 30 to 44 age group, the age effect is generally down, with no sign of a low point within that age range. Within the 45 to 59 group, there is an implied U-shape in age, with an estimated low point just over 50 years of age. More on this later in the chapter.

Is life getting better or worse, and for which age groups?
The most fine-grained national-level indication of how the quality of life has been changing in each country is provided in Figures 7 through 34 in the Statistical Appendix. Figures 7-20 plot for each country the year-by-year trajectories for life evaluations in each of the four age groups, and Figures 21-34 repeat the analysis with the population divided into three birth cohorts: those born before 1964, between 1965 and 1980, and after 1980.
For the population as a whole, Figure 2.5 below shows for each country the change in happiness from 2006-2010 to 2021-2023. Seventeen countries have increases in average life evaluations of a full point or more, compared to seven countries with reductions of a point or more on the 0 to 10 scale. Among the larger gainers, there are several countries in Eastern Europe where the increases were more than one-third of their average happiness scores in 2006-2010. Some of the worst faring countries, especially Lebanon and Afghanistan saw their life evaluations halved from their base values.
Figure 2.5: Changes in Happiness: from 2006-2010 to 2021-2023
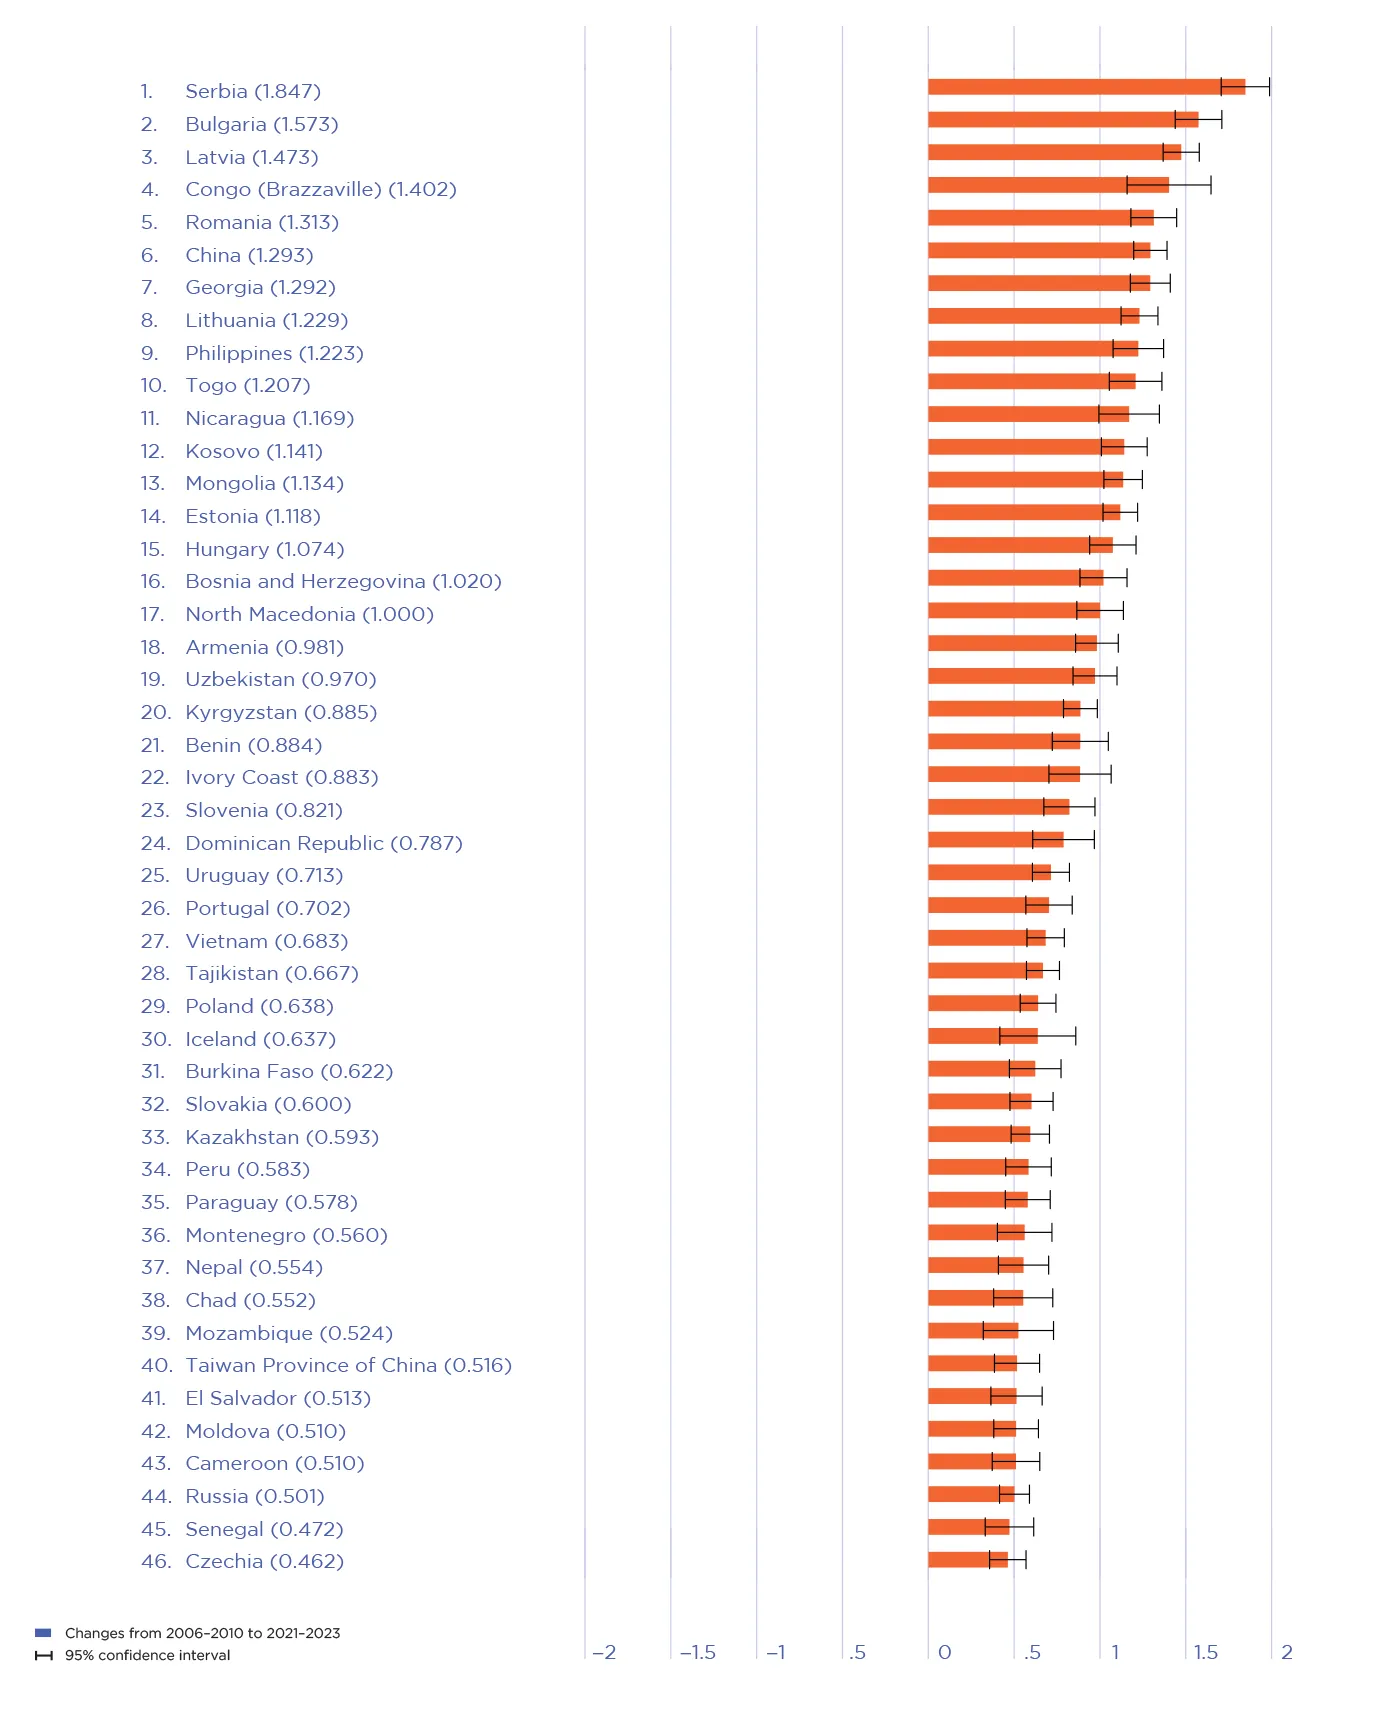
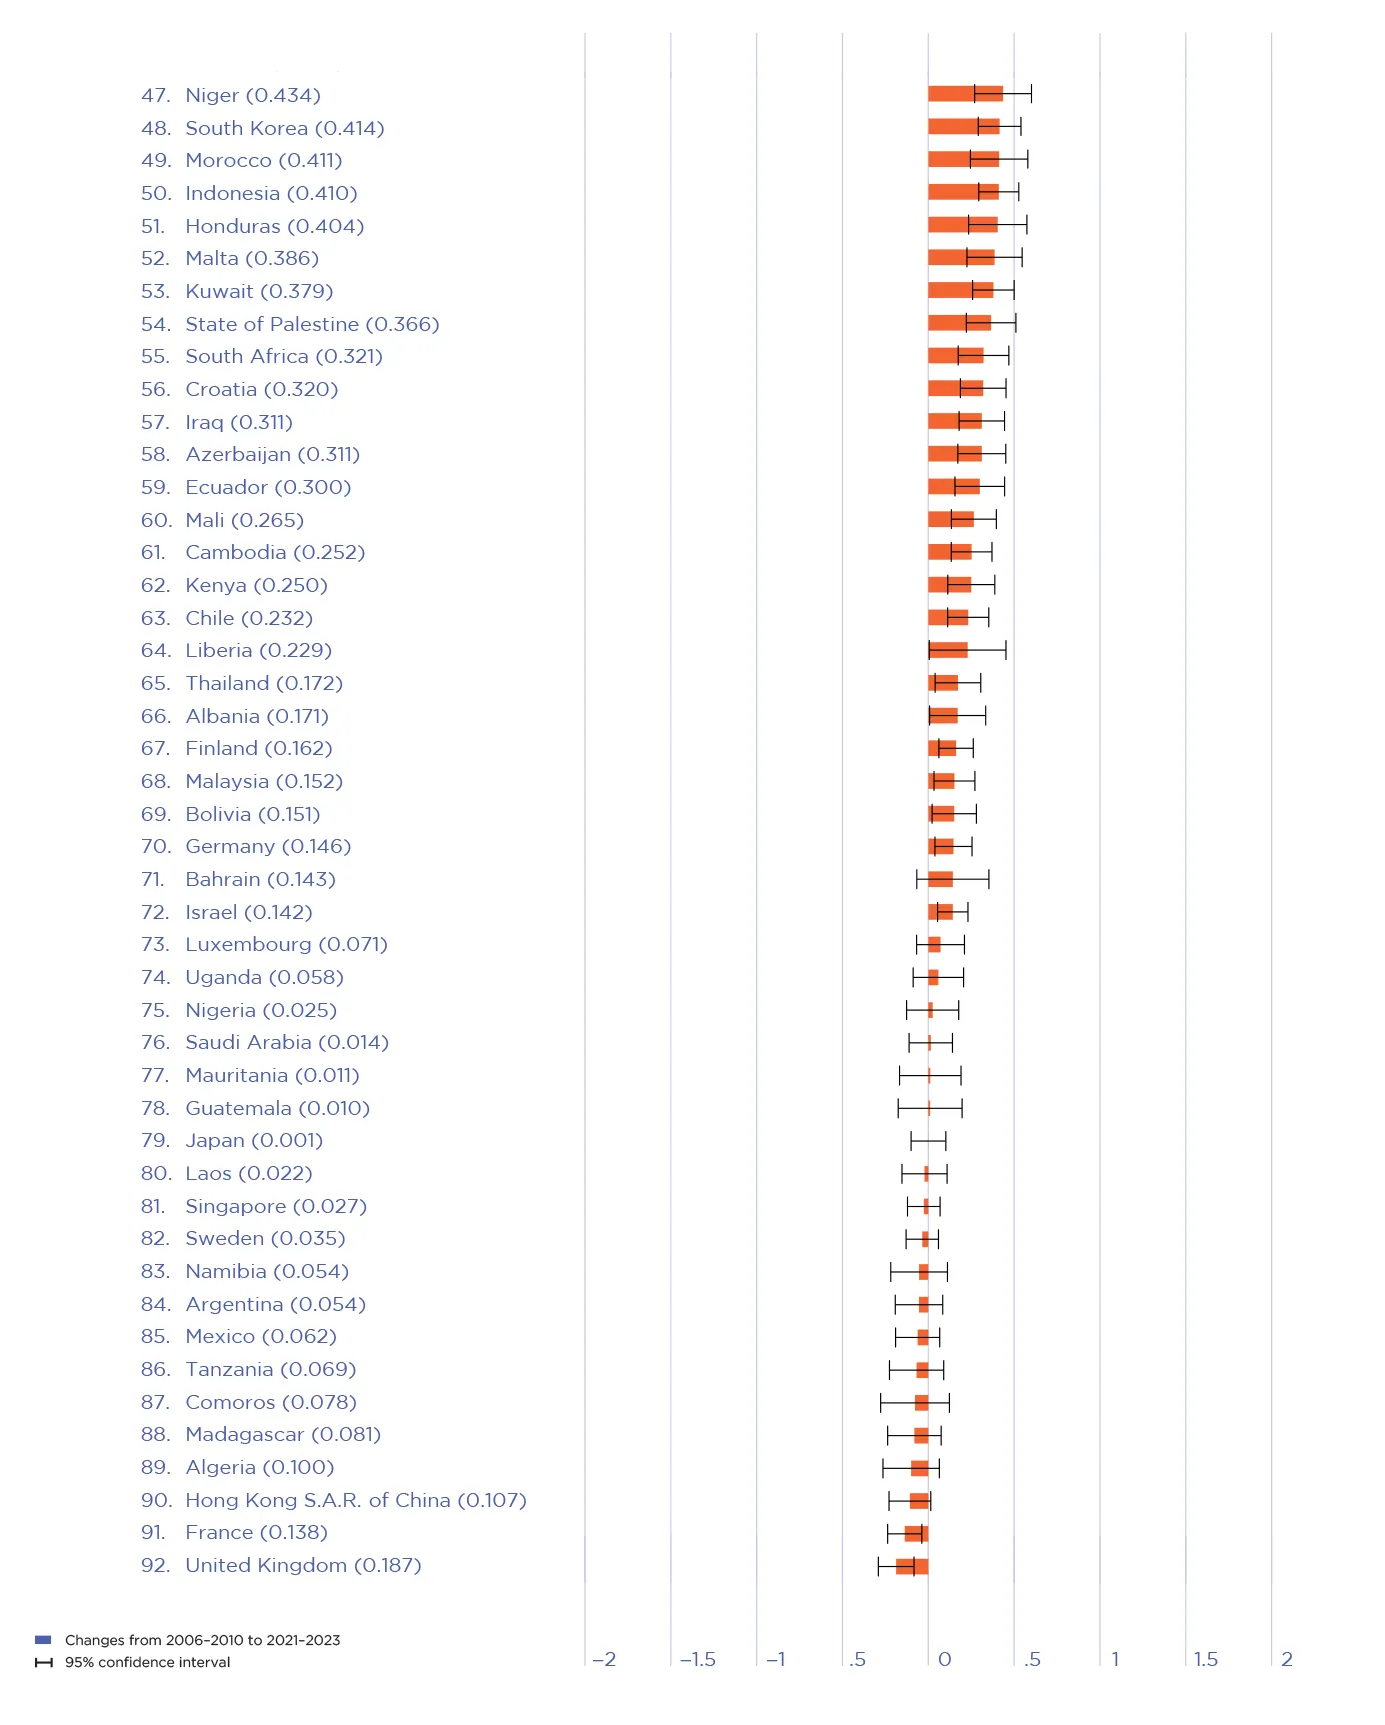
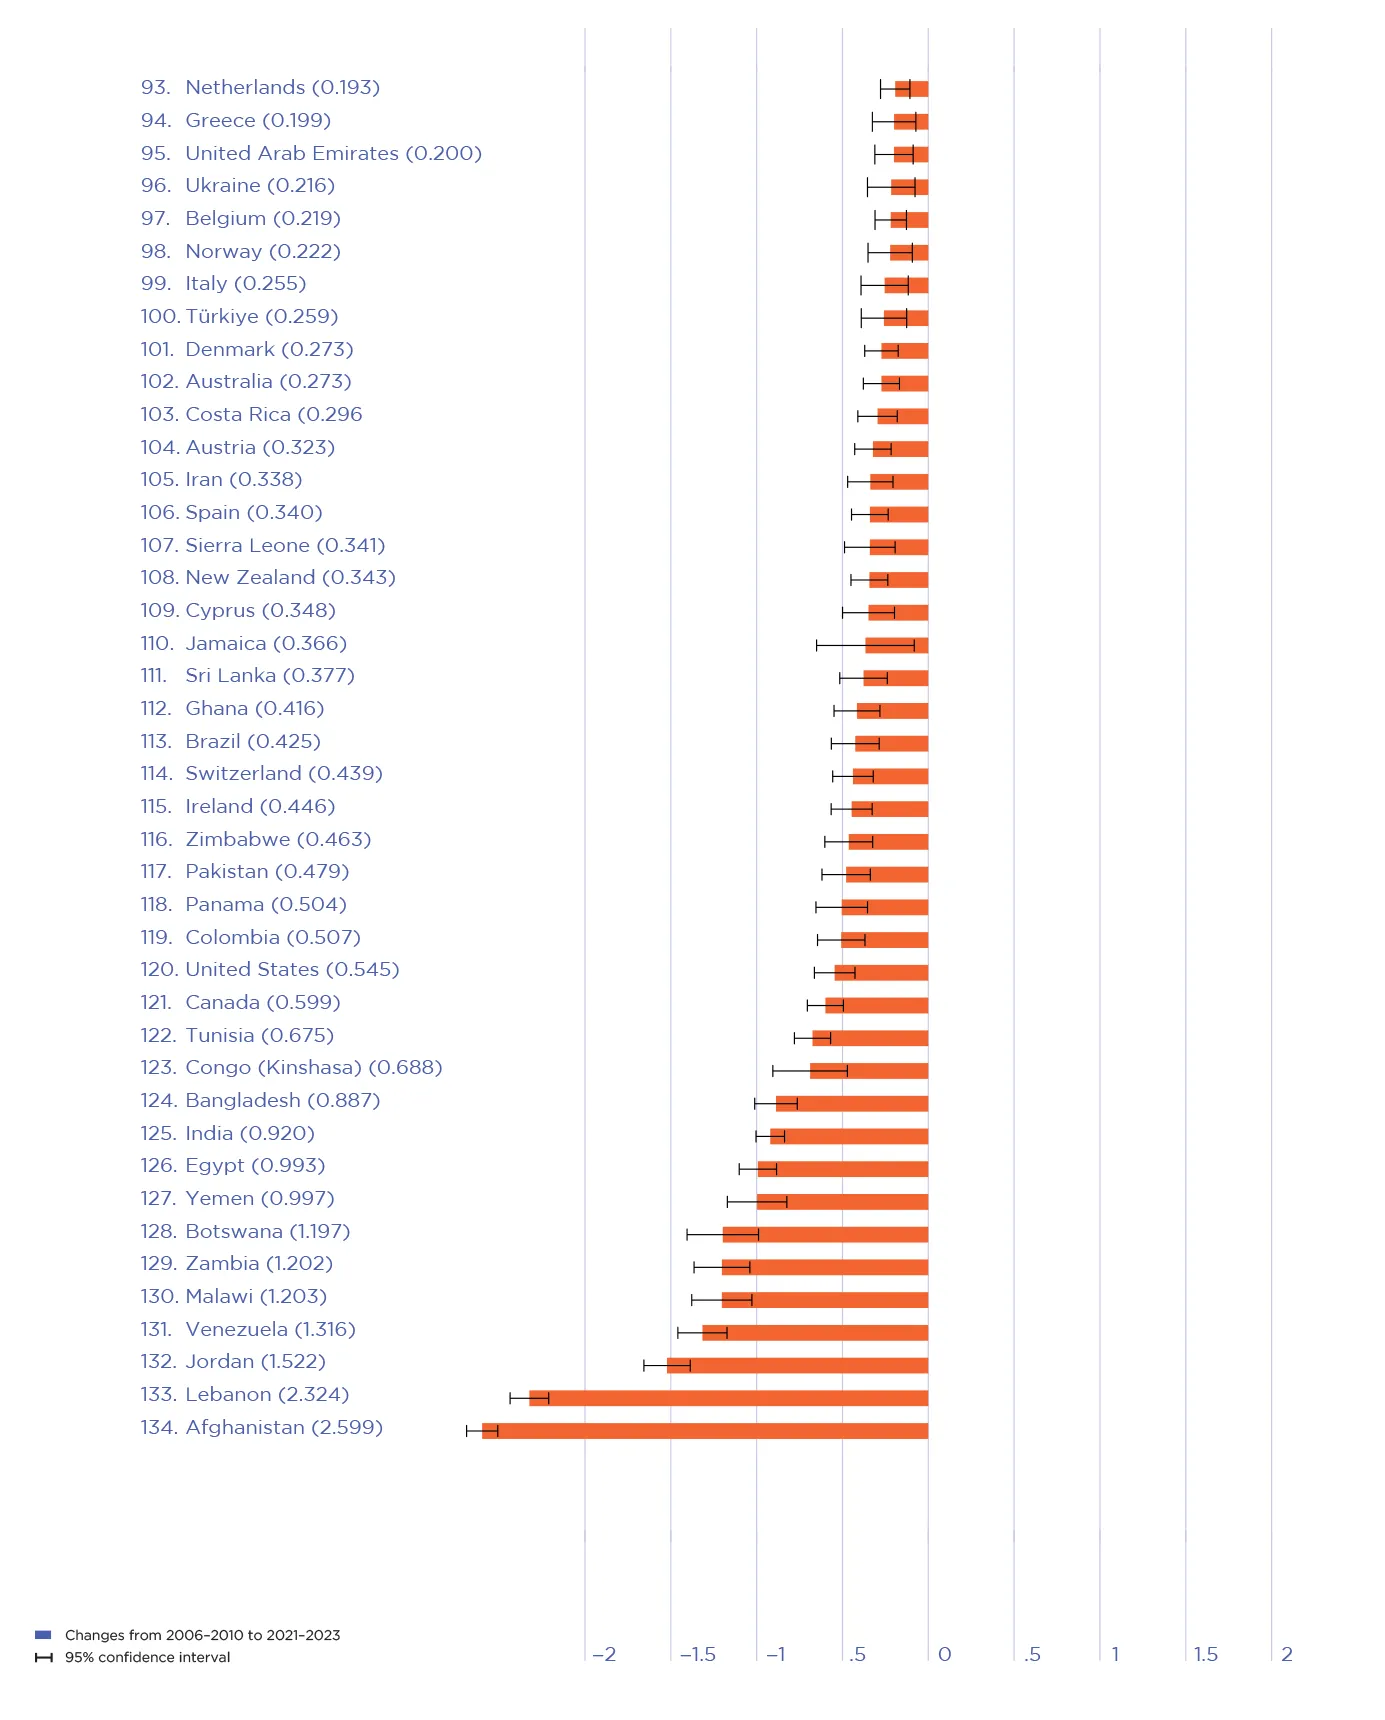
Figure 2.6 returns to a regional focus to show how average life evaluations have changed between 2006-2010 and 2021-2023 for each of the ten regions, as well as for the average of all countries, for each of four age groups.
Figure 2.6 Happiness changes from 2006-2010 to 2021-2023
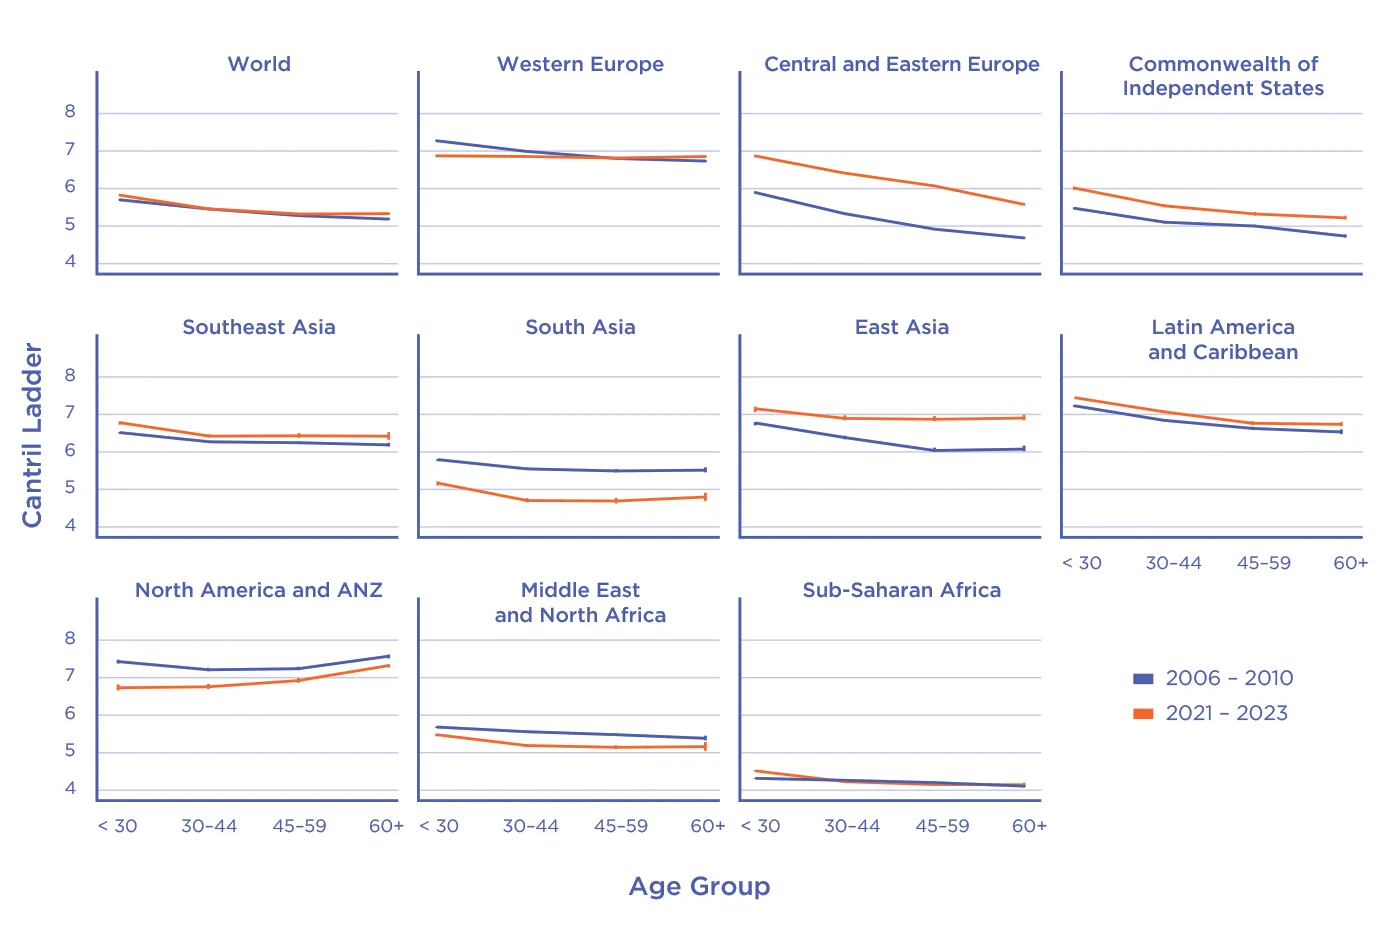
Looking first at the global average across countries, life evaluations have improved very slightly in all age groups. Once again, this global average masks some very different regional trajectories. Happiness has generally increased for all age groups in East Asia, Central and Eastern Europe, and the CIS, and fallen in South Asia, the NANZ group and the Middle East and North Africa. There are interesting age group differences within this general pattern.
In Western Europe, life evaluations among the young are significantly lower in 2021-2023 than they were in 2006-2010, with a lesser drop in lower middle age and a small increase for those over 60.
In Central and Eastern Europe, life has improved by a full point or more at all ages, especially in the middle age groups. Happiness continues to be much higher in the younger age groups, although by less now than in 2006-2010. The convergence of happiness levels in Central and Eastern Europe toward those in Western Europe has continued. For those under 30, this convergence is complete, as happiness levels for them are essentially equal in both halves of Europe. For those over 60, the gap between the two halves of Europe is about half of what it was in 2006-2010, while still being more than a full point in 2021-2023.
Life evaluations have also risen for all age groups in the CIS countries, by on average half as much as in Central and Eastern Europe, even though starting a half-point lower in 2006-2020. Hence the increased gap between these two regional groups, especially so for the young and lower-middle age groups.
For the United States, Canada, Australia and New Zealand, happiness has decreased in all age groups, but especially for the young, so much so that the young are now, in 2021-2023, the least happy age group. This is a big change from 2006-2010, when the young were happier than those in the midlife groups, and about as happy as those aged 60 and over. For the young, the happiness drop was about three-quarters of a point, and greater for females than males.
In the Middle East and North Africa, average life evaluations fell in all groups between 2006-2010 and 2021-2023, by almost twice as much for those over 60 and for those under 30. Thus there has been in the past dozen years a steepening of the age gradient favouring the young over the old.
Finally, average life evaluations in Sub-Saharan Africa have not changed for those in the middle age groups, while rising slightly for both the young and the old.
Emotions at different ages
How do emotions differ by age? We shall first consider negative emotions and then positive ones, following the definitions in Technical Box 2.
Females have more frequent negative emotions at all ages
Figure 2.7 shows negative emotions in the years 2021-2023 by age, separately for females and males. For the world as a whole, the average frequency of the selected negative emotions is higher for females than males, with the gender gap growing slightly from the young to the old.
Figure 2.7 Negative emotions by gender and age, 2021-2023
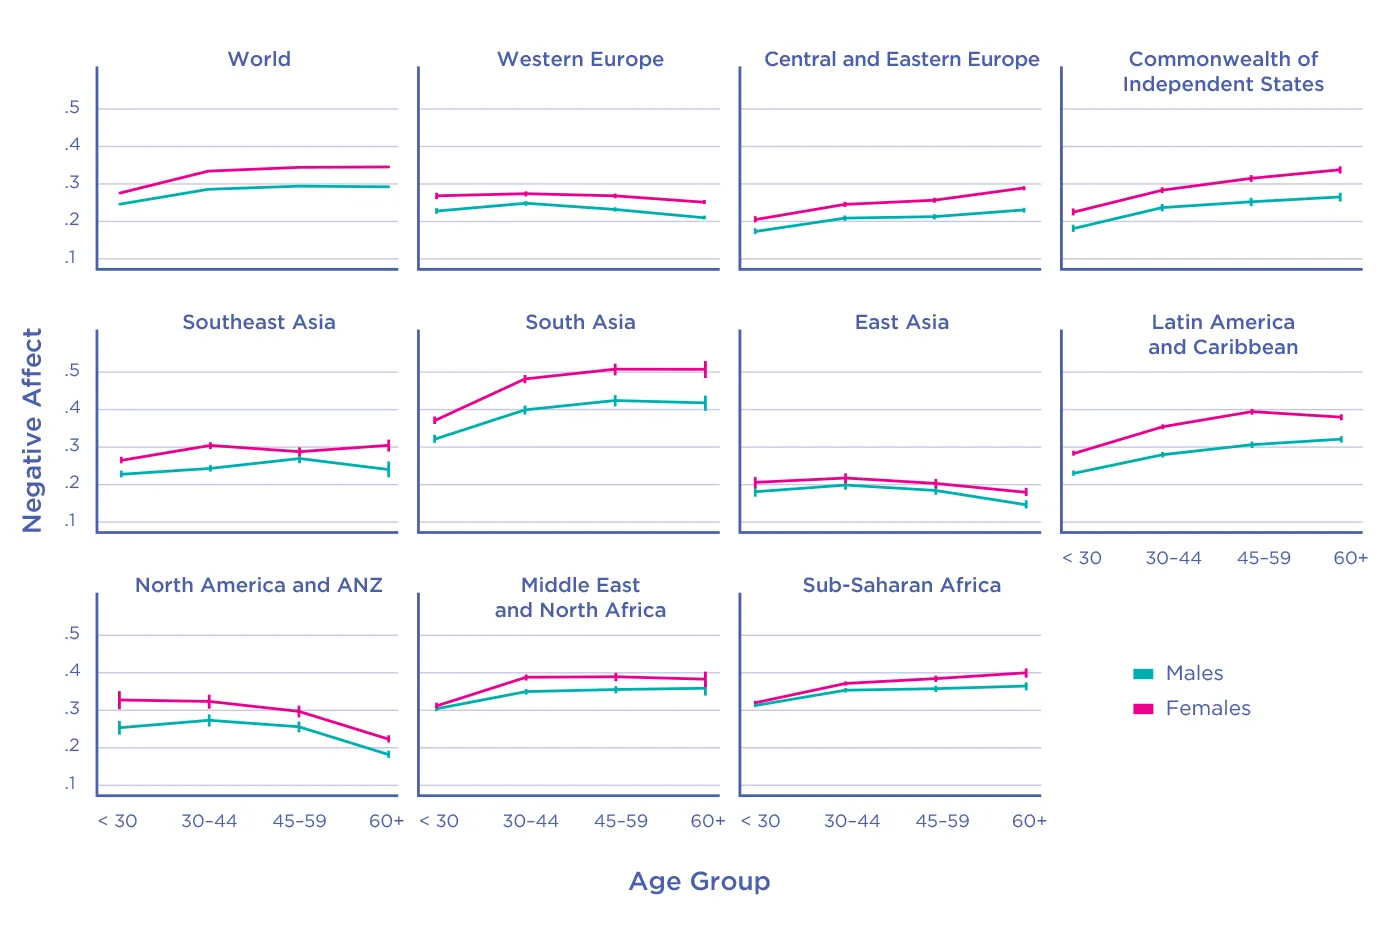
Looking across the regions, there is a mixed pattern. In Western Europe, negative emotions are relatively less frequent for males than females at all ages, and decline slightly with age for both males and females. Negative emotions in 2021-2023 were generally more frequent in Central and Eastern Europe than in Western Europe, have a slightly larger gender gap, and rise with age for both females and males, but by more for females than males. The same pattern repeats when moving to the CIS countries, with negative emotions more frequent at higher ages, and more for females than males.
The three parts of Asia show quite different patterns. In Southeast Asia, negative emotions yesterday are more frequent for females than males for the two younger age groups, and less frequent for those over 60. In South Asia, negative emotions are more frequent than elsewhere in the world, especially at higher ages and for females. In East Asia, negative emotions are globally low, and show little difference by age and gender.
In Latin America and the Caribbean, negative emotions are more frequent for females than males, especially in the middle age groups, and generally rise with age.
The group including the United States, Canada, Australia and New Zealand shows a quite different pattern than elsewhere. Negative emotions are at all ages more frequent for females than males, especially for those under 30. In this region, unlike anywhere else except Western Europe, negative emotions are more frequent among the young and least frequent for the old.
Negative emotions in SubSaharan Africa are equally frequent for males and females under the age of 30, and rise with age for both genders thereafter, by more for females than males. In the Middle East and North Africa, the biggest gender gap is in the middle age groups, flanked by rough gender equality for the young and old.

Negative emotions have gone up in some regions, and down in others
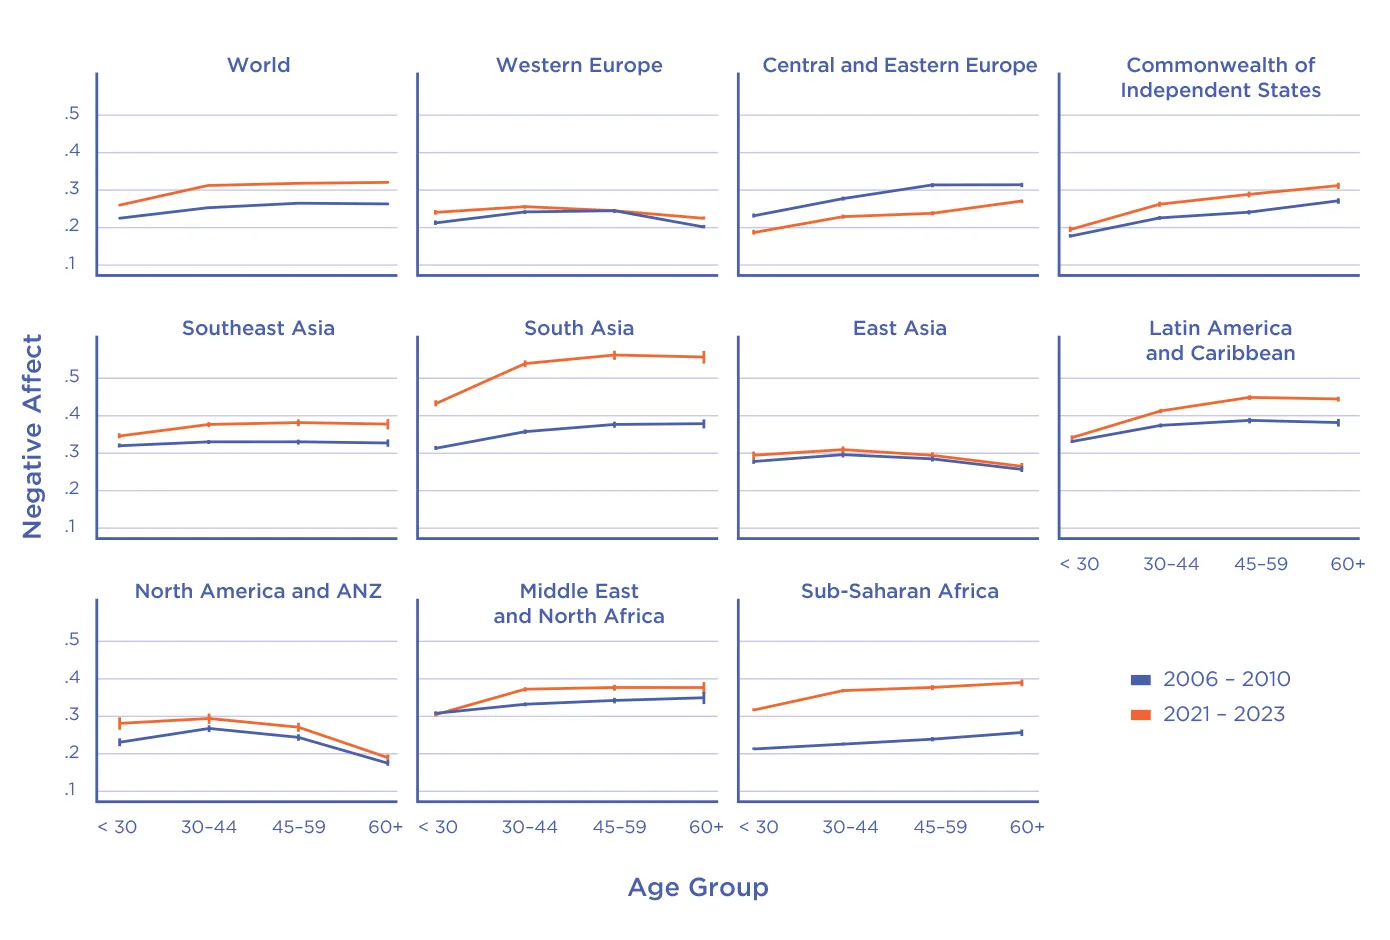
We now consider changes in emotions between 2006-2010 and 2021-2023. As shown in Figure 2.8, negative emotions are more frequent now than in 2006-2010 everywhere, only slightly so in East Asia and both parts of Western Europe. The big exception is in Central and Eastern Europe, where there has been a drop in the frequency of negative emotions in all age groups, in contrast to the rest of the world, but consistent with the happiness convergence taking place within Europe.
Increases in negative emotions have been most frequent in South Asia and Sub-Saharan Africa, especially at higher ages. In Latin America there has been no increased frequency of negative emotions among those under 30, but a substantial increase in the older age groups. The CIS countries show a similar but somewhat muted pattern. There is the reverse pattern in the NANZ countries where negative emotions have increased more for the young than for the old. No other region shows negative emotions increasing more for the young than for the old.
Figure 2.8 Negative affect levels by age 2006-2010 vs 2021-2023
Positive emotions are more frequent at lower ages, and have changed less
As shown in Figure 2.9, positive emotions, which include laughter, enjoyment, and doing interesting things,[40] are based on experience the previous day, are almost everywhere more frequent in the youngest age groups, and are gradually less frequent at higher ages. The only exception is in the NANZ group of countries, which show a U-shape in age, with those 60+ having about the same frequency of positive emotions as those under 30. Age-related decreases in the frequency of positive emotions, coupled with increases in the prevalence of physical pain, encourage a deeper look at why life evaluations as a whole so frequently rise after a mid-life low. We do this in later sections.
Figure 2.9 positive affect levels by age 2006-2010 vs 2021-2023
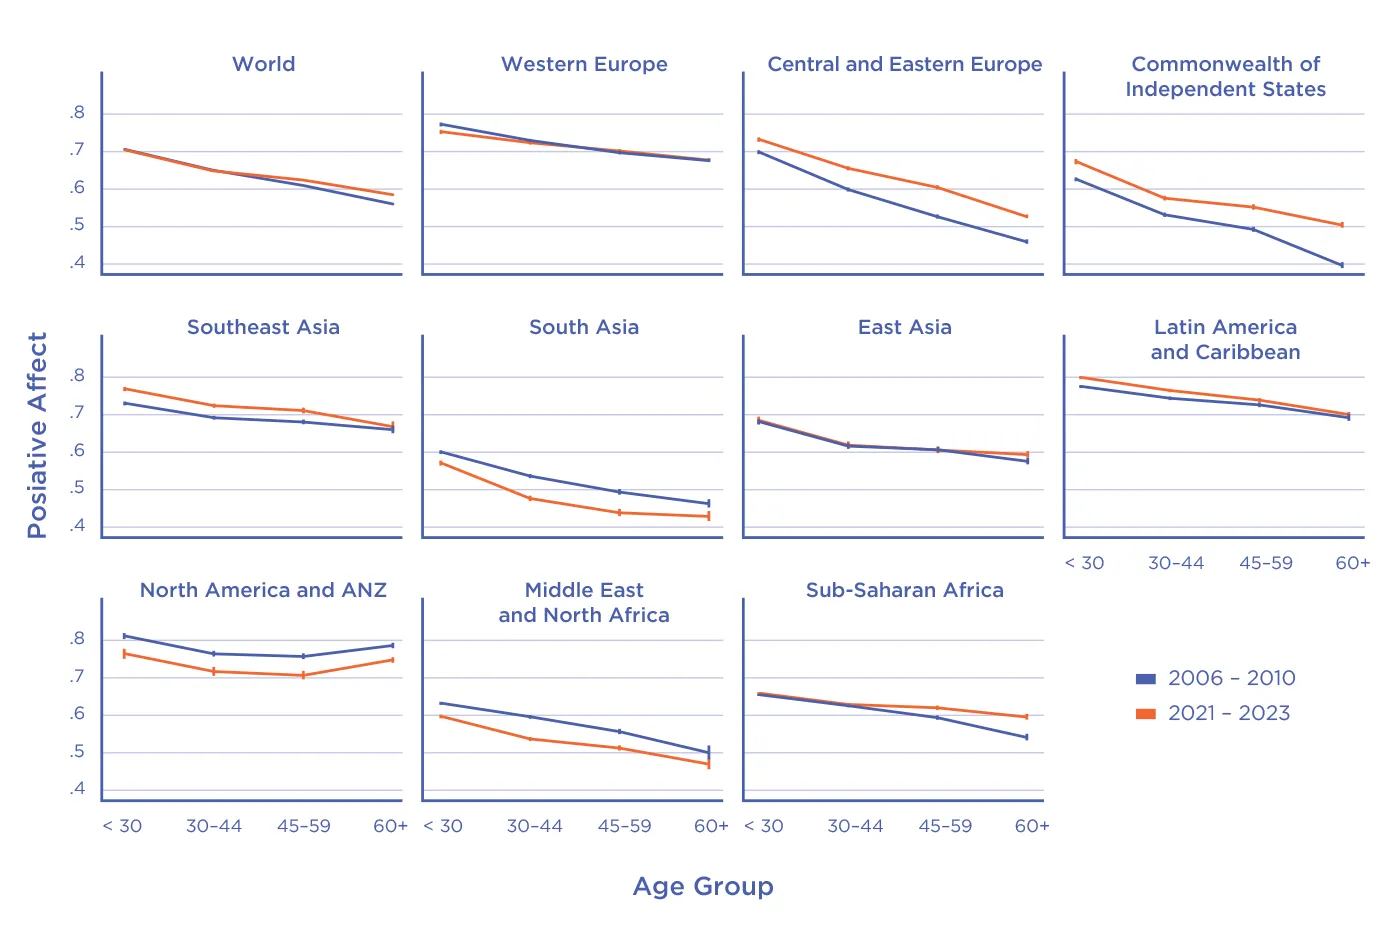
What about changes from 2006-2010 to 2021-2023? Figure 2.9 shows no change at the global level, except for those over 60 where positive emotions are now more frequent than before. The unchanged global average shows the net effects of differing regional patterns. The increased global frequency of positive emotions among those over 60 is driven by the countries of Sub-Saharan Africa, Central and Eastern Europe, and the CIS. In all other regions, positive emotions at all ages are either unchanged or lower in 2021-2013 than they were in 2006-2010.
How unequal is happiness at different ages?
From the outset of our WHR research, we have emphasised the importance of the distribution of happiness. Research has shown that inequality of well-being has a bigger effect on overall happiness than does inequality of income.[41] This is, we think, because it is a broader and more encompassing measure. Inequality in the distribution of happiness reflects inequalities of access to any of the direct and indirect supports for well-being, including income, education, health care, social acceptance, trust, and the presence of supportive social environments at the family, community and national levels. People are happier living in countries where the equality of happiness is greater. The use of a 0 to 10 scale for life evaluations permits us to measure inequality as the standard deviation of each country’s distribution - the bigger the average gap between the happier and less happy people, the higher will be our inequality measure.[42]
This is the first report to consider equality of happiness by age group, set in a global environment of increasing inequality. At the global level, averaged across all ages and regions, inequality of happiness has increased by more than 20% over the past dozen years. This is shown in the world panel of Figure 2.10.
Figure 2.10 Inequality of Happiness by age group, time and region
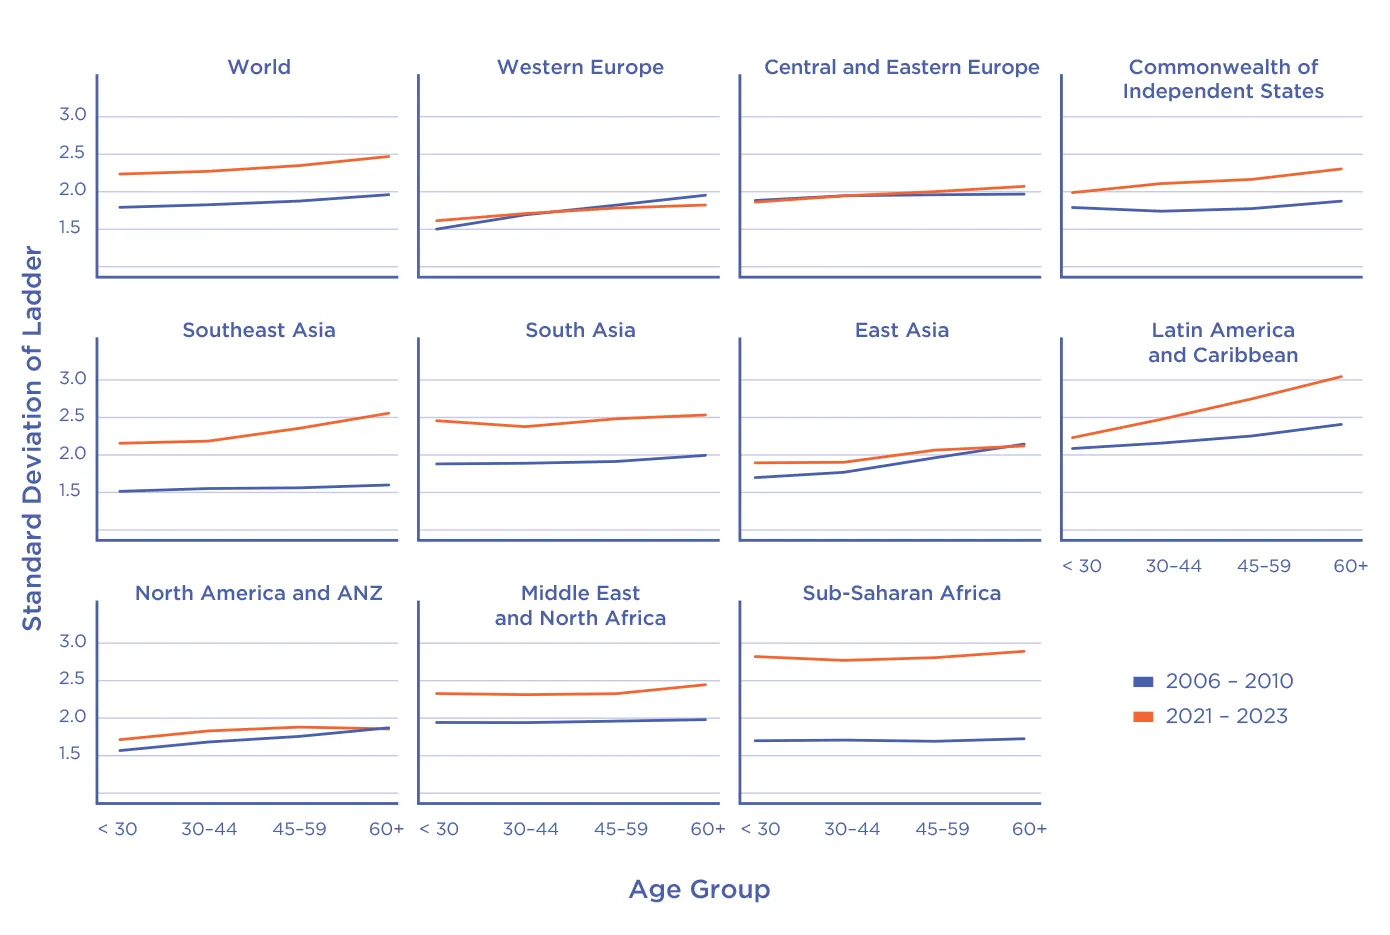
The red line in each panel of Figure 2.10 shows the most recent values for happiness inequality in each group, with the grey line showing inequality by age group in 2006-2010. Inequality of happiness, as measured by the standard deviation of life evaluations within an age group, has increased in every region, except in Western Europe, where it has on average remained constant, with an increase in inequality among the old being offset by a drop for the young. In the North America plus ANZ group, inequality has increased for the young but not for the old. Every other region has seen inequality increases for the old that have been greater than those for the young, sometimes by very large amounts, as in Latin America, Southeast Asia, and the Commonwealth of Independent States. Happiness inequality in Sub-Saharan Africa has increased by more than 50% for all age groups, and only slightly less so for those of middle age than for the old and the young.
In light of the diverse regional trends for inequality at different ages, the overall inequality rankings by age are not the same as they were a dozen years ago. Inequality among those over 60 is now greatest in Latin America, followed closely by Sub-Saharan Africa, then, significantly lower, by Southeast and South Asia, followed then by the Middle East and North Africa, the CIS countries, and East Asia. Both halves of Europe, and the United States, Canada, Australia, and New Zealand group currently have the lowest levels of inequality, without significant age-group differences.
For those under 30, inequality of happiness is by far the greatest in Sub-Saharan Africa, followed by South Asia, MENA, Latin America and the Caribbean, Southeast Asia, South Asia, and MENA. Although happiness inequality among the young has grown, it is still lowest in Western Europe, as it was in our base period of 2006-2010.
Are there generational differences in benevolence?
We updated last year the startling finding in World Happiness Report 2022 that all three benevolent actions surveyed in the Gallup World Poll - donations, volunteering and especially the helping of strangers - showed remarkably large increases over their pre-pandemic values. Now we can expand on those results in two important ways, first by adding a fourth year of COVID experience and second by seeing the extent to which benevolence levels and post-COVID frequencies differ by generation.
There has been much discussion about possible shifts of values, including benevolence, from one generation to the next since the middle of the last century. In particular, in the US context the millennials have been alternatively called the ‘me generation’, the ‘we generation’ or just another generation.[43] With almost twenty years of data from the Gallup World Poll, it is becoming feasible to decouple the age of respondents from their year of birth, with the latter defining which generation they represent. These data permit us to make a more global assessment of generational shifts in benevolent actions. In addition, the COVID pandemic provided a natural experiment to capture generational differences in benevolence. It has been argued that greater levels of social trust among older than among younger Americans was likely to represent mainly a generational effect rather than a consequence of the ageing process.[44] There have also been studies, based on smaller samples of data, of whether benevolent values have shifted from one generation to the next, and whether they have changed over time within a given cohort.[45] All three of our benevolence measures can be interpreted as proxy measures of the quality of community-level social capital. How these behaviours were altered by COVID for people in different generations provides a nice test of generational differences. If there has been a generational shift, with those born more recently being less inclined towards benevolent acts, then we would expect to find that the surge in benevolence we have found would be larger among those in earlier generations. If the increases in benevolence have been equally or more present in recent generations, then that is an encouraging finding. Either there has not been a significant generational shift towards less societal connection, or possibly it has been offset by more recent positive generational shifts or masked by the inability of sheltered-in-place older adults to perform the benevolent acts they would otherwise have liked to do.
To sort out these possibilities, it is useful to compare the pre-pandemic and COVID-era frequencies of benevolent acts by birth cohort. To do this, we divide respondents into three cohorts: those born before 1965 (Boomers and their predecessors), those born between 1965 and 1980 inclusive (Gen X), and those born after 1980 (Millennials and Gen Z).
Figure 2.11 shows the percentage of the population performing the three benevolent acts by each of these birth-year cohorts, with grey bars showing the 2017-2019 values and the red bars the frequencies in and after 2020.[46]
Figure 2.11 Frequency of benevolent acts by generation, before and since COVID
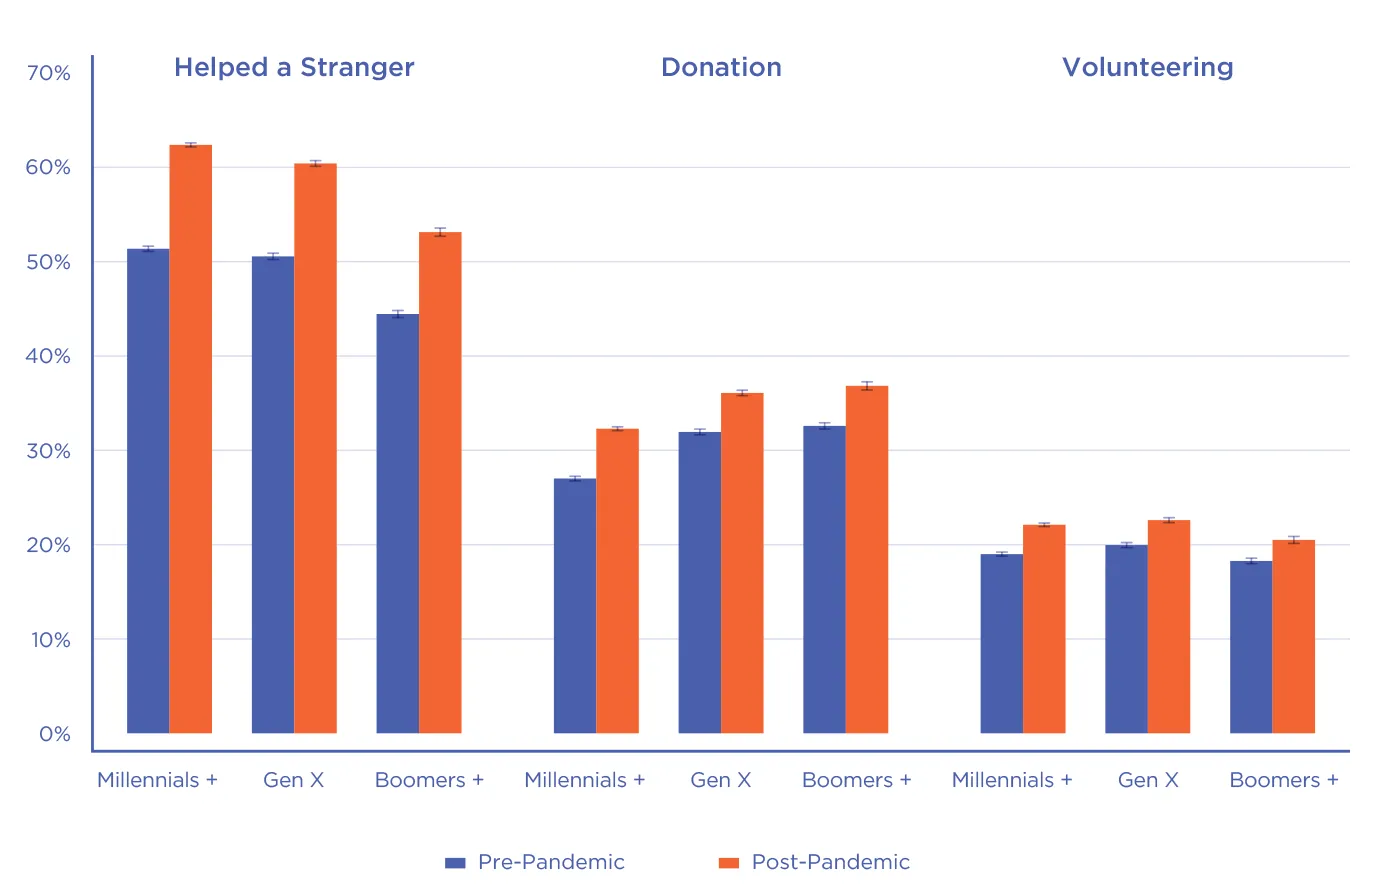
For all cohorts, both before COVID and now, the helping of strangers is most frequent, followed by donations and then volunteering. The pre-COVID generational patterns differ for the three acts. The helping of strangers was most common among the younger cohorts, and lowest for those born before 1965, perhaps reflecting in part their lesser ability to be out and about. Charitable donations were less frequent in the younger generations than for the other age groups, perhaps reflecting their lower disposable incomes. Volunteering was fairly equal in the three generations. These data do not show levels that would suggest a generational shift to less social engagement, although there remains the problem of separating age and cohort effects. For that purpose, the COVID experience provides a very useful natural experiment.
The post-COVID increases are large in both size and statistical significance for all three birth cohorts and all three benevolent acts. For all three acts, the increases in benevolence, whether measured as shares of the population, or percentage increases from pre-pandemic levels, are greatest for millennials and Gen Z, suggesting that millennials are even more likely than their predecessors[47] to increase their benevolent acts when a new need like COVID arises. In any event, the difference between generations in their responses is dwarfed by the general size of the increases in all generations. These benevolence results, if we compare 2017-2019 to 2020-2023, apply in every global region.[48] This increased benevolence provides an important part of our explanation for the relative stability of life evaluations during COVID. The chance to help those in need, and to see others doing the same, serves to give purpose and increase trust in the benevolence of others, all of which is associated with higher ratings of life as a whole.[49]
Social support, loneliness and social interactions by generation
There is widespread concern, especially in the United States, about an emerging epidemic of loneliness, and about the consequences of loneliness for mental and physical health.[50] In World Happiness Report 2023 we showcased the Gallup/Meta social connections and loneliness data from seven large countries[51] representing six global regions. We found that in all of the seven countries, feelings of social support were generally twice or more prevalent than feelings of loneliness. In subsequent use of the seven-country data, we have found that what respondents thought about the trustworthiness and kindness of others were very strong supports for overall satisfaction with social relations.[52] This year we are able to provide full global coverage, since some of the social connections variables were included in the 2022 Gallup World Poll, and can be analysed using data for 140 countries.[53] We developed separate measures for each of our three generations, thus bringing the Gallup/Meta data directly to bear on how these important relations vary by generation. Also valuable are data on the reported frequency of six types of social interactions. These permit us to compare the extent of social interaction with reported feelings of loneliness and social support, and see how they are correlated with our key overall life evaluation, the Cantril ladder.
Figure 2.12 shows regional averages of individual responses for each of the three generations. The first column shows how socially supported respondents feel using four response possibilities, with ‘not-at-all’ coded as 0 and ‘very’ as 1.0.[54] The second column reports on feelings of loneliness, using the same scale. Strong social support is generally two times as prevalent as loneliness. The third column turns to the reported average frequency of six types of social interactions, including those with family and friends, at work, school, community groups, neighbours and strangers.
Figure 2.12 Social Support, Loneliness, and Social Interactions by Generation
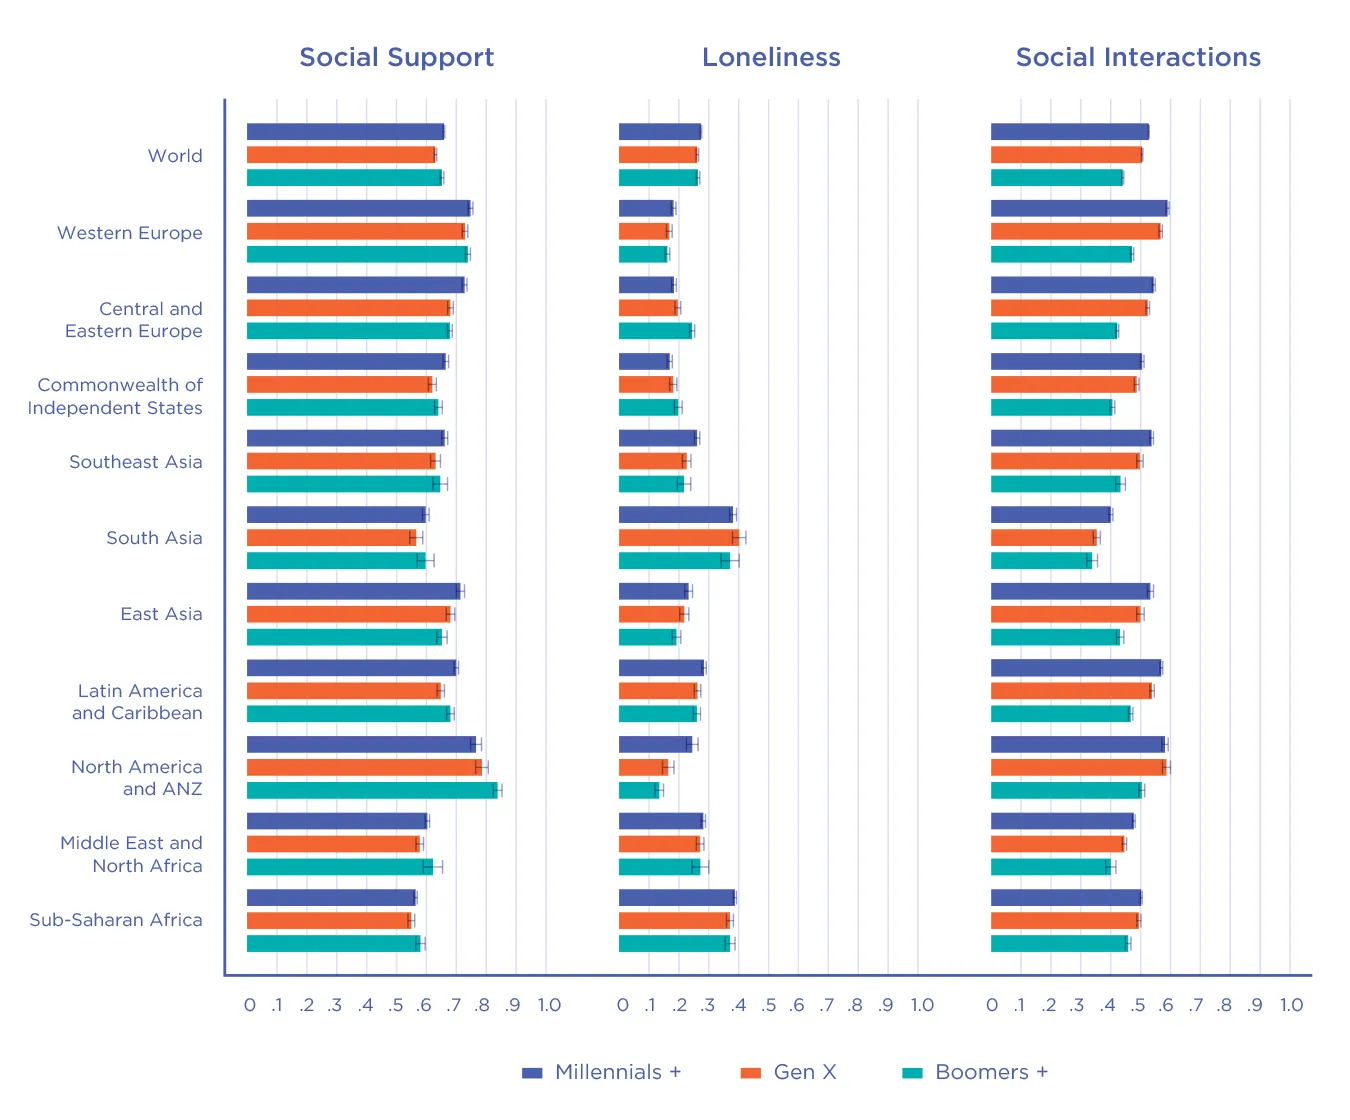
Globally, perceived social support is highest in East Asia, Western Europe and the NANZ countries, and lowest in South Asia, especially in the intermediate age groups. The age gradient favours the old in Western Europe and the NANZ countries, and the young in Central and Eastern Europe, mirroring what was found earlier for life evaluations.
Loneliness, when measured on the same scale as social support, is in all regions generally half as prevalent as social support. It displays somewhat matching patterns, being low where social support is high, and vice versa. Only in Southeast Asia, Western Europe and the NANZ countries is loneliness significantly higher for the Millennials than for the Boomers, a pattern that is reversed in Central and Eastern Europe.
An earlier study found age to be the most important factor in explaining loneliness differences among survey respondents in the United States.[55] They found a peak in loneliness at age 20, with a steady age-related decline thereafter. This same phenomenon is evident in the Gallup/Meta data for the group of four countries including the United States. Although overall levels of loneliness are not unduly high in global terms,[56] there is a significantly different pattern across the generations. Loneliness is almost twice as high among the Millennials than among those born before 1965.[57] Millennials also feel less socially supported than Boomers in those countries, another place in which these countries look different from the rest of the world. This is despite the fact that actual social connections are much more frequent for Millennials than Boomers, and about as frequent as for Generation X.
Do the high prevalence of loneliness and the lesser feelings of social support help to explain the very large ranking disparities between the old and young for the NANZ countries shown in Figures 2.2 and 2.3, and in Table 2.2? To some extent yes, but they can only be part of the story. If we add the three variables of Figure 2.12 to our preferred[58] individual-level equation, all three variables add very significantly to explaining life evaluations in 2022, the year in which the social connections data were collected. Feelings of social support are the most important, followed by loneliness and social interactions.[59] If those under 30 in the NANZ region had the same feelings of loneliness and social support as those over 60, their average life evaluations would be predicted to be higher by slightly more than one-tenth of a point on the 0 to 10 scale, about one-seventh of the happiness gap between those under 30 and those 60 and older in that region.
Another interesting feature of the Gallup/Meta results, applicable in all global regions, is that the oldest members of the population, those in the boomer and earlier generations, feel more socially supported and less lonely than those in the younger generations despite having less frequent actual interactions with all groups except neighbours. This ability to gain more perceived support with fewer interactions likely helps to explain why life satisfaction so often rises after middle age even as the frequency and seriousness of health problems increases. We turn now to consider these issues in more detail.

What are the happiest and least happy stages of life in different countries?
Our international rankings and trends of life across life stages show big differences. How does our evidence relate to the many studies of the U-shape in life evaluations frequently found in Western Europe and North America? The Gallup World Poll provides the largest set of countries ever available to study the generality of the U-shape in age. As suggested by the name, the U-shape describes a situation where there is a mid-life low in life satisfaction, with most findings placing the low point at about 50 years of age.[60] The first major age-related study with Gallup World Poll data[61] used evidence from 2006-2010. The study found a U-shape in the high-income English speaking countries, accompanied by a flat profile in Africa and life evaluations falling with age in Eastern Europe, the Commonwealth of Independent States (CIS) and Latin America. In this chapter we start with evidence from the same early years of Gallup World Poll data used in the earlier analysis, and then repeat the analysis using the three most recent years, allowing us to see the extent that age patterns for life evaluations have changed in the past fifteen years.
Most studies of life evaluations based on large samples of survey data include both age and age-squared among their variables, with the almost universal finding being a negative coefficient on age and a positive one on age-squared. The relative sizes of these two coefficients can be used to calculate the low point in the estimated relationship, usually found to be about 50 years of age.[62] These age effects are sometimes estimated with other variables in the equation, and sometimes not, with the differences in the estimated age of minimum happiness depending on what other variables are included, but generally found to be similar to those based on the age terms alone. For this chapter, we first look at the effects of age alone, without including other variables, and without forcing any particular functional form for the relationship, echoing what was done in World Happiness Report 2015, where we examined the global distribution of life evaluations and emotions by country, region, age and gender.[63] We then turn later to confirming the generality of this sort of curvature after allowing for our full set of variables linked to life evaluation differences among individuals and among countries. We find as well that significant U-shape patterns persist even after allowing for generational differences.
In this chapter we are first interested in knowing the happiest and least happy age groups in each country. For this purpose it is helpful to have the in-between group split into low-middle (30-44) and high-middle (44-59) groups, because the high-middle group includes the most commonly estimated low points for happiness.[64] We consider a country to exhibit a U-shape in age if average life evaluations in either of the two middle-age groups are below those for both the young and the old. Table 2.3 shows the number of countries in each global region according to which age group was the least happy using data from 2021-2023. Globally the old age group is the least happy in about half of the countries, the young the least happy group in seven countries, with the remaining countries having a mid-life low, most of them in the 45 to 60 age range. So by this definition the U-shape is currently found in almost half of our countries. It is currently evident in more than half the countries of Asia and Africa, and less than half in Europe and Latin America. In Western Europe the unhappiest age groups are diverse: one-third each for those below 30, 60+, and those in between. In all of the countries in Central and Eastern Europe and in two-thirds of the CIS countries those 60 and older are the least happy. In the NANZ group the reverse holds true, with the young and the early middle age groups being the least happy.
| Region | The Young | Lower Middle | Upper Middle | The Old | Total |
|---|---|---|---|---|---|
| Western Europe | 6 | 3 | 4 | 7 | 20 |
| Central and Eastern Europe | 0 | 0 | 0 | 17 | 17 |
| Commonwealth of Independent States | 0 | 2 | 1 | 7 | 10 |
| Southeast Asia | 0 | 4 | 1 | 4 | 9 |
| South Asia | 0 | 1 | 3 | 2 | 6 |
| East Asia | 0 | 4 | 0 | 2 | 6 |
| Latin America and Caribbean | 0 | 0 | 8 | 11 | 19 |
| North America and ANZ | 1 | 3 | 0 | 0 | 4 |
| Middle East and North Africa | 0 | 4 | 6 | 7 | 17 |
| Sub-Saharan Africa | 0 | 9 | 12 | 14 | 35 |
| All | 7 | 30 | 35 | 71 | 143 |
How do these results compare with those revealed by the Gallup World Poll data for 2006-2010, as shown in the Statistical Appendix? There have been remarkable changes over the past dozen years, especially in Africa, where for the continent as a whole the old were the least happy group in 24 of the 34 counties in the 2006-2010 data, compared to just over one-third now. Latin America shows a similar pattern, with unhappy-old countries being much less numerous now than in 2006-2010. There are also fewer unhappy-old countries in Western Europe now than earlier, while in Eastern Europe and the CIS the change has gone in the reverse direction, with more unhappy-old countries now than previously. The overall drop since 2006-2010 in the number of unhappy-old countries has been offset by an increase in the number of unhappy-young countries, and in the 30-44 age group. Thus the U-shape in age is more prevalent now than it was a dozen years ago, when it was present in just a third of the countries. We show below that this change in patterns by age may be linked in part to generational shifts favouring earlier generations over the millennials and their successors.
The most interesting questions for us relate not to whether a U-shape exists but whether and why these patterns differ from one country or time period to another.[65] The life satisfaction evidence is matched by other evidence of a mid-life crisis.[66] Many factors influencing life evaluations differ in prevalence for people at different ages, and may matter more at one stage of life than another. Self-assessed health status provides a striking example. The relevant individual-level Gallup World Poll question asks respondents whether they have health problems,with the possible answers being yes or no. The national level for this variable is thus the share of respondents in that age group who have health problems. This proportion rises strikingly across our three main age groups, trebling from under 15% for those under 30 to more than 45% for those over 60. There is also a difference among the age groups in how much having health problems affects life evaluations. As shown by our individual level global modelling in the Statistical Appendix, the damage to life evaluations from having a health problem rises from 0.3 for those under 30 to about 0.45 for those in the middle age groups, and 0.6 for those 60 and over. Thus not only the prevalence but also the well-being consequences of health problems are greater for those over 60. Putting these two differences together suggests that the impact of health problems on average life evaluations rises from 0.045 for those under 30 to 0.3 for those 60 and over, a sixfold increase.[67]
Given the general downward influence of health problems on the life evaluations of the old, what helps to explain their greater happiness? One reason may simply be a lessening of the often taxing need to balance the competing demands of work and family pressures. This hypothesis is supported by the slightly rising prevalence of freedom to make key life decisions, from 75% of respondents in the middle groups to 80% for those over 60. Such freedom is apparently valued even more highly by the old than by those in middle age, with a combined effect raising life satisfaction for those over 60 by about the same as it is pushed down from middle to old age by the increasing frequency and severity of health problems.
Is there also perhaps something more fundamental in the ageing process that might help to explain the extent to which life evaluations can rise after middle age even if circumstances do not improve? That life evaluations can rise after middle age without any matching improvement in life circumstances is suggested by many studies that find a U-shape in age even when several important life circumstances are taken into account.[68] One possible explanation is provided by experiments showing an age-related increase in the relevance of positive over negative information in both perception and memory.[69] This increase in positivity occurs against a backdrop of a prevailing negative bias in the way people view and react to new information.[70] There is a growing strand of experimental research suggesting that, as people age, they generally attach more importance to remembering the positive aspects of their lives, and less to remembering the negative aspects.[71] This could help to explain why life evaluations rise with age, especially in countries where this transfer of attention is more likely. These are likely to be where a larger fraction of the population has the basic necessities of life, as suggested by evidence that the increase in positivity is greater where there are fewer externally imposed constraints.[72]
Does the age-related increase in trust and positivity, accompanied by possible technological obsolescence, and age-related increases in dementia, mean that online scammers will more successfully target the elderly, and make them the major victims? Early studies of the effects of scamming concentrated on older victims, assuming them to be especially vulnerable.[73] Ten years ago there was a recognized lack of evidence comparing the scamming susceptibility of the young and the old.[74] That research gap is being filled, with results showing that although lesser mental capacities and technological smarts do increase susceptibility to scams, ageing can produce a trust that is greater but also wisely directed,[75] so that the older targets are more likely to be suspicious and less likely to fall for the scam than are the young.[76]
There is also some evidence that changes in life evaluations as people age depend on their social environment. To feel a sense of belonging meets an essential human need.[77] Evidence shows a sense of community belonging to have a larger influence on life satisfaction and to be more prevalent at higher ages,[78] providing yet another explanation for life evaluations that rise at higher ages.
Boomers and earlier generations are happier than Gen Xers, who are in turn happier than their 21st Century successors.
Marriage and the family are important elements of the social context whose importance to happiness may vary by age. For example, it has been found that in some countries that normally exhibit a U-shape the protective effects of marriage and living together are greatest for those in the middle age group, so that the U-shape is flatter, and mid-life relatively happier for the married, a finding we have been able to confirm with our global data.[79]
An age-related positivity effect also helps to explain our finding in previous World Happiness Reports that life evaluations among the old were maintained or even improved despite COVID morbidity and mortality being much higher for that age group.[80]
Although age-related positivity research has mainly focused on positive and negative emotions, it clearly has implications for overall life evaluations, as illustrated by results reported above and elsewhere. As people age, the prevailing negativity bias of younger ages is on average across the world increasingly offset as age leads people to focus more on positive news and memories, to accumulate enriching life experiences,[81] to think better of others, and to rate their lives more highly.
We can now exploit the growing number of years of Gallup World Poll data to attempt to separate the effects of age from those of being in a particular generation. For example, the changes in age patterns that we have found when comparing 2006-2010 with 2021-2023 may reflect generational shifts as well as age. To assess those possibilities, we have used our individual-level data to estimate happiness equations (as shown in Table 12 in the Statistical Appendix) showing a U-shape in age appearing in concert with generational shifts in average happiness, with the Boomers and earlier generations being happier than Gen Xers, who are in turn happier than Millennials and their 21st century successors.[82] These differences vary by region, of course, while across the globe the Millennials as a group, after taking into account their other life circumstances, have life evaluations that are about one-quarter of a point lower than the Boomers, with Gen X in between, but closer to the Millennials.[83] The U-shape in age continues to operate, both between and within generations. Within the boomer group, life evaluations rise with each extra year of age, while falling by a bigger annual amount for the Millennials.[84]
Summary
Overall ranking of happiness
The biggest change this year is within the top 20. There are two new entrants, Costa Rica and Kuwait at 12 and 13. Coupled with the continuing convergence between the two halves of Europe, with Czechia, Lithuania and Slovenia at positions 18, 19 and 21, have contributed to the fall of the United States and Germany from 15 and 16 last year to 23 and 24 this year.
The top 10 have remained fairly stable, with Finland still in first position, although now followed more closely by Denmark. All of the top 10 countries, except for Australia and the Netherlands, have populations less than 15 million, while in the top twenty, only Canada and the United Kingdom have populations over 30 million.
Rankings by age group
Rankings differ a lot for the young and the old. In some cases these favour the old, as in the United States and Canada, where the rankings for those aged 60 and older are 50 or more places higher than for those under 30. In other cases, especially in Central and Eastern Europe, the reverse is true, with many rankings being more than 40 places higher for the young than for the old.
Changes in happiness overall and by age group
From 2006-2010 to 2021-2023 changes in overall happiness varied greatly from country to country, ranging from increases as large as 1.8 points (Serbia) to decreases as large as 2.6 points (Afghanistan).
Central and Eastern Europe had the largest increases, of the same size for all age groups. Gains were half as large in the CIS countries. East Asia also had large increases, especially for the older population. By contrast, life evaluations fell in South Asia in all age groups, especially in the middle age groups.
Happiness also fell significantly in the NANZ group, by twice as much for the young as for the old. There were also significant declines in the Middle East and North Africa, with larger declines for those in the middle age groups than for the old and the young.
The convergence of happiness levels in Central and Eastern Europe toward those in Western Europe has continued. For those under 30, this convergence is essentially complete, as their happiness levels are now equal in both halves of Europe. For those ever 60, the gap between the two halves of Europe is about half of what it was in 2006-2010. But it is still very large, more than a full point in 2021-2023.
Emotions at different ages
In 2021-2023 negative emotions were in every region more prevalent for females than males, with almost everywhere the gender gap being larger at higher ages. The exception to this global pattern is provided by the small group of countries that includes the United States, Canada, Australia and New Zealand, where females under 30 have one-third more negative emotions than males, a gap that is smaller at higher ages. There is no corresponding gap in life evaluations, as the gender gap is small at all ages, and tends to favour females.
Negative emotions are more frequent now than in 2006-2010 everywhere except East Asia and both parts of Europe. In Central and Eastern Europe, in contrast to the rest of the world, but consistently with the happiness convergence taking place within Europe, negative emotions are now less frequent in all age groups than they were in 2006-2010.
Positive emotions have not changed much, while still remaining more frequent for the young than for older age groups.
Inequality by age
Global happiness inequality has increased by more than 20% over the past dozen years, in all regions and age groups, to an extent that differs a lot by age and by region. It has increased most for the old in Latin America, Southeast Asia and the CIS, and at all ages in SubSaharan Africa, South Asia, and the Middle East and North Africa.
Benevolence by generation
The COVID crisis provided a natural experiment to compare the benevolence of different generations. The Post-COVID increases in benevolence, whether measured as shares of the population, or percentage increases from pre-pandemic levels, are large for all generations, but especially so for the Millennials and Generation Z, who are even more likely than their predecessors to help others in need.
Social support, loneliness and social interactions by generation
In almost every global region, as confirmed by the new Gallup/Meta global social connections data, comparably measured feelings of social support are more than twice as prevalent as loneliness. Both social support and loneliness affect happiness, with social support usually having the larger effect. Social interactions add to happiness, with their effects flowing through increases in social support and reductions in loneliness.
The U-shape in age
The U-shape in age, with a mid-life low, is widespread, accompanied by a generational effect favouring earlier generations. Among those born before 1965, life evaluations rise with age, as also shown in Chapter 5. Among those born after 1980, happiness falls with each year of age, as also shown in Chapter 3.
As between generations, after taking into account age and life circumstances, those born before 1965 (Boomers and their predecessors) have life evaluations about one-quarter of a point higher than those born after 1980 (millennials and gen Z).[85]
References
Aknin, L. B., Dunn, E. W., & Norton, M. I. (2011). Happiness runs in a circular motion: Evidence for a positive feedback loop between prosocial spending and happiness. Journal of Happiness Studies, 13(2), 347–355.
Aknin, L. B., Andretti, B., Goldszmidt, R., Helliwell, J. F., Petherick, A., De Neve, J. E., .… & Zaki, J. (2022). Policy stringency and mental health during the COVID-19 pandemic: a longitudinal analysis of data from 15 countries. The Lancet Public Health, 7(5), e417–e426.
Aldrich, D. P. (2011). The externalities of strong social capital: Post-tsunami recovery in Southeast India. Journal of Civil Society, 7(1), 81–99.
Anusic, I., Yap, S. C., & Lucas, R. E. (2014). Testing set-point theory in a Swiss national sample: Reaction and adaptation to major life events. Social indicators research, 119, 1265-1288.
Bartscher, A. K., Seitz, S., Siegloch, S., Slotwinski, M., & Wehrhöfer, N. (2021). Social capital and the spread of Covid-19: Insights from European countries. Journal of Health Economics, 80, 102531.
Barrington-Leigh, C. P. (2024). The econometrics of happiness: Are we underestimating the returns to education and income?. Journal of Public Economics, 230, 105052.
Baumeister, R. F., & Leary, M. R. (1995). The need to belong: Desire for interpersonal attachments as a fundamental human motivation. Psychological Bulletin, 117(3), 497.
Baumeister, R. F., Bratslavsky, E., Finkenauer, C., & Vohs, K. D. (2001). Bad is stronger than good. Review of general psychology, 5(4), 323-370.
Bell, A., & Jones, K. (2018). The hierarchical age–period–cohort model: Why does it find the results that it finds?. Quality & quantity, 52, 783-799.
Benjamin, D. J., Cooper, K., Heffetz, O., Kimball, M. S., & Zhou, J. (2023). Adjusting for Scale-Use Heterogeneity in Self-Reported Well-Being (No. w31728). National Bureau of Economic Research.
Blanchflower, D. G. (2021). Is happiness U-shaped everywhere? Age and subjective well-being in 145 countries. Journal of Population Economics, 34(2), 575-624.
Blanchflower, D. G., & Oswald, A. J. (2008). Is well-being U-shaped over the life cycle?. Social science & Medicine, 66(8), 1733-1749.
Bloem, J. R., & Oswald, A. J. (2022). The analysis of human feelings: a practical suggestion for a robustness test. Review of Income and Wealth, 68(3), 689-710.
Bond, T. N., & Lang, K. (2019). The sad truth about happiness scales. Journal of Political Economy, 127(4), 1629–1640.
Bu, F., Steptoe, A., & Fancourt, D. (2020). Who is lonely in lockdown? Cross-cohort analyses of predictors of loneliness before and during the COVID-19 pandemic. Public health, 186, 31-34.
Burnes, D., Henderson Jr, C. R., Sheppard, C., Zhao, R., Pillemer, K., & Lachs, M. S. (2017). Prevalence of financial fraud and scams among older adults in the United States: A systematic review and meta-analysis. American journal of public health, 107(8), e13-e21.
Campbell, W. K., Campbell, S. M., Siedor, L. E., & Twenge, J. M. (2015). Generational differences are real and useful. Industrial and Organizational Psychology, 8(3), 324-331.
Carstensen, L. L. (2006). The influence of a sense of time on human development. Science, 312(5782), 1913-1915.
Carstensen, L. L., Shavit, Y. Z., & Barnes, J. T. (2020). Age advantages in emotional experience persist even under threat from the COVID-19 pandemic. Psychological science, 31(11), 1374-1385.
Charles, S. T. (2010). Strength and vulnerability integration: a model of emotional well-being across adulthood. Psychological bulletin, 136(6), 1068.
Charles, S. T., Mather, M., & Carstensen, L. L. (2003). Aging and emotional memory: the forgettable nature of negative images for older adults. Journal of Experimental Psychology: General, 132(2), 310.
Chen, C., Lee, S. Y., & Stevenson, H. W. (1995). Response style and cross-cultural comparisons of rating scales among East Asian and North American students. Psychological Science, 6(3), 170–175.
Chida, Y., & Steptoe, A. (2008). Positive psychological well-being and mortality: a quantitative review of prospective observational studies. Psychosomatic medicine, 70(7), 741-756.
Cogin, J. (2012). Are generational differences in work values fact or fiction? Multi-country evidence and implications. The International Journal of Human Resource Management, 23(11), 2268-2294.
Cohen, S., Doyle, W. J., Turner, R. B., Alper, C. M., & Skoner, D. P. (2003). Emotional style and susceptibility to the common cold. Psychosomatic Medicine, 65(4), 652-657.
Clark, A. E., d’Albis, H., & Greulich, A. (2021). The age U-shape in Europe: The protective role of partnership. Vienna Yearbook of Population Research, 19, 293-318. https://shs.hal.science/halshs-03467204/document
Danner, D. D., Snowdon, D. A., & Friesen, W. V. (2001). Positive emotions in early life and longevity: Findings from the nun study. Journal of Personality and Social Psychology, 80(5), 804–813.
De Neve, J. E., Diener, E., Tay, L., & Xuereb, C. (2013). The objective benefits of subjective well-being. In J. F. Helliwell, R. Layard, & J. Sachs (Eds.), World Happiness Report 2013 (pp. 54–79). New York: SDSN.
Dolan, P., Krekel, C., Shreedhar, G., Lee, H., Marshall, C., & Smith, A. (2021). Happy to help: The welfare effects of a nationwide micro-volunteering programme. IZA Discussion Paper 14431.
Doyle, W. J., Gentile, D. A., & Cohen, S. (2006). Emotional style, nasal cytokines, and illness expression after experimental rhinovirus exposure. Brain, Behavior, and Immunity, 20(2), 175-181.
Dussaillant, F., & Guzmán, E. (2014). Trust via disasters: The case of Chile’s 2010 earthquake. Disasters, 38(4), 808–832.
Ferrer‐i‐Carbonell, A., & Frijters, P. (2004). How important is methodology for the estimates of the determinants of happiness?. The Economic Journal, 114(497), 641–659.
Folk, D. P., Helliwell, J. F., Holt-Lunstad, J., Norton, M., & Tov, W. (2024). Comparing the Effects of Loneliness, Social Support, and Social Connection on Relationship Satisfaction in Seven Countries. PsyArXiv. https://doi.org/10.31234/osf.io/vzpk4
Fortin, N., Helliwell, J.F., & Wang, S. (2015) How does subjective well-being vary around the world by gender and age? In J. F. Helliwell, R. Layard, & J. Sachs (Eds.), World Happiness Report 2015 (pp. 42–75). New York: SDSN.
Fredrickson, B. L. (2001). The role of positive emotions in positive psychology: The broaden-and-build theory of positive emotions. American Psychologist, 56(3), 218–226.
Gallup/Meta (2022). The State of Social Connections study. https://dataforgood.facebook.com/dfg/docs/2022-state-of-social-connections-study
Gallup/Meta (2023). The Global State of Social Connections.
Gerstorf, D., Ram, N., Mayraz, G., Hidajat, M., Lindenberger, U., Wagner, G. G., & Schupp, J. (2010). Late-life decline in well-being across adulthood in Germany, the United Kingdom, and the United States: Something is seriously wrong at the end of life. Psychology and aging, 25(2), 477.
Giuntella, O., McManus, S., Mujcic, R., Oswald, A. J., Powdthavee, N., & Tohamy, A. (2023). The midlife crisis. Economica, 90(357), 65-110.
Goff, L., Helliwell, J. F., & Mayraz, G. (2018). Inequality of subjective well‐being as a comprehensive measure of inequality. Economic Inquiry, 56(4), 2177–2194.
Graham, C., & Ruiz Pozuelo, J. (2017). Happiness, stress, and age: How the U curve varies across people and places. Journal of Population Economics, 30, 225-264.
Grover, S., & Helliwell, J. F. (2019). How’s life at home? New evidence on marriage and the set point for happiness. Journal of Happiness Studies, 20(2), 373-390.
Hale, T., Angrist, N., Goldszmidt, R., Kira, B., Petherick, A., Phillips, T., .… & Tatlow, H. (2021). A global panel database of pandemic policies (Oxford COVID-19 Government Response Tracker). Nature human behaviour, 5(4), 529-538.
Helliwell, J. F., & Wang, S. (2011). Trust and well-being. International Journal of Wellbeing, 1(1), 42–78.
Helliwell, J. F., Aknin, L. B., Shiplett, H., Huang, H., & Wang, S. (2018). Social capital and prosocial behaviour as sources of well-being. In E. Diener, S. Oishi, & L. Tay (Eds.), Handbook of well-being. (pp. 528–543). Salt Lake City, UT: DEF Publishers.
Helliwell, J., Huang, H., Norton, M., and Wang, S. (2019). Happiness at different ages: The social context matters. In The economics of happiness: How the Easterlin paradox transformed our understanding of well-being and progress, ed. M. Rojas, New York: Springer.
Helliwell, J. F., Shiplett, H., & Bonikowska, A. (2020). Migration as a test of the happiness set‐point hypothesis: Evidence from immigration to Canada and the United Kingdom. Canadian Journal of Economics/Revue canadienne d’économique, 53(4), 1618–1641.
Helliwell, J. F., Huang, H., Wang, S., & Norton, M. (2021). World happiness, trust and deaths under COVID-19. World Happiness Report 2021, 13-57.
Holt-Lunstad, J., Smith, T. B., Baker, M., Harris, T., & Stephenson, D. (2015). Loneliness and social isolation as risk factors for mortality: a meta-analytic review. Perspectives on Psychological Science, 10(2), 227–237.
James, B. D., Boyle, P. A., & Bennett, D. A. (2014). Correlates of susceptibility to scams in older adults without dementia. Journal of elder abuse & neglect, 26(2), 107-122.
Kannan, V. D., & Veazie, P. J. (2023). US trends in social isolation, social engagement, and companionship⎯ nationally and by age, sex, race/ethnicity, family income, and work hours, 2003–2020. SSM-Population Health, 21, 101331.
Kaiser, C., & Oswald, A. J. (2022). The scientific value of numerical measures of human feelings. Proceedings of the National Academy of Sciences, 119(42), e2210412119.
Kang, S. H., & Skidmore, M. (2018). The effects of natural disasters on social trust: Evidence from South Korea. Sustainability, 10(9), 2973.
Krueger, A. B., & Schkade, D. A. (2008). The reliability of subjective well-being measures. Journal of Public Economics, 92(8-9), 1833–1845.
Leigh-Hunt, N., Bagguley, D., Bash, K., Turner, V., Turnbull, S., Valtorta, N., & Caan, W. (2017). An overview of systematic reviews on the public health consequences of social isolation and loneliness. Public Health, 152, 157–171.
Leijen, I., van Herk, H., & Bardi, A. (2022). Individual and generational value change in an adult population, a 12-year longitudinal panel study. Scientific Reports, 12(1), 17844.
Mather, M., & Carstensen, L. L. (2003). Aging and attentional biases for emotional faces. Psychological science, 14(5), 409-415.
Michalski, C. A., Diemert, L. M., Helliwell, J. F., Goel, V., & Rosella, L. C. (2024). Relationship between sense of community belonging and self-rated health across life stages. SSM-population health, 12, 100676.
Mogstad, M. Romano J.P., Shaikh, A. & Wilhelm D., Inference for Ranks with Applications to Mobility across Neighbourhoods and Academic Achievement across Countries, The Review of Economic Studies, Volume 91, Issue 1, January 2024, Pages 476–518.
Montgomery, M. (2022). Reversing the gender gap in happiness. Journal of Economic Behavior & Organization, 196, 65-78.
Mueller, E. A., Wood, S. A., Hanoch, Y., Huang, Y., & Reed, C. L. (2020). Older and wiser: age differences in susceptibility to investment fraud: the protective role of emotional intelligence. Journal of Elder Abuse & Neglect, 32(2), 152-172.
Murthy, V.H. (2023). Our Epidemic of Loneliness and Isolation: The U.S. Surgeon General’s Advisory on the Healing Effects of Social Connection and Community https://www.hhs.gov/sites/default/files/surgeon-general-social-connection-advisory.pdf
Nilsson, A. H., Eichstaedt, J. C., Lomas, T., Schwartz, A., & Kjell, O. (2024). The Cantril Ladder elicits thoughts about power and wealth. Scientific Reports, 14(1), 2642.
Oishi, S., & Westgate, E. C. (2022). A psychologically rich life: Beyond happiness and meaning. Psychological Review, 129(4), 790.
Parry, E., & Urwin, P. (2011). Generational differences in work values: A review of theory and evidence. International journal of management reviews, 13(1), 79-96.
Pressman, S. D., Jenkins, B. N., & Moskowitz, J. T. (2019). Positive affect and health: What do we know and where next should we go?. Annual review of psychology, 70, 627-650.
Putnam, R. D. (2000). Bowling alone: The collapse and revival of American community. Simon and schuster.
Putnam, R. D. (2020). The upswing: How America came together a century ago and how we can do it again. Simon and Schuster.
Reed, A. E., & Carstensen, L. L. (2012). The theory behind the age-related positivity effect. Frontiers in psychology, 3, 339. https://doi.org/10.3389/fpsyg.2012.00339
Reed, A. E., Chan, L., & Mikels, J. A. (2014). Meta-analysis of the age-related positivity effect: age differences in preferences for positive over negative information. Psychology and aging, 29(1), 1.
Rojas, M. (2018). Happiness in Latin America has social foundations. In J. F. Helliwell, R. Layard, & J. Sachs (Eds.), World happiness report 2018 (pp. 114–145). New York: SDSN.
Shovestul, B., Han, J., Germine, L., & Dodell-Feder, D. (2020). Risk factors for loneliness: The high relative importance of age versus other factors. PloS one, 15(2), e0229087.
Steptoe, A., Deaton, A., & Stone, A. A. (2015). Subjective wellbeing, health, and ageing. The Lancet, 385(9968), 640-648.
Steptoe, A., Shankar, A., Demakakos, P., & Wardle, J. (2013). Social isolation, loneliness, and all-cause mortality in older men and women. Proceedings of the National Academy of Sciences, 110(15), 5797-5801.
Stone, A. A., Schwartz, J. E., Broderick, J. E., & Deaton, A. (2010). A snapshot of the age distribution of psychological well-being in the United States. Proceedings of the National Academy of Sciences, 107(22), 9985-9990.
Stone, A. A., Schneider, S., Junghaenel, D. U., & Broderick, J. E. (2019). Response styles confound the age gradient of four health and well-being outcomes. Social Science Research, 78, 215-225.
Toya, H., & Skidmore, M. (2014). Do natural disasters enhance societal trust?. Kyklos, 67(2), 255–279.
Twenge, J. M., Campbell, W. K., & Freeman, E. C. (2012). Generational differences in young adults’ life goals, concern for others, and civic orientation, 1966–2009. Journal of personality and social psychology, 102(5), 1045.
Van der Brug, W., & Kritzinger, S. (2012). Generational differences in electoral behaviour. Electoral Studies, 31(2), 245-249.
Walzak, L. C. (2023). Fraud susceptibility across adulthood: Age, context, and the role of individual differences. https://summit.sfu.ca/_flysystem/fedora/2023-11/etd22730.pdf
Yamamura, E., Tsutsui, Y., Yamane, C., Yamane, S., & Powdthavee, N. (2015). Trust and happiness: Comparative study before and after the Great East Japan Earthquake. Social Indicators Research, 123(3), 919–935.
Zak, P. J., Curry, B., Owen, T., & Barraza, J. A. (2022). Oxytocin release increases with age and is associated with life satisfaction and prosocial behaviors. Frontiers in behavioral neuroscience, 16, 846234.
Endnotes
See Fortin et al. (2015). ↩︎
Our groups follow the approximate demarcation lines between Boomers and their predecessors, Generation X, the Millennials (often called Gen Y) and Gen Z (those born 1995 or later. Our global data show that these Western-centric definitions do not apply to many of the key generational shifts we find, such as those before and after the collapse of the USSR, civil wars and genocides, and first and subsequent generations of migrants from one country to another. Generational differences have been highlighted in the workplace (Parry & Unwin 2011, Campbell et al. 2015), in voting behaviour (Van den Brug & Kritzinger 2012) and values more generally (Twenge et al. 2012). ↩︎
The base period also includes data collected from 27 countries in 2005, as the first round of the Gallup World Poll was divided between 2005 and 2006. Only one country, France, had surveys in both 2005 and 2006. Thus our base period includes all data collected before 2011. ↩︎
A country’s average answer to the Cantril ladder question is exactly equivalent to a notion of average underlying satisfaction with life under an assumption of “cardinality:” the idea that the difference between a 4 and a 3 should count the same as the difference between a 3 and a 2, and be comparable across individuals. Some social scientists argue that too little is known about how people choose their answer to the Cantril ladder question to make this assumption and that if it is wrong enough, then rankings based on average survey responses could differ from rankings based on underlying satisfaction with life (Bond & Lang, 2019). Other researchers have concluded that answers to the Cantril ladder question are indeed approximately cardinal (Bloem & Oswald, 2022; Ferrer-i-Carbonell & Frijters, 2004; Kaiser & Oswald, 2022; Krueger & Schkade, 2008). ↩︎
For any pair of countries, the confidence intervals for the means (depicted in Figure 2.1 as whiskers) can be used to gauge which country’s mean is higher than the other, accounting for statistical uncertainty in the measurement of each. The confidence interval for a country’s rank (given in Figure 2.1 as text) represents a range of possible values for the ranking of their mean among all countries, accounting for uncertainty in the measurement of all of the means (following Mogstad et al., 2024). The ranges are constructed so that the chance that the range does not contain the country’s true rank is no more than 5%. ↩︎
Not every country has a survey every year. The total sample sizes are reported in Statistical Appendix 1, and are reflected in Figure 2.1 by the size of the 95% confidence intervals for the mean, indicated by horizontal lines. The confidence intervals are naturally tighter for countries with larger samples. ↩︎
Countries marked with an * do not have survey information in 2023. Their averages are based on the 2021 and/or 2022 surveys. ↩︎
The actual average values for each survey year may be found in the online data file supporting the equations in Table 2.1. For Israel, the average ladder for 2021-2022 was 7.61, compared to 6.78 in 2023. The latter average, if compared to the three-year averages used for other countries, would put Israel 19th in the rankings. ↩︎
For detailed analysis of the life satisfaction of immigrants to the United Kingdom and Canada from many source countries of, see Helliwell et al. (2020). ↩︎
Costa Rica is actually a re-entrant, having also been in 12th position in WHR 2013. Kuwait was out of the rankings last year for lack of surveys during the three-year period, so its ranking in WHR 2024 is based only on the 2023 survey. ↩︎
The statistical appendix contains alternative forms without year effects (Appendix Table 9), and a repeat version of the Table 2.1 equation showing the estimated year effects (Appendix Table 8). These results continue to confirm that inclusion of year effects makes no significant difference to any of the coefficients. In these aggregate equations, adding regional or country fixed effects would lower the coefficients on relatively slow moving variables where most of the variance is across countries rather than over time, such as healthy life expectancy and the log of GDP. With equations based on individual observations, where income and health are measured by individual-level variables, adding country fixed effects makes little difference to any of the coefficients. ↩︎
The definitions of the variables are shown in Technical Box 2, with additional detail in the online Statistical Appendix. ↩︎
The model’s predictive power is little changed if the year fixed effects in the model are removed, with adjusted R-squared falling only from 0.757 to 0.753. ↩︎
The data and rankings for the 2021-2023 averages for the six variables are to be found in Figures 68-91 of the Statistical Appendix. The underlying annual data used in estimating the equations shown in Table 2.1 can be found in an online file accompanying the chapter. ↩︎
For example, unemployment responses at the individual level are available in most waves of the Gallup World Poll. While they show an effect size similar to that found in other research, the coefficient has never been significant in the country-level equation, and their inclusion does not influence the size of the other coefficients. ↩︎
Below, we use the term “effect” when describing the coefficients in these regressions; some caveats to this interpretation are discussed later in this section. ↩︎
In the equation for negative affect, healthy life expectancy takes a significant positive coefficient, despite its positive simple correlation with life evaluations in this aggregate dataset. This may be due to the fact that in the global sample there is a positive correlation between age and the frequency of reports of negative emotions. Countries with higher healthy life expectancies have respondents who are on average older, since the sample data are weighted to replicate the actual age shares of the population. ↩︎
This influence may be direct, as many have found, e.g. De Neve et al. (2013). It may also embody the idea, as made explicit in Fredrickson’s broaden-and-build theory (Fredrickson, 2001), that good moods help to induce the sorts of positive connections that eventually provide the basis for better life evaluations. ↩︎
See, for example, the well-known study of the longevity of nuns, Danner et al. (2001). ↩︎
See Cohen et al. (2003), and Doyle et al. (2006). ↩︎
The meta analysis by Chida & Steptoe (2008) shows significant linkages from positive affect to health, independent of the effects of negative affect. For a recent survey of the links running from positive emotions and life evaluations to subsequent morbidity and mortality, see Pressman et al. (2019). ↩︎
The prevalence of these feedbacks was documented in Chapter 4 of World Happiness Report 2013, De Neve et al. (2013). ↩︎
We expected the coefficients on these variables (but not on the variables based on non-survey sources) to be reduced to the extent that idiosyncratic differences among respondents tend to produce a positive correlation between the four survey-based factors and the life evaluations given by the same respondents. This line of possible influence is cut when the life evaluations are coming from an entirely different set of respondents than are the four social variables. The fact that the coefficients are reduced only very slightly suggests that the common-source link is real but very limited in its impact. ↩︎
The coefficients on GDP per capita and healthy life expectancy were affected even less, and in the opposite direction in the case of the income measure, being increased rather than reduced, once again just as expected. The changes were very small because the data come from other sources, and are unaffected by our experiment. However, the income coefficient does increase slightly, since income is positively correlated with the other four variables being tested, so that income is now able to pick up a fraction of the drop in influence from the other four variables. We also performed an alternative robustness test, using the previous year’s values for the four survey-based variables. Because each year’s respondents are from a different random sampling of the national populations, using the previous year’s average data also avoids using the same respondent’s answers on both sides of the equation. This alternative test produced similarly reassuring results as shown in Table 13 of Statistical Appendix 1 in World Happiness Report 2018. The Table 13 results are very similar to the split-sample results shown in Tables 11 and 12, and all three tables give effect sizes very similar to those in Table 2.1 in the main text. Because the samples change only slightly from year to year, there was no need to repeat these tests with this year’s sample. ↩︎
Actual and predicted national and regional average 2021-2023 life evaluations are plotted in Figure 92 of the Statistical Appendix. The 45-degree line in each part of the Figure shows a situation where the actual and predicted values are equal. A predominance of country dots below the 45-degree line shows a region where actual values are below those predicted by the model, and vice versa. Southeast and South Asia provide the largest current example of the former case, and Latin America of the latter. ↩︎
See Rojas (2018). ↩︎
If special variables for Latin America and Southeast Asia are added to the equation in column 1 of Table 2.1, the Latin American coefficient is +0.49 (t=5.2) while that for Southeast Asia is -0.31 (t=2.3). Special variables for East Asia and South Asia are not significant. ↩︎
See Chen et al. (1995) for differences in response style, and Chapter 6 of World Happiness Report 2022 for data on regional differences in variables thought to be of special importance in Asian cultures. ↩︎
One slight exception is that the negative effect of corruption is estimated to be slightly larger (0.87 rather than 0.73), although not significantly so, if we include a separate regional variable for Latin America. This is because perceived corruption is worse than average in Latin America, and its happiness effects there are offset by stronger close-knit social networks, as described in Rojas (2018). The inclusion of a special Latin American variable thereby permits the corruption coefficient to take a higher value. ↩︎
More precisely, the test vehicle is the equation in column 1 with no year fixed effects, given our wish to compare the four COVID years to the preceding years. Aknin et al. (2022), in a study for the Lancet task force, used the high frequency COVID policy stringency data of Hale el al. (2021) and longitudinal survey data of well-being in 15 countries to show that COVID deaths and policy stringency both to have negative partial linkages to mental health, with the stringency effect being small and offset in many countries by the corresponding lower death rates. See also Bu et al. (2020). ↩︎
The corresponding rankings for the two intermediate age groups are in the Statistical Appendix. ↩︎
Although Rwanda is not in the current rankings, its data from earlier years also confirms that past internecine violence leaves bigger scars on the lives of those who lived through them. In Rwanda, the average life evaluation of those 60 and over is lower than that of those under 30 by nearly two-thirds of a point.This is in contrast to natural disasters, which have been shown, where initial levels of social trust are sufficiently high, to lead to subsequent increases as people reach out to help others in need. See, for examples, Toya & Skidmore (2014), Yamamura et al. (2015), Kang & Skidmore (2018), Dussaillant & Guzman (2014) and Aldrich (2011). And for COVID-19, see Bartscher et al. (2021), Bu et al. (2020), and the COVID death rate modelling in Helliwell et al. (2021). ↩︎
It has been argued that response styles of respondents (the extent to which they tend to give middling or end-point answers, for example) varies by age, and hence might influence conclusions about relative happiness at different ages (Stone et al. 2019). However, their evidence suggests the potential effects on life evaluations are not significant. See also Benjamin et al. (2023). Barrington-Leigh (2024) argues that differing use of focal points may be leading to underestimating the effects of education and income, while Nilsson et al. (2024) argue that the ladder framing of the Gallup life evaluation question may induce higher estimates of the effects of income and power. ↩︎
What is plotted here is the average across countries of each country’s average happiness in the age group in question. If we were instead to use the number of people in our global sample in each age group, we would show average happiness being greatest for those over 60, since those countries with greater longevity (and hence more people over 60) also have higher average happiness, for that and other related reasons. ↩︎
Montgomery (2022) studies gender differences in the ranking of life vignettes in the Gallup World Poll, finding a difference of about the same size as the average global ladder advantage for females, and hence a sufficient explanation for the global average gap. This is less likely to affect the analysis of differences among regions or over time. There is no matching vignette analysis available for the Gallup data on emotions. ↩︎
We have calculated and compared these ‘one-county-one-vote’ data with population-weighted averages in several earlier reports. The latter tend in some regions to reflect almost entirely the experience of the largest country in the region, and to depend on circumstances and measurement issues best studied on a national level rather than as part of a regional average. ↩︎
The drop is about .04 per year of age in the context of our full model specification,including country and year fixed effects. The drop is only slightly less without any control variables and is slightly greater for males than females. ↩︎
This evidence of life evaluations being higher at higher ages, even among those over 60 years of age, is not found in the earlier years of Gallup World Poll data for India, but is clearly evident in the surveys since 2016, the time period within which the Indian survey was fielded. In Chapter 5 of this volume, the average increase in SWL (on a 0 to 10 scale) is 0.012 per year. In a similar equation for all the global data from the Gallup World Poll, the increase is 0.008 per year. For the South Asian countries as a group the average annual increase is .023. As for other regions, the average annual increase is .025 in Latin America and in the NANZ group, .023 in SE Asia, .013 in East Asia, and approximately zero in Africa and all parts of Europe and the CIS. ↩︎
These equations are run with country fixed effects and the control variables used in the micro equations reported in the statistical appendix. ↩︎
The pattern of declining frequency of positive emotions is roughly the same for laughter, enjoyment and doing something interesting yesterday. It also applies if the sample is split by generation rather than age, reflecting the relatively high correlation between age and generation, due to the still limited number of years in our synthetic panel. ↩︎
See Goff et al. (2018). ↩︎
We cannot measure inequality for the positive and negative emotions because they are only available in the Gallup World Poll as binary yes/no answers about experiences yesterday. ↩︎
Twenge et al. (2012) summarise key papers presenting each of these alternative positions. Their own analysis modestly favours the ‘me generation’ view, except in the case of volunteering, where the evidence is more mixed. ↩︎
See especially Putnam (2000), where it was estimated the generational change “might account for perhaps half of the overall decline” (p.283) in civic engagement and social capital in the last third of the 20th century. See also Putnam (2020). ↩︎
Leijen et al. (2022) found benevolent values in 2020 to be similar in all generations in their longitudinal study of Dutch data. Their millennials started with a lower benevolence value in 2008, but this gradually rises to reach the average of the other generations by 2020. ↩︎
The sample makes use of the data from the 136 countries with surveys in at least five of the seven years spanning 2017-2023. The results are qualitatively similar if the analysis is done using only the 81 countries (as of mid-February 2024) with surveys reported for all seven years. This more restricted sample leaves out countries where surveys were not possible in 2020, the first year of the pandemic. ↩︎
For donations, the COVID-induced increases are similar in magnitude for all generations. ↩︎
If we compare the 2021-2023 data to the average of all previous Gallup years, then there are no increases in benevolence in the NANZ and Western European countries. That is because these countries, which have always had globally high levels of benevolent acts, but have seen significant drops over the past dozen years. Thus for them the COVID-induced growth in benevolence represented the reversal of a downward trend rather than an increase over the levels in 2006-2010. ↩︎
See Dolan et al. (2021) for COVID-related evidence, and more generally, Aknin et al. (2011), Helliwell et al. (2018), and Helliwell & Wang (2011). ↩︎
Murthy (2023), Holt-Lunstad et al. (2015), Kannan & Veazie (2023), Leigh-Hunt et al. (2017), Steptoe et al. (2013). ↩︎
Gallup/Meta (2022) ↩︎
Folk et al. (2024). ↩︎
See Gallup/Meta (2023) ↩︎
The intermediate answers ‘a little’ and ‘a lot’ are coded as 0.33 and 0.67 respectively, reflecting a linear conversion of the original 4-point response scale. This replicates the Likert scale are adopted in the Mate/Gallup (2022) study, transformed from the 1 to 4 scale to a 0 to 1 scale. ↩︎
See Shovestul et al. (2020). ↩︎
In 2022 it averaged 27% across all countries, and 21% for the four-country group including the US, Canada, Australia and New Zealand. ↩︎
With only a single year of data it is not possible to distinguish age and cohort effects. Those under 30 years of age (who are only have as numerous as the millennials+Gen Z) have a frequency of loneliness more than twice that for those 60 and over (who are very similar in number to the Boomers, and are hence the same people) ↩︎
In column 1 of Table 12 of the Statistical Appendix. ↩︎
The standardized betas for the three variables are .076, .053 and .036, respectively. The estimated coefficients are .623 (t=17.7) for feelings of social support, .456 (t=12.4) for feelings of loneliness, and .473 (t=8.5) for the reported frequency of social interactions. ↩︎
See, for example, Blanchflower & Oswald (2008) and Stone et al. (2010). ↩︎
Steptoe et al. (2015). ↩︎
The equation being estimated is y=a +b*age + c*age squared, The slope is b+2 c*age, equaling zero where b-2c*age=0, or at age=b/2c. If b is 100 times as large as c, then the age of minimum happiness is 50 years. The equation is often estimated using age and 100*age-squared in order to show more significant figures for c. In this case the low point is equal to 50 years if -c=b., and is less than 50 if -c>b. See Blanchflower (2021) for a survey of studies using this method, most of which produce minima within the 45-59 age range. ↩︎
Fortin et al. (2015). That chapter uses data from the beginning of the Gallup World Poll in 2005-2006 through most of 2014. ↩︎
See the review of recent estimates in Blanchflower (2021). ↩︎
In the same vein, see Graham & Ruiz Pozuelo (2017). ↩︎
For a wide-ranging review, see Giuntella et al. (2023). ↩︎
For the young, the effect is 0.15*0.30=0.045, while for the old it is 0.5*0.6=0.3. ↩︎
E.g. Blanchflower (2021). However, see another research stream (e.g. Gerstorf et al. 2010) that finds in some countries a sharp drop in subjective well-being as death becomes imminent. ↩︎
Charles et al. (2003) and Mather & Carstensen (2003). Zak et al. (2022) finds a corroborating age-related increase in oxytocin release. ↩︎
Baumeister et al. (2001) provide an influential review of many sorts of evidence that people perceive and react to the bad rather than the good, and prefer to avoid losses rather than to make gains. The authors argue that there is, or at least may once have been, an evolutionary advantage in doing so. ↩︎
See Reed et al. (2014) for a meta analysis of more than 100 experimental studies showing that events are seen in more positive terms at higher ages. ↩︎
According to the socioemotional selectivity theory advanced by Carstensen (2006) the positivity effect is likely to be absent for those who are constrained by experimental or life constraints. ↩︎
James et al. (2014), Burnes et al. (2017). ↩︎
Reed & Carstensen (2012). ↩︎
Mueller et al. (2020). ↩︎
Walzak (2023). ↩︎
Baumeister & Leary (1995). ↩︎
See Michalski et al. (2020) and Helliwell et al. (2019) ↩︎
See Anusic et al. (2014), Clark et al. (2021), Grover & Helliwell (2019) and Helliwell et al. (2019). Using our global model (from Table 12 in the Statistical Appendix) based on individual data for those under 50 years of age, we estimated equations for those who are married (or cohabiting) separately from the rest of the population. The estimated annual drop in life evaluations is one-third less for the married/cohabiting group. Thus the global data confirm the earlier findings based on data mainly from the UK and other countries in Western Europe. ↩︎
See Carstensen et al. (2020) for survey evidence showing robustness of the age-related positivity effect during COVID in a US sample. The authors argue that this robustness in the face of a highly salient and powerful threat tends to favour its generality. Some argue that this effect may be muted or reversed when death is imminent (Charles, 2010). ↩︎
Oishi and Westgate (2022) argue that a rich life, which prioritises curiosity and seeks challenges, has a value quite beyond happiness and meaning. They argue that such richness ‘grows over time in response to perspective-changing life experiences’ (Oishi & Westgate, 2022, p. 17). As such it is likely to provide an additional reason for life evaluations to rise at older ages. ↩︎
It requires a substantial number of years of data to attempt to identify separate effects for age, time and generation, as in a single year the three are linked by the identity whereby for each individual age+ year of birth = year. The ability to partition the effects among age, cohort and time is heavily dependent on the number of years, the selection of cohorts, and the functional forms used (Bell & Jones, 2018). Our identification attempt makes use of an established quadratic form for the effects of age on life satisfaction and a fairly well established split of respondents into three generational groups. It also includes fixed effects for each year. The results confirm the usual positive coefficient on age and a negative coefficient of age squared while delivering also highly significant generational coefficients, with t-values of about 10 for the intergenerational differences. Much of the increase in life satisfaction for those in the older age group is in this equation transferred from the age squared term to a generational advantage for the Boomers and, to a lesser extent, Gen X. ↩︎
See column 1 of Table 12. ↩︎
The annual rise for the Boomers is 0.006 (from column 4 of Table 12) while the annual fall for the Millennials is 0.029 (column 2 of Table 12). ↩︎
See column 1 in Table 12 of the Statistical Appendix. That equation includes country and year fixed effects, gender, age, age-squared, and individual-level counterparts to the six variables in the model of Table 2.1. The age effects within each generation are shown in columns 2 and 4 of Appendix Table 12. ↩︎