Child and Adolescent Well-being: Global Trends, Challenges and Opportunities
Key Insights
- Life satisfaction gradually drops from childhood through adolescence into adulthood. Globally, adolescents aged 15-24 still report higher life satisfaction than adults aged 25 or above, but the gap is narrowing in Western Europe and recently reversed in North America and Australia and New Zealand (ANZ) due to negative trends for young people. Conversely, the gap is widening in Sub-Saharan Africa due to increasing life satisfaction among the youth.
- In middle-to-late adolescence (age 15-24), there was a positive 2006-2019 global trend in life satisfaction, which ended with the pandemic, in line with adult trends.
- Global trends obscure regional variations, some of which differ from adult trends. Negative trends between 2006 and 2022 at age 15-24 are found in North America and ANZ, Western Europe, Middle East and North Africa (MENA), and South Asia, and positive trends in Sub-Saharan Africa, Central and Eastern Europe, the Commonwealth of Independent States, Latin America and the Caribbean, and Southeast Asia.
- In early-to-middle adolescence (age 10-15), global well-being data is lacking, with many world regions having no available information. Evidence primarily from high-income countries indicates significant life satisfaction declines post-COVID-19, especially among females, contrasting with East Asian countries, where life satisfaction increased. There is mixed evidence regarding pre-pandemic trends.
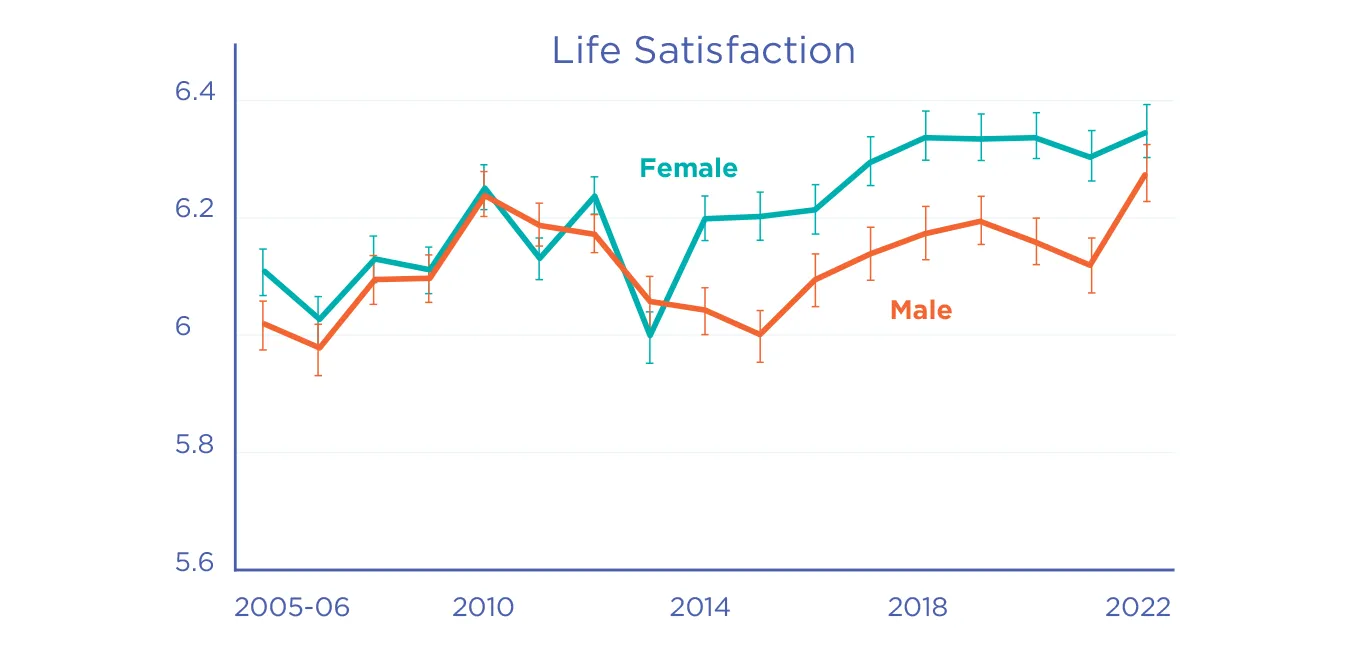
- Females start reporting lower life satisfaction than males by around age 12. This gap widens at ages 13 and 15, and the pandemic has amplified these inequalities. These patterns are primarily observed in high-income countries due to limited data worldwide. In contrast, global data for middle-to-late adolescence (age 15-24) shows no global gender differences from 2006 until 2013, but from 2014, females began reporting higher life satisfaction than males, although the gap has narrowed following the pandemic. This global gender gap masks regional differences, and is more pronounced in lower-income countries, with no gender differences observed in high-income countries.
- Life satisfaction levels, trends and correlates vary across age, gender, world regions and countries, and economic development levels. This underscores the importance of addressing current data gaps to enhance our understanding of child and adolescent well-being and how to promote it globally.
This chapter is the first across the 10+ years of the World Happiness Report that explores child and adolescent well-being in some detail. In this chapter, we examine data from four well-established international datasets with respondents aged 10-24. We present the global state of child and adolescent well-being, with a focus on levels, trends, inequalities, and correlates. An important aspect of this chapter is a discussion of the shortcomings of the available international data and what action should be taken to improve data quantity and quality, and thereby improve our understanding of child and adolescent well-being and how to improve it worldwide.
Defining Childhood and Adolescence
In this chapter, we define childhood and adolescence within the age range of 10 to 24, reflecting critical brain development stages.[1] The extended upper age boundary might surprise some readers, but contemporary understanding considers adolescence to persist until around 24 years of age,[2] aligning with the ongoing brain development linked to adolescence that extends into the early 20s,[3] and other aspects of individual development and cultural norms.[4] Similarly, childhood spans birth (or conception) to around 10 years, however, we acknowledge that childhood can extend beyond age 10, prompting us to include both terms childhood and adolescence throughout this chapter.
In the analysis and discussion, we differentiate between early-to-middle adolescence (ages 10-15) and middle-to-late adolescence (ages 15-24). This distinction is needed due to differences in available international datasets, requiring distinct approaches to analyze and interpret the data. We also acknowledge that significant hormonal, physical, neurobiological, psychological, social, and environmental changes occur not only from age 10-24, but also within the two age ranges examined.[5] We consider these in the interpretation of the results (e.g. life satisfaction declines from age 10 to 15).
Defining Well-Being in Childhood and Adolescence
Similar to adult research featured in previous World Happiness Reports, this chapter centers on child and adolescent subjective well-being, which is how young individuals perceive and assess their own lives. Every time we use the term ‘well-being’ in this chapter, we refer to subjective well-being. The prevailing theoretical framework for subjective well-being in childhood and adolescence (and adulthood) includes affective evaluations (positive and negative emotions), cognitive evaluations (life satisfaction), and sometimes also comprises eudaimonic evaluations (such as meaning and purpose).[6] However, there are nuanced differences between approaches in adult and child/adolescent subjective well-being research. Cognitive evaluations, covering overall life satisfaction, also tend to consider domain-specific assessments, such as satisfaction with school, school peers, physical appearance, and time use, to cite a few.[7] Additionally, in certain fields like health sciences, mental health is integral to child and adolescent well-being, and the terms are often used interchangeably.[8] It is important to acknowledge that these components are primarily derived from a Western perspective due to the origin of much of the research. In this chapter, we focus on cognitive evaluations, specifically overall life satisfaction measured on a 0-10 response scale, driven by data availability and comparability. There are slight differences in the life satisfaction/evaluation scales used across the data sets examined, which are described below. However, for ease, we refer to them as life satisfaction as this is the established term in the child and adolescent literature.[9]
Child and Adolescent Well-Being: What We Know
While research into subjective well-being in adulthood has been an established field for many decades,[10] subjective well-being as a specific field with children and adolescents is a more recent field of inquiry. Particularly in the last 15 years, increased interest in this field has been driven by advances in child development theory, increased children’s rights legislation, and developments in positive psychology and social science.[11] Interest has also increased following some specific research findings. A detailed literature review is beyond the scope of this chapter, but there are a few key findings worth noting. Most of them refer to school-age children and adolescents.
Research has highlighted the importance of consulting children directly, as their subjective well-being is weakly correlated with that of adults or families, and parents’ reports of their children’s well-being are not always aligned with children’s own reports.[12] There is evidence supporting the validity and reliability of measuring child subjective well-being and related factors from age 8.[13] Evidence from the health literature further supports children as reliable and accurate reporters of their health and well-being, emphasizing the importance of their self-reported perceptions in understanding their experiences.[14] There is also specific evidence on the validity of the Cantril Ladder as a measure for adolescent samples of 11, 13, and 15-year-olds.[15]
Children and adolescents generally report higher subjective well-being than adults, with variations across societies and vulnerable groups, including females, immigrants, children in care, and certain minorities.[16] Subjective well-being trajectories show a decline from age 10 to late adolescence and adulthood,[17] varying among groups and countries, with evidence suggesting a more profound decline in lower-income countries.[18] Furthermore, studies indicate that adolescent subjective well-being is declining in many countries, including evidence from both before[19] and after the onset of the COVID-19 pandemic.[20] There is also evidence that these declines are more pronounced among females than males,[21] and that the drivers of this decline may differ between countries,[22] which emphasizes the need for cross-cultural insights.
The best predictor for adult life satisfaction is subjective well-being and emotional health during childhood.
Childhood and adolescence, besides being crucial life stages in their own right,[23] are subjects of interest for their impact on individuals as they transition into adulthood. Research on developmental trajectories from these periods to adulthood reveals a significant influence on later life outcomes, encompassing adult well-being, labor market success, physical health, and relationships. There is evidence that indicates that the best predictor for adult life satisfaction is subjective well-being and emotional health during childhood, and that the next major influence on emotional health, after family, is school both in childhood and adolescence.[24] In addition, further research suggests that subjective well-being in adolescence predicts levels of income in adulthood, even when employing family-fixed-effects (with sibling clusters) and controlling for factors such as education, intelligence quotient, physical health, height, self-esteem, and later happiness. These findings were mediated by a higher probability of obtaining a college degree, getting hired and promoted, having higher degrees of optimism and extraversion, and less neuroticism.[25] Thus, childhood and adolescence represent periods of considerable importance and a unique window opportunity for intervention, allowing for strong and positive impacts on global society.
A range of factors have been found to explain variations in child and adolescent subjective well-being. There is a nuanced association with socio-economic status, with stronger links to material deprivation – especially when measured via child-derived indices – than family income.[26] Relationships, both with parents and peers, play a substantial role, and schools are considered as key domains where policy interventions can make a significant impact. Factors like bullying and school-related anxiety influence subjective well-being, but this relationship is nuanced and varies across population groups, countries, and measures.[27] Other influential drivers include aspects related to various life domains, including health, physical activity, time use, neighborhood, safety, and children’s rights.[28] Most of the drivers identified in the literature are factors in the close environment, such as family, school, and community.[29] Associations with subjective well-being have been found for some child-focused macro-level factors (e.g.spending on families and education as a percentage of GDP).[30] However, for many others, and particularly macro-economic factors, associations are found for adults but not for children and adolescents aged 10-15.[31] Indeed, researchers have reported counterintuitive results, such as findings on the negative association between the country level of economic development and adolescent subjective well-being at age 15.[32] However, some of these counterintuitive findings may be the results of adolescents from non-high-income countries not being considered in these analyses as data in these countries is not available for younger adolescents.[33]
It is important to note that most of what we know about child and adolescent subjective well-being is mainly from adolescents in high-income countries. Thus, improved worldwide data collection is crucial for understanding and promoting adolescent subjective well-being globally.
International Data on Child and Adolescent Well-Being
Despite the surge of interest in these critical developmental periods, the available international data on child and adolescent subjective well-being remains notably limited. As a result, while subjective well-being research within specific cultural contexts is abundant,[34] international research remains comparatively scarce. Four major cross-sectional datasets provide information on child and/or adolescent subjective well-being (see Box 1 for details): the Programme for International Student Assessment (PISA) survey; the Health Behaviour in School-aged Children (HBSC) survey; the International Survey of Children’s Well-being (ISCWeB or “Children’s Worlds”); and the Gallup World Poll (GWP). Children’s Worlds explicitly centers on child subjective well-being, and not only measures life satisfaction (the cognitive component) but also affective and eudaimonic components, which are crucial for holistic analyses.[35] In contrast, the other studies measure subjective well-being but not as their primary focus. The GWP, though collecting nationally representative data for their entire sample aged 15+ to late adulthood, lacks such representation for the subset used in this chapter, focusing on adolescents aged 15-24 (middle-to-late adolescence). However, the GWP collects global data from 120-140 countries in most world regions, including many low-income countries. By contrast, PISA, HBSC, and Children’s Worlds collect nationally representative samples of adolescents aged 10 to 15 (early-to-middle adolescence) in some 20-70 countries, mostly in high-income, Western societies.
The World Happiness Report 2023 underscored the natural approach of measuring a nation’s happiness by asking a nationally-representative sample about their life satisfaction.[36] In the annual World Happiness Report rankings, the Cantril Ladder from the Gallup World Poll gauges well-being or “happiness”.[37] In this chapter on childhood and adolescence well-being, data is drawn from these four surveys focusing on their overall life satisfaction/evaluation measures on an 11-point response scale. This is the only comparable measure in the four data sets, although each survey uses a slightly different version, as described in Box 1. This 11-point scale enhances sensitivity for adolescent respondents in most countries compared to shorter scales,[38] and enables us to develop measures of subjective well-being inequalities (e.g. gender and age-based differences) that are consistent across surveys. As explained earlier, for ease, we use the term life satisfaction throughout this chapter.
Box 3.1: Which large international datasets include measures of child and adolescent well-being?
PISA is the OECD’s Programme for International Student Assessment which surveys nationally representative samples of young people aged 15 across 70 countries/territories.[39] The main focus of the questionnaire is young people’s ability to apply their mathematical, reading, and science skills to real-life challenges. While subjective well-being questions have inconsistently been included in the PISA, data on life satisfaction has been systematically collected in most participating countries in the last three waves (2015, 2018, 2022). In 2022, 74 countries and territories collected life satisfaction data (43 high-income, 24 upper-middle-income, 7 lower-middle-income, zero low-income in the 2022 edition). PISA employs a one-item measure of life satisfaction: “The following question asks how satisfied you feel about your life, on a scale from “0” to “10”. Zero means you feel ‘not at all satisfied’ and “10” means ‘completely satisfied’. Overall, how satisfied are you with your life as a whole these days?”.
The HBSC survey is conducted in collaboration with the WHO Regional Office for Europe. It assesses the health and well-being of adolescents across Europe, North America, and – more recently – Central Asia, using nationally representative samples at ages 11, 13, and 15. There are six waves of data that include subjective well-being measurements (2002, 2006, 2010, 2014, 2018, 2022). The most recent waves included 39 European and North American countries and 5 Commonwealth of Independent States (CIS) in Central Asia in 2022 (35 high-income, seven upper-middle-income, one lower-middle-income, and one low-income). Subjective well-being is assessed using an adapted version of the Cantril Ladder measuring life satisfaction: “Here is a picture of a ladder. The top of the ladder ‘10’ is the best possible life for you, and the bottom ‘0’ is the worst possible life for you. In general, where on the ladder do you feel you stand at the moment? Tick the box next to the number that best describes where you stand.”
The Children’s Worlds survey explores the subjective well-being of children aged 8, 10, and 12, using nationally representative samples of 1000 children in up to 35 countries per wave. There have been three waves of data collection (2011-12, 2013-14, 2017-19), plus a post-COVID-19 wave in 2020-22, which was not nationally representative. The 2017-19 wave expanded to include 30-35 countries (depending on age group; 21-25 high-income, five upper-middle-income, five lower-middle-income, and zero low-income). This study includes a “0” to “10” life satisfaction item: “How satisfied are you with each of the following things in your life? […] 0 = Not at all satisfied; 10 = totally satisfied […]. Your life as a whole”. Data from children aged 8 was excluded in this chapter as the response scale used was different making comparability more challenging.
The Gallup World Poll has tracked the most important issues annually worldwide since 2005. Responses from 15-64-year-olds are representative across 140-160 countries, and the sample includes many lower-middle and low-income countries. For the 15-24 age group employed in this chapter, the sample is not representative. The Cantril Ladder is used to assess life satisfaction: “Please imagine a ladder with steps numbered from zero at the bottom to 10 at the top. The top of the ladder represents the best possible life for you, and the bottom of the ladder represents the worst possible life for you. On which step of the ladder would you say you personally feel you stand at this time?”.
The four surveys examined represent significant endeavors in collecting extensive international child and adolescent well-being data. However, before delving into the results of our analyses, it is essential to acknowledge a few key data limitations affecting the analysis and the subsequent discussion. A primary challenge is the lack of a standardized subjective well-being measure across surveys. Two surveys (HBSC and GWP) utilize a version of the Cantril Ladder, akin to the one used for the adult global happiness ranking in the World Happiness Report, while PISA and Children’s Worlds employ a question about overall life satisfaction. Another limitation stems from the age distribution in the datasets; none cover the entire span from childhood to late adolescence or adulthood, constraining the ability to consistently analyze well-being responses across various age groups. Additionally, a predominant focus on high- and upper-middle-income countries (mostly Western nations) in the data covering early-to-middle adolescence (age 10-15) raises concerns about the generalizability of many findings to lower-income countries. A more detailed discussion of these and other limitations follows at the end of this chapter.
This Chapter
Despite these limitations, this chapter provides a comprehensive examination of global child and adolescent subjective well-being. It begins by exploring life satisfaction levels and trends among children and adolescents, with consideration of regional, gender, and age group variations. The following section offers an overview of current country-level life satisfaction in the post-pandemic world and how these vary across different age groups. We then present correlational analyses to examine inequalities across different socio-demographic groups, and assess how factors within distinct life domains contribute to variations in adolescent life satisfaction. Subsequently, we discuss our findings, as well as shortcomings in international child and adolescent subjective well-being data and how these limitations impact our understanding. Finally, we conclude the chapter by highlighting initiatives that are making major inroads in improving data availability and assessing and promoting child and adolescent well-being, which serve as inspiration for exploring further necessary steps to collectively enhance the well-being of children and adolescents globally.
Trends in Child and Adolescent Well-Being
The four data sets examined differ significantly in participant age, data collection commencement, number and frequency of waves, representativeness of the samples, and participating countries and territories. These differences, described above, imply that different analytical approaches are needed to study trends across these data sets. Specifically, in middle-to-late adolescence (age 15-24), we use the GWP to study population changes over time at the global- and regional-level, similar to past World Happiness Report editions.[40] The small n per country and wave (see Table A1.1 in Appendix 1) prevent us from conducting rigorous assessments at the country level. In contrast, in early-to-middle adolescence (age 10-15), conducting robust analyses at the global level and in most regions is not possible. Thus, we analyze PISA, HBSC, and Children’s Worlds data to examine trends in country means and discuss them in the context of regional trends when feasible.
Furthermore, in view of evidence of pre-COVID-19 trends in adolescent life satisfaction in multiple countries,[41] the further negative impact of the COVID-19 pandemic on children and young people’s subjective well-being,[42] and gender differences in adolescent subjective well-being trends,[43] our analyses emphasize the distinction between pre- and post-COVID-19 trends and examine gender differences whenever possible.
Global Levels and Trends in Middle-to-Late Adolescence (Age 15-24): Gallup World Poll
In our analysis of global trends using the GWP data, we assign countries equal weight in the analysis regardless of their population to replicate the main analysis presented in previous editions of the World Happiness Report for the adult population (e.g. Figure 2.2 in the 2022 edition).[44] Four main findings emerge (Figure 3.1A). First, global life satisfaction is higher at age 15-24 than at age 25 or above. Second, trends in middle-to-late adolescence (age 15-24) are similar to those observed in the adult population[45] and those aged 25 or above before the COVID-19 pandemic, with evidence of a moderate increase in global life satisfaction between 2006 and 2019. Third, the pandemic ended positive global trends. And fourth, there are no gender differences until 2013, but females aged 15-24 begin to report higher life satisfaction than males from 2014, although this gender gap has narrowed after the COVID-19 pandemic. Despite 95% confidence interval overlap in 2022 in Figure 3.1B, small gender differences are still observed in 2022 in the correlational analysis presented below in Table 3.1, which uses a slightly different (more global) sample of countries.
The use of slightly different samples of countries in different parts of the analysis is needed due to data limitations. In 2020, the number of countries where data were collected dropped significantly, especially in low-income countries (see Table A1.1 in Appendix 1). In the global trends in Figures 3.1A and 3.1B, we decided to use data only from the countries where data were collected in 2020 (i.e. consistent sample) to ensure that these trends represent a consistent sample of countries. The main caveat is that these global trends are somewhat less global as they exclude a number of low-income countries that were not sampled in 2020. For clarity, Figure A1.1 in Appendix 1 shows a comparisson of global trends using an inconsistent sample (i.e. considering all the countries with available data each year) and a consistent sample (i.e. considering only the countries where data were collected in 2020). The former shows a peak in 2020/21 due to the reduced number of low-income countries, where life satisfaction tends to be lower on average. In contrast to this approach, in the analysis of regional trends presented in the next section, we considered more adequate to use data from all the countries with available data each year as otherwise some regions (e.g. Sub-saharan Africa) would represent a small, far less representative sample of countries. The main caveat is that 2020-21 levels in certain low-income regions are to be interpreted with caution.
Figure 3.1A: Global levels and trends in life satisfaction from 2006 through 2022. Gallup World Poll (age 15-24 vs. age 25+)
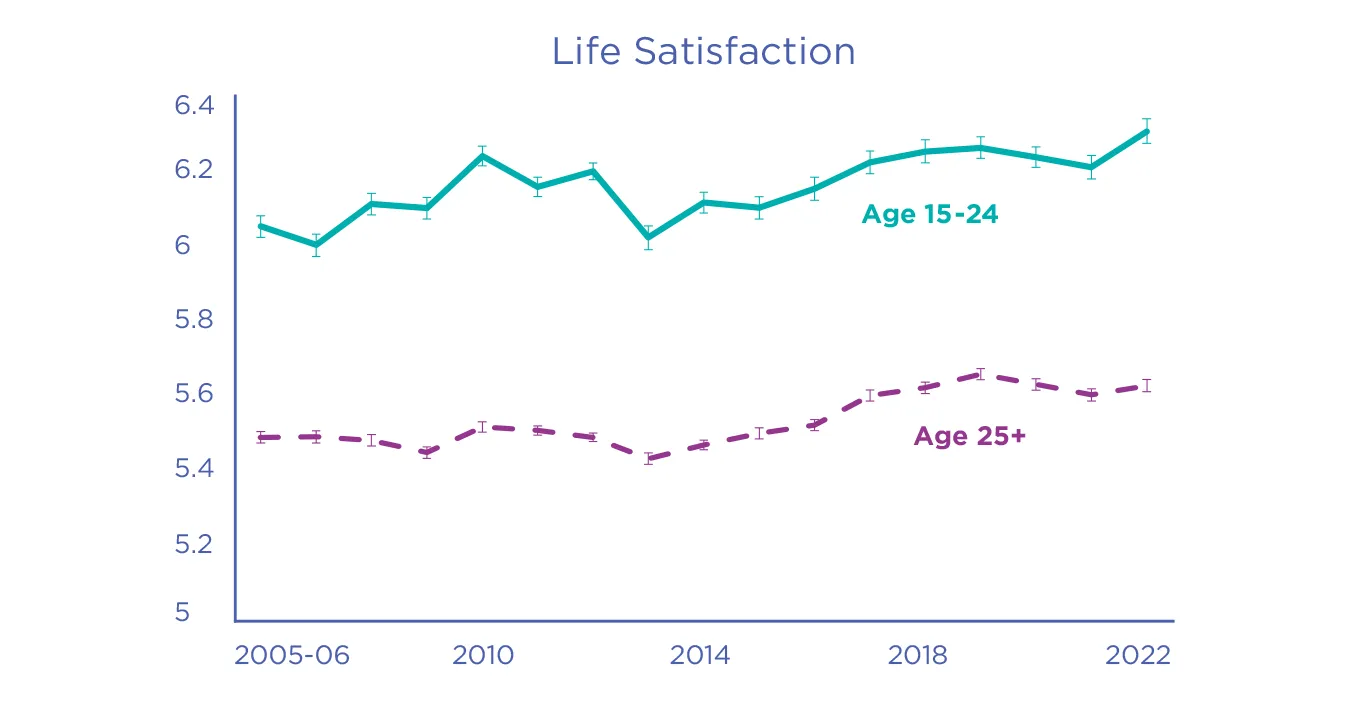
Figure 3.1B: Global levels and trends in life satisfaction from 2006 through 2022. Gallup World Poll (age 15-24), by gender
Regional Levels and Trends in Middle-to-Late Adolescence (Age 15-24): Gallup World Poll
Positive 2006 to 2022 global trends contrast with the large body of research reporting on international declines in youth subjective well-being in the last 10-15 years. Since declines have largely been documented in high-income, Western nations, it seems plausible that positive global trends mask regional and country trends moving in opposite directions, with increases in less surveyed regions compensating for potential declines in the most commonly surveyed regions. We now turn our attention to this issue by examining trends at regional and country levels. Using GWP data, we explore regional trends across the 10 world regions commonly examined in the World Happiness Report (see Figure 3.2A and Figure A1.2C, Figure 3.2B, Figure 3.2C, and Figure A1.3), revealing four key findings.
Positive Regional Trends
Positive trends emerged in various regions during the period 2006-2019, including the CIS, Central and Eastern Europe, Sub-Saharan Africa, Latin America and the Caribbean, and Southeast Asia. The former two regions exhibit more sustained trends, while the latter three display greater volatility. Comparatively, life satisfaction levels in 2022, when contrasted with 2019, remain similar in the CIS and Central and Eastern Europe, decrease in Sub-Saharan Africa, and slightly increase in Latin America and the Caribbean. There is also some evidence of a positive trend in East Asia, where life satisfaction is substantially higher in 2006 than in 2007 partly due to the non-inclusion of Mongolia in 2006, which drags down the East Asian series, and the non-inclusion of Taiwan in 2007, the happiest country in the region in 2006. When considering 2007 or 2008 as a reference instead, a positive pre-COVID-19 trend is observed in East Asia, followed by a further increase from 2019 to 2022. There is minimal evidence of gender differences throughout the series in the CIS, Central and Eastern Europe, Latin America and the Caribbean, and Southeast Asia. In contrast, females exhibit higher life satisfaction than males in East Asia during the period 2006-11 and in Sub-Saharan Africa during the period 2018-21.
Negative Regional Trends
Negative trends preceding the COVID-19 era (2006/07-2019) are evident in the Middle East and North Africa (MENA), South Asia, North America (Canada and the United States), Australia and New Zealand (ANZ), and Western Europe. In Western Europe, despite minimal 95% confidence interval overlap between 2006 and 2019 estimates, the declining trend is noticeable when comparing the periods 2006-12 and 2013-18. Regarding post-COVID-19 trends in these regions, life satisfaction levels in 2022 are similar to 2019 in all these regions, except for Western Europe, where a clear decline is apparent. However, the small sample size, leading to larger 95% confidence intervals, may obscure further declines in North America and ANZ. The 2020 increase in South Asia is explained by Afghanistan, which drags down South Asian levels throughout the entire series, especially in recent years (see Figure A1.2A in Appendix 1), and did not collect data in 2020. There are no gender differences in any of these regions, except for the MENA, which is the only world region where females consistently exhibit higher life satisfaction than males throughout the entire series.
Sub-Regional and Country Trends
Positive and negative trends at both sub-regional and country levels can be observed within specific regions. For instance, when separating North America from ANZ in Figure A1.3 in Appendix 1, despite limitations in sample size, we identify stable pre-COVID-19 trends from 2006 to 2019 and a post-COVID-19 decline in ANZ. In contrast, declining trends in North America appear to have started several years before the COVID-19 pandemic. Rigorous assessment of gender differences is hindered by a small sample size. It is conceivable that other intra-regional trends may exist in some of these large and diverse regions. Unfortunately, small sample size limitations involving this age group restrict our ability to thoroughly explore this question. However, in Figure A1.2A-B in Appendix 1, we present some instances of country-level trends in countries where previous evidence on adolescent subjective well-being is almost non-existent as these data are rarely collected in these nations. This includes some positive trends (Mongolia, Togo, Ivory Coast, and Gabon) and negative trends (Lebanon and Afghanistan).
Contrasts with Adult Trends
When comparing regional trends for those ages 15-24 and aged 25 or above, contrasting patterns are evident. These are illustrated in Figure A1.3 in Appendix 1, as well as in Figure 3.2C for some selected regions. The gap is notably large in the CIS, Latin America and the Caribbean, and especially in Central and Eastern Europe. Additionally, the gap varies over the years in some regions as shown in Figure 3.2C. In Sub-Saharan Africa, the gap widened from 2013 due to stable life satisfaction levels among those aged 25+ and positive trends among those aged 15-24. In contrast, the gap has narrowed in Western Europe for over a decade due to a moderate negative trend among adolescents (age 15-24) and a moderate positive trend among those aged 25 and above. In North America and ANZ, despite 95% confidence interval overlaps in some years, there is evidence of a potential reversal in this gap in recent years, suggesting that life satisfaction could now be higher among those aged 25+ than among those aged 15-24, which is not observed anywhere else. Separate analyses for North America and ANZ are shown in Figure A1.3 in Appendix 1, which suggest the same pattern in both regions – and especially in North America – despite 95% confidence interval overlaps likely due to small sample size. Further evidence of age-based differences in regional trends can be observed in Chapter 2.[46]
Figure 3.2A Regional levels and trends in life satisfaction from 2006 through 2022. Gallup World Poll (age 15-24)
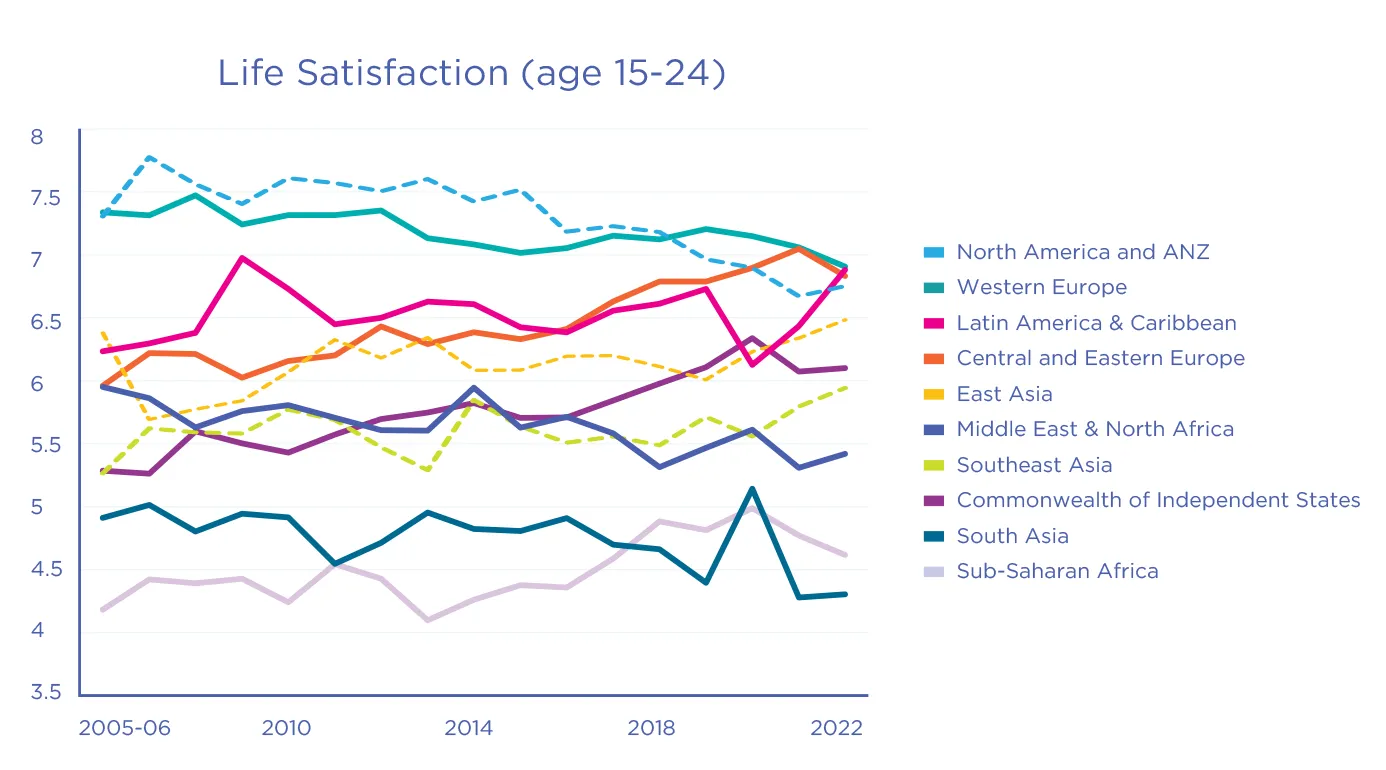
Figure 3.2B Regional levels and trends in life satisfaction from 2006 through 2022. Gallup World Poll (age 15-24), by gender
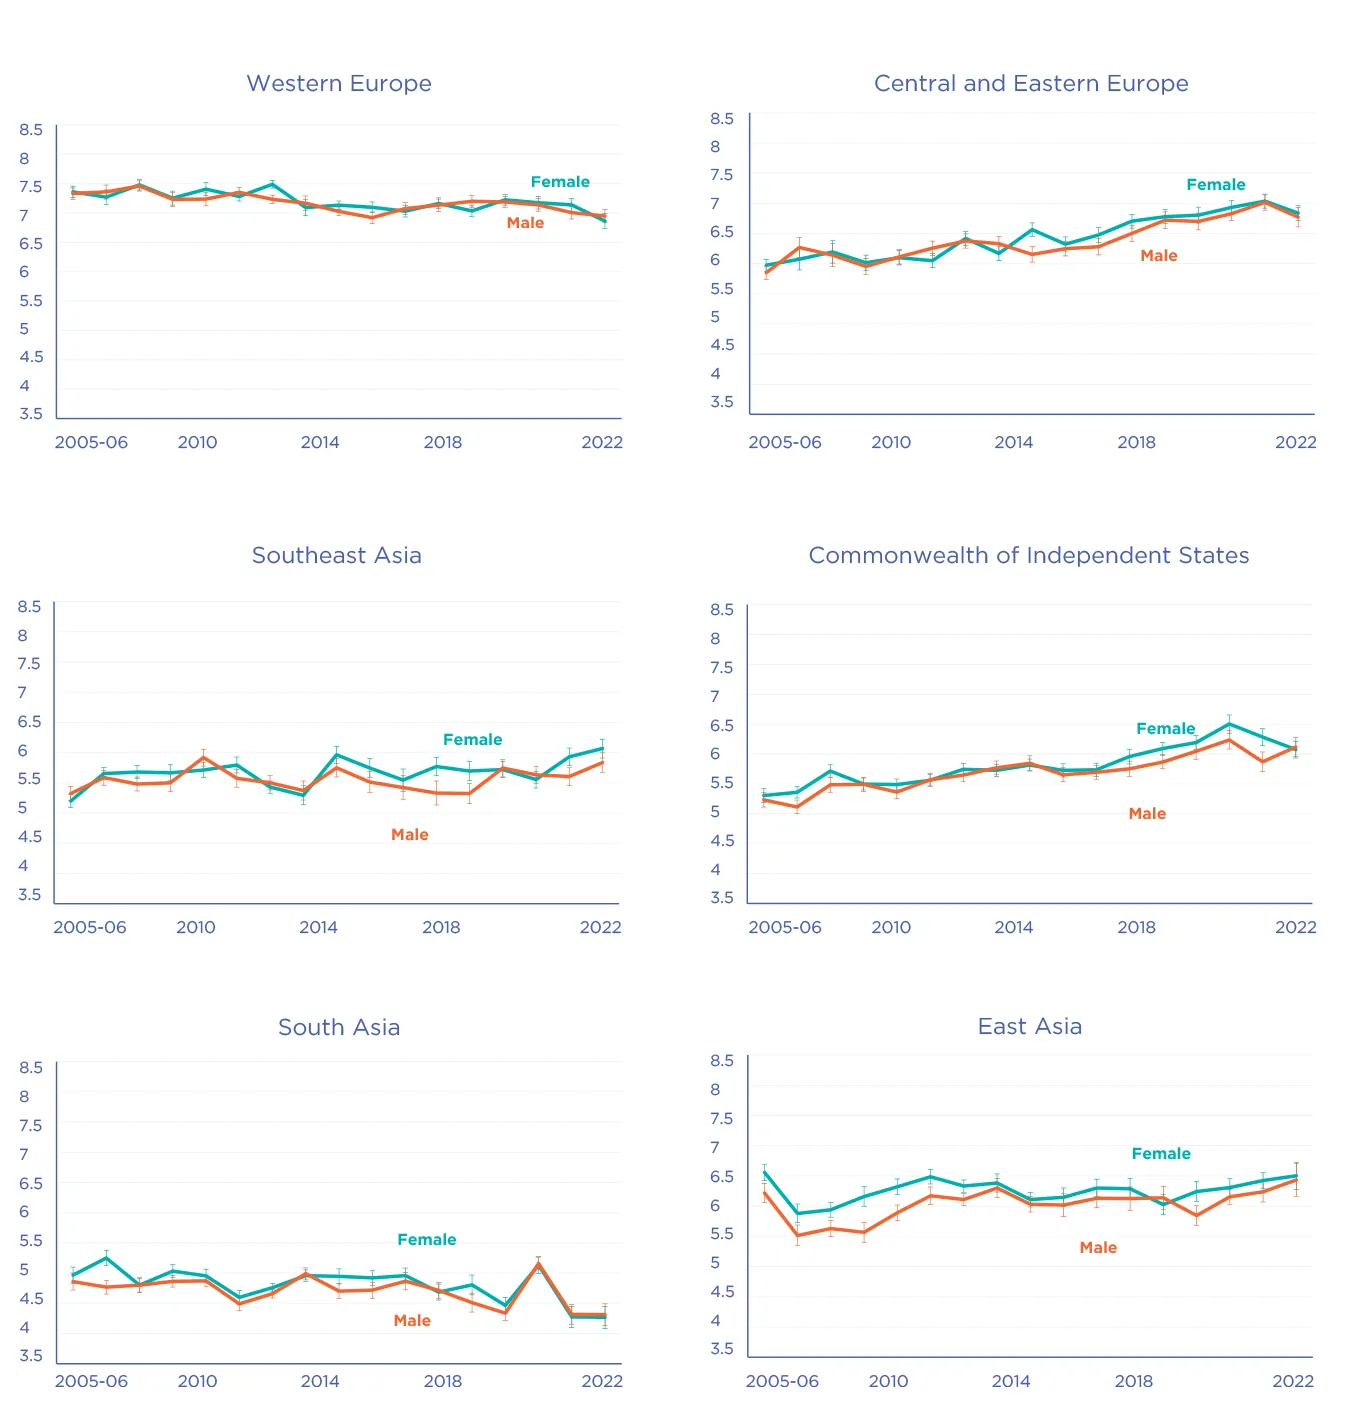
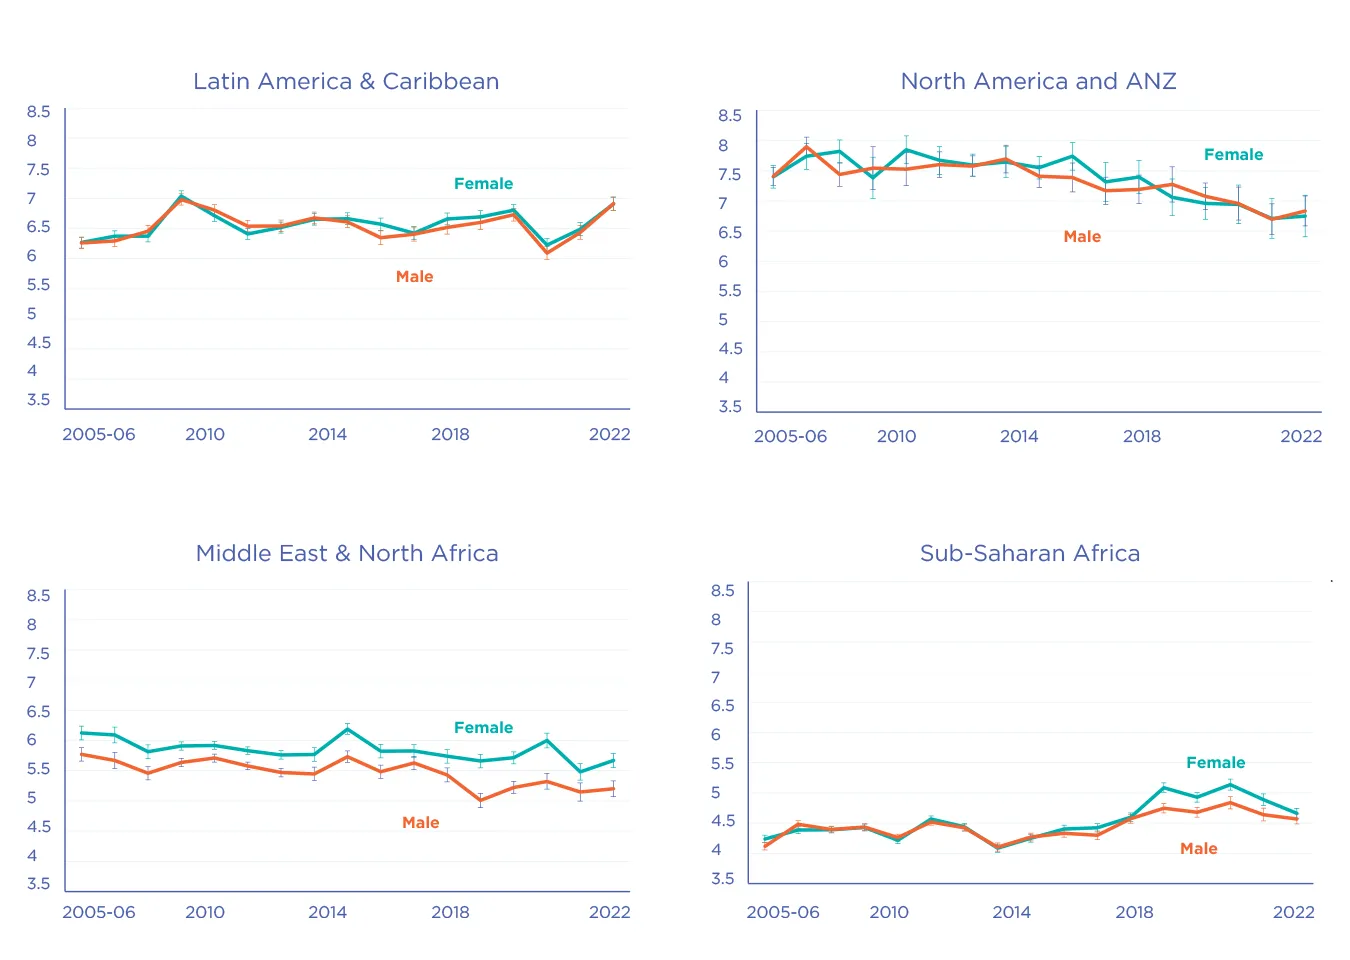
Figure 3.2C Regional levels and trends in life satisfaction from 2006 through 2022. Gallup World Poll (age 15-24 vs. age 25+)
Regional and Country Levels and Trends in Early-to-Middle Adolescence (Age 10-15). Data from PISA (Age 15), HBSC (Age 15, 13, 11), and Children’s Worlds (Age 12, 10)
In early-to-middle adolescence (age 10-15), global subjective well-being analyses are not possible due to limited data, mainly available in high-income Western countries. Consequently, we focus on regional and country trends, starting with those aged 15 and then shifting to age 10-13. Assessing regional trends is complex in PISA and HBSC, and unfeasible in Children’s Worlds, due to a limited number of participating countries and data gaps across waves. This limitation hampers the ability to make robust, evidence-based claims about regional trends. As a result, we turn to national trends, presented in Tables A1.2-A1.3 in Appendix 1, with discussions considering regional contexts where possible.
Age 15
From PISA and HBSC data, two key findings emerge. Firstly, both datasets reveal a significant post-COVID-19 decline in most countries with available data (mainly high-income, Western nations), with a more pronounced decrease among females. Notably, some countries in East Asia (Japan, Macau, Taiwan, and Hong Kong) show an increase, as indicated by PISA data, the only study collecting information in these regions. In HBSC, post-pandemic declines are noted in countries in North America (Canada), Western Europe, Central and Eastern Europe, and the CIS. In PISA, similar declines are observed across countries in these regions, as well as in the MENA, Latin America and the Caribbean, and Southeast Asia.
The second key finding at age 15 is the existence of mixed results concerning pre-COVID-19 trends, with notable disparities in country means and trends between PISA and HBSC. This is detailed in Table 3.1, and further explored in Appendix 2 (Table A2.1 and Figure A2.1). PISA indicates a pre-COVID-19 decline in most countries with data from 2015 and 2018, encompassing North America, Western Europe, Central and Eastern Europe, the CIS (Russia), Latin America and the Caribbean, MENA, and East Asia. This decline is more prominent among females, particularly in Central and East Europe, the CIS (Russia), Latin America and the Caribbean, and East Asia (see Table A1.2 in Appendix 1). Notably, the only pre-COVID-19 increase is observed in South Korea, though this masks a decline among females and an increase among males (see Table A1.2 in Appendix 1). This underscores the importance of assessing inequalities across distinct socio-demographic groups within countries, achievable only through nationally representative samples of the studied population group.
In contrast, in many countries where PISA indicates a pre-COVID-19 decline between 2015 and 2018, this decline is absent in HBSC data from 2013/14 to 2017/18. In Western Europe, HBSC data depicts a mixed picture, predominantly showing increases, while PISA consistently indicates declines. In Central and Eastern Europe, HBSC shows an overall increase and PISA an overall decline. In Russia, the only CIS country with comparable data, PISA indicates a decline, contrasting with HBSC’s absence of statistically significant changes (p<0.05). Discrepancies in country means, as seen in Table A2.1 and Figure A2.1 in Appendix 2, may explain disparities in trends. Although most differences in country means are minor, a few instances reveal surprisingly large gaps, with PISA estimates generally lower than HBSC estimates. In the U.K., for instance, HBSC 2017/18 shows life satisfaction levels almost 1 point higher than PISA 2018. Considering research evidence of subjective well-being declines throughout adolescence,[47] this discrepancy may partly be explained by the fact that HBSC surveys Year 10 students, while PISA, unlike most participating countries, surveys Year 11 students in England, Northern Ireland, Scotland and Wales. Appendix 2 delves into a detailed discussion of factors potentially explaining PISA-HBSC discrepancies, including variations in the life satisfaction measure, the year and month of data collection, survey context (e.g., right after/before taking an academic test in PISA), the target population (e.g. differences in the average age and school year), and sampling issues (notably exclusions in PISA).
In view of the above, it is evident that while there is robust evidence of post-COVID-19 declines in nearly all examined countries (with increases in most East Asian nations), caution is warranted when interpreting evidence on pre-COVID-19 trends at age 15, where contrasting results emerge in many countries. National studies, such as those in the U.K. outlined in Appendix 2, can provide further support to trends observed in international studies. However, in countries lacking alternative data, making definitive claims about trends during these years for this age group is challenging. Further research is essential to elucidate the factors contributing to these discrepancies.
| PISA (Age 15) | HBSC (Age 15) | |||||||||
|---|---|---|---|---|---|---|---|---|---|---|
| Country means | Trends | Country means | Trends | |||||||
| Country | 2015 | 2018 | 2022 | 2015-18 | 2018-22 | 2013/14 | 2017/18 | 2021/22 | 2013/14-17/18 | 2017/18-21/22 |
| Western Europe | ||||||||||
| Austria | 7.52 | 7.14 | 6.69 | -0.39 | -0.44 | 7.53 | 7.29 | 7.20 | -0.24 | non.sign. |
| Belgium | 7.49 | |||||||||
| Belgium (Flemish) | 6.89 | 7.48 | 7.46 | 0.60 | non.sign. | |||||
| Belgium (French) | 7.19 | 7.22 | 6.81 | non.sign. | -0.41 | |||||
| Cyprus | 6.99 | 7.45 | ||||||||
| Denmark* | 7.19 | 7.37 | 7.48 | 7.10 | non.sign. | -0.39 | ||||
| Finland | 7.89 | 7.61 | 7.41 | -0.28 | -0.21 | 7.47 | 7.46 | |||
| France | 7.63 | 7.19 | 6.77 | -0.44 | -0.42 | 6.97 | 7.28 | 6.91 | 0.32 | -0.37 |
| Germany | 7.35 | 7.02 | 6.51 | -0.33 | -0.51 | 7.05 | 7.33 | 7.12 | 0.28 | -0.21 |
| Greece | 6.91 | 6.99 | 6.62 | non.sign. | -0.37 | 7.16 | 7.04 | 6.70 | non.sign. | -0.34 |
| Greenland | 7.48 | 7.49 | 6.66 | non.sign. | -0.83 | |||||
| Iceland | 7.80 | 7.34 | 6.90 | -0.46 | -0.44 | 7.47 | 7.26 | 7.12 | -0.21 | -0.14 |
| Ireland* | 7.30 | 6.74 | 6.59 | -0.57 | -0.15 | 7.01 | 6.89 | 6.22 | non.sign. | -0.67 |
| Italy | 6.89 | 6.91 | 6.53 | non.sign. | -0.38 | 6.95 | 7.11 | 6.55 | 0.16 | -0.55 |
| Luxembourg | 7.38 | 7.04 | -0.34 | 7.01 | 7.35 | 7.10 | 0.33 | -0.24 | ||
| Malta | 6.24 | 7.11 | 6.71 | 6.48 | -0.40 | -0.23 | ||||
| Netherlands* | 7.83 | 7.50 | 7.29 | -0.33 | -0.21 | 7.36 | 7.33 | 6.90 | non.sign. | -0.43 |
| Norway | 7.54 | 7.48 | 7.05 | non.sign. | -0.43 | |||||
| Portugal | 7.36 | 7.13 | 7.06 | -0.24 | non.sign. | 6.99 | 7.35 | 7.05 | 0.36 | -0.29 |
| Spain | 7.42 | 7.35 | 6.88 | non.sign. | -0.46 | 7.30 | 7.64 | 6.77 | 0.34 | -0.87 |
| Sweden | 6.91 | 6.83 | 7.10 | 6.80 | 0.27 | -0.30 | ||||
| Switzerland | 7.72 | 7.38 | 7.06 | -0.34 | -0.31 | 7.54 | 7.34 | 6.99 | -0.19 | -0.35 |
| U.K.* | 6.98 | 6.16 | 6.07 | -0.81 | non.sign. | |||||
| U.K. (England) | 6.94 | 6.12 | 6.01 | -0.82 | non.sign. | 6.81 | 7.11 | 6.51 | 0.30 | -0.60 |
| U.K. (Northern Ireland) | 7.24 | 6.58 | 6.50 | -0.67 | non.sign. | |||||
| U.K. (Scotland) | 7.17 | 6.25 | 6.48 | -0.92 | 0.23 | 7.14 | 7.03 | 6.66 | non.sign. | -0.37 |
| U.K. (Wales) | 7.13 | 6.45 | 6.16 | -0.68 | -0.29 | 6.93 | 7.09 | 6.61 | 0.16 | -0.48 |
| Average: | 7.37 | 6.94 | 6.69 | -0.51 | -0.31 | 7.17 | 7.25 | 6.90 | 0.15 | -0.43 |
| Central and Eastern Europe | ||||||||||
| Albania | 8.01 | 7.71 | 7.56 | 8.14 | non.sign. | 0.58 | ||||
| Bulgaria | 7.42 | 7.15 | 7.04 | -0.26 | non.sign. | 7.43 | 7.59 | 7.10 | 0.16 | -0.49 |
| Croatia | 7.90 | 7.69 | 7.37 | -0.22 | -0.32 | 7.49 | 7.72 | 7.57 | 0.23 | -0.15 |
| Czech Republic | 7.05 | 6.91 | 6.56 | -0.14 | -0.36 | 6.99 | 7.43 | 7.26 | 0.44 | -0.17 |
| Estonia | 7.50 | 7.19 | 6.91 | -0.31 | -0.28 | 7.33 | 7.35 | 6.95 | non.sign. | -0.40 |
| Hungary | 7.17 | 7.12 | 7.21 | non.sign. | non.sign. | 7.09 | 7.14 | 6.99 | non.sign. | non.sign. |
| Kosovo | 7.87 | |||||||||
| Latvia* | 7.37 | 7.16 | 6.76 | -0.21 | -0.40 | 7.06 | 7.00 | 6.73 | non.sign. | -0.27 |
| Lithuania | 7.86 | 7.61 | 7.14 | -0.26 | -0.47 | 7.47 | 6.95 | -0.52 | ||
| Montenegro | 7.75 | 7.69 | 7.52 | non.sign. | -0.16 | |||||
| North Macedonia | 7.65 | 7.11 | 7.82 | 7.42 | 0.70 | -0.39 | ||||
| Poland | 7.18 | 6.74 | 6.26 | -0.44 | -0.49 | 6.80 | 7.03 | 6.20 | 0.23 | -0.84 |
| Romania | 7.53 | 7.61 | 7.94 | 7.76 | 0.32 | -0.18 | ||||
| Serbia | 7.48 | 7.85 | 7.89 | non.sign. | ||||||
| Slovakia | 7.47 | 7.22 | 7.02 | -0.25 | -0.20 | 7.06 | 7.36 | 6.00 | 0.29 | -1.35 |
| Slovenia | 7.17 | 6.86 | 6.61 | -0.32 | -0.25 | 7.41 | 7.45 | 7.08 | non.sign. | -0.36 |
| Average: | 7.44 | 7.21 | 7.18 | -0.27 | -0.33 | 7.26 | 7.48 | 7.15 | 0.34 | -0.38 |
| CIS | ||||||||||
| Armenia | 8.19 | 8.06 | 8.15 | non.sign. | non.sign. | |||||
| Azerbaijan | 7.83 | |||||||||
| Baku (Azerbaijan) | 6.80 | |||||||||
| Georgia | 7.62 | 7.57 | ||||||||
| Kazhastan | 8.41 | 8.18 | 7.97 | -0.21 | ||||||
| Kyrgyzstan | 7.95 | |||||||||
| Republic of Moldova | 7.01 | 7.87 | 7.85 | 7.70 | non.sign. | -0.15 | ||||
| Russia | 7.76 | 7.32 | -0.44 | 6.94 | 6.92 | non.sign. | ||||
| Tajikistan | 8.00 | |||||||||
| Ukraine | 7.31 | 7.34 | non.sign. | |||||||
| Uzbekistan | 8.20 | |||||||||
| Average: | 7.76 | 7.32 | 7.61 | -0.44 | 7.58 | 7.68 | 7.95 | -0.18 | ||
| North America and ANZ | ||||||||||
| Canada | 7.18 | 6.98 | 6.63 | -0.19 | -0.36 | |||||
| New Zealand* | 6.27 | |||||||||
| U.S.* | 7.36 | 6.75 | -0.60 | |||||||
| Average: | 7.36 | 6.75 | 6.27 | -0.60 | 7.18 | 6.98 | 6.63 | -0.19 | -0.36 | |
| Middle East and North Africa | ||||||||||
| Israel | 7.56 | 7.47 | non.sign. | |||||||
| Jordan | 6.77 | |||||||||
| Morocco | 6.76 | |||||||||
| Qatar | 7.41 | 6.84 | 6.77 | -0.56 | non.sign. | |||||
| Saudi Arabia | 7.36 | |||||||||
| Tunisia | 6.90 | |||||||||
| Turkey | 6.12 | 5.62 | 4.90 | -0.50 | -0.72 | 6.09 | ||||
| United Arab Emirates | 7.30 | 6.88 | 6.85 | -0.42 | non.sign. | |||||
| Average: | 6.93 | 6.45 | 6.57 | -0.49 | -0.72 | 7.56 | 6.78 | |||
| Latin America and the Caribbean | ||||||||||
| Argentina | 6.69 | |||||||||
| Brazil | 7.59 | 7.05 | 6.85 | -0.53 | -0.21 | |||||
| Chile | 7.37 | 7.03 | 6.41 | -0.34 | -0.62 | |||||
| Colombia | 7.88 | 7.62 | 6.96 | -0.27 | -0.66 | |||||
| Costa Rica | 8.21 | 7.96 | 7.32 | -0.25 | -0.64 | |||||
| Dominican Republic | 8.50 | 8.09 | 7.44 | -0.41 | -0.65 | |||||
| El Salvador | 7.40 | |||||||||
| Guatemala | 7.72 | |||||||||
| Jamaica* | 5.83 | |||||||||
| Mexico | 8.27 | 8.11 | 7.26 | -0.16 | -0.85 | |||||
| Panama* | 7.04 | |||||||||
| Paraguay | 7.32 | |||||||||
| Peru | 7.50 | 7.31 | 6.37 | -0.19 | -0.94 | |||||
| Uruguay | 7.70 | 7.54 | 7.03 | -0.16 | -0.50 | |||||
| Average: | 7.88 | 7.59 | 6.97 | -0.29 | -0.63 | |||||
| East Asia | ||||||||||
| China (B-S-J-G) | 6.83 | |||||||||
| Hong Kong* | 6.48 | 6.27 | 6.49 | -0.20 | 0.22 | |||||
| Japan | 6.80 | 6.18 | 6.76 | -0.62 | 0.58 | |||||
| Macau | 6.59 | 6.07 | 6.41 | -0.52 | 0.34 | |||||
| Mongolia | 7.20 | |||||||||
| South Korea | 6.36 | 6.52 | 6.36 | 0.15 | -0.16 | |||||
| Taiwan | 6.59 | 6.52 | 6.85 | non.sign. | 0.33 | |||||
| Average: | 6.61 | 6.31 | 6.68 | -0.30 | 0.26 | |||||
| Southeast Asia | ||||||||||
| Brunei Darussalam | 5.86 | |||||||||
| Cambodia | 7.65 | |||||||||
| Indonesia | 7.22 | |||||||||
| Malaysia | 7.04 | 6.63 | -0.40 | |||||||
| Philiphines | 6.97 | |||||||||
| Thailand | 7.71 | 7.64 | 7.12 | non.sign. | -0.51 | |||||
| Vietnam | 7.35 | |||||||||
| Average: | 7.71 | 7.34 | 6.97 | -0.46 | ||||||
Note: Countries marked with an asterisk (*) should exercise caution when interpreting estimates, as they may not fully meet one or more PISA sampling standards
Age 10-13
Unlike PISA, HBSC collects data from younger adolescents aged 13 and 11, enabling an examination of longer-term trends starting from 2001/02. Table A1.3 and Figure A1.4 in Appendix 1 show stability in most countries and sustained pre-pandemic trends in some regions. Canada, the only North American country with data throughout the series, exhibits a continuous negative trend predating the pandemic, persisting into 2022, primarily driven by a decrease among females (see Figure A1.4 in Appendix 1). Males in Canada experience a negative trend affecting only 15-year-olds post-COVID-19, while females endure a prolonged negative trend impacting those aged 13 and 15 for over a decade before the pandemic, as well as those aged 11 after the pandemic. Negative pre-pandemic trends (2005/06-17/18) are also observed in the MENA countries Turkey and Israel. Conversely, sustained pre-pandemic positive trends are noted across several HBSC waves in countries in Central and Eastern Europe, including Croatia, Latvia, and Estonia. The picture is more mixed in the CIS and Western Europe. Lastly, the post-pandemic decline observed in those aged 15 is mirrored in those aged 13 and 11, affecting all regions with available data, including North America (Canada), Western Europe, and Central and Eastern Europe. This decline is prevalent across most countries surveyed in 2017/18 and 2021/22, with a more substantial impact on females and older age groups.
Moving to younger children and adolescents, trend analyses in Children’s Worlds (age 12, 10) are not feasible due to the data limitations explained earlier. However, country-level estimates by survey wave and gender, presented in Table A1.5 in Appendix 1, suggest a decline in most participating countries following the COVID-19 pandemic.

Current Global State of Child and Adolescent Well-Being
Providing an overview of the current global state of child and adolescent subjective well-being in the post-pandemic world is imperative given the widespread post-COVID-19 decline in life satisfaction, along with age-related and geographic patterns and the earlier-discussed data limitations. Country means in life satisfaction across age groups, studies, and countries/territories are outlined in Tables 2.A-J (alphabetically ordered within each of the 10 world regions) and Tables A1.6A-D in Appendix 1 (countries ranked by GDP).
Middle-to-Late Adolescence (Age 15-24): Gallup World Poll
There are notable regional differences in life satisfaction in middle-to-late adolescence, with Israel, parts of Central and Eastern Europe (Croatia, Serbia, Lithuania, Romania), and Northern Europe reporting the highest levels and Sub-Saharan Africa and South Asia recording the lowest in the GWP (age 15-24). The poor performance in South Asia is mostly driven by the extremely low life satisfaction reported by adolescents in Afghanistan. All this is consistent with adult data, with the exception of the cited Central and Eastern European countries, which are found much lower in the adult ranking, and North America, ANZ, and Western Europe, where adult life satisfaction is much higher compared to other regions.[48]
Early-to-Middle Adolescence (Age 10-15): PISA, HBSC, and Children’s Worlds
The main observation is the limited number of countries collecting subjective well-being data in early-to-middle adolescence, primarily high-income Western nations (although Table A2.1 in Appendix 2 indicates increased participation from lower-income countries in recent years, notably in PISA 2022). In the available data, regional variations are evident. PISA 2022 data reveal the highest life satisfaction in Central and Eastern Europe (particularly in the Balkans), and the CIS, with the lowest in East Asia, North America, and ANZ, and MENA. HBSC data, primarily focused on Europe, North America and the CIS, indicates highest life satisfaction levels in the Balkans and CIS countries, and lowest in North America (Canada) and specific European nations like Ireland, the U.K., Italy, Malta, Poland, and Slovakia. HBSC and Children’s Worlds data also show that regional and country differences decrease in younger children and adolescents.
| GWP | PISA | HBSC | CW | ||||
|---|---|---|---|---|---|---|---|
| 2020/22 | 2022 | 2021/22 | 2021/22 | 2021/22 | 2020/22 | 2020/22 | |
| Age 15-24 | Age 15 | Age 15 | Age 13 | Age 11 | Age 12-13 | Age 10-11 | |
| Austria | 7.34 | 6.69 | 7.20 | 7.70 | 8.36 | ||
| Belgium | 6.95 | 8.05 | 8.27 | ||||
| Belgium (Flemish) | 7.46 | 7.78 | 8.05 | ||||
| Belgium (French) | 6.81 | 7.20 | 7.80 | ||||
| Cyprus | 6.88 | 7.45 | 7.99 | 8.46 | 9.28 | ||
| Denmark | 7.45 | 7.19 | 7.10 | 7.32 | 7.76 | ||
| Finland | 7.41 | 7.41 | 7.46 | 7.66 | 8.13 | 8.69 | 8.78 |
| France | 6.83 | 6.77 | 6.91 | 7.16 | 7.68 | ||
| Germany | 6.58 | 6.51 | 7.12 | 7.50 | 8.17 | 7.41 | 8.11 |
| Greece | 6.66 | 6.62 | 6.70 | 7.09 | 8.43 | ||
| Greenland | 6.66 | 6.78 | 6.98 | ||||
| Iceland | 7.76 | 6.90 | 7.12 | 7.28 | 7.79 | ||
| Ireland | 7.08 | 6.59 | 6.22 | 6.87 | 7.73 | ||
| Italy | 6.71 | 6.53 | 6.55 | 7.16 | 7.55 | 8.71 | 9.13 |
| Luxembourg | 7.12 | 7.10 | 7.46 | 8.12 | |||
| Malta | 6.69 | 6.24 | 6.48 | 7.00 | 7.81 | ||
| Netherlands | 7.30 | 7.29 | 6.90 | 7.22 | 7.95 | ||
| Norway | 7.28 | 7.05 | 7.24 | 7.67 | |||
| Portugal | 6.83 | 7.06 | 7.05 | 7.54 | 8.21 | ||
| Spain | 6.46 | 6.88 | 6.77 | 7.13 | 8.25 | ||
| Spain (Catalonia only) | 8.18 | 8.88 | |||||
| Sweden | 7.24 | 6.91 | 6.80 | 6.91 | 7.83 | ||
| Switzerland | 7.06 | 6.99 | 7.21 | 7.95 | |||
| U.K. (England) | 6.01 | 6.51 | 6.89 | 7.37 | |||
| U.K. (North Ireland) | 6.50 | ||||||
| U.K. (Scotland) | 6.48 | 6.66 | 6.97 | 7.64 | |||
| U.K. (Wales) | 6.16 | 6.61 | 7.09 | 7.70 | 7.76 | 8.52 | |
| U.K. | 6.92 | 6.07 | |||||
| GWP | PISA | HBSC | CW | ||||
|---|---|---|---|---|---|---|---|
| 2020/22 | 2022 | 2021/22 | 2021/22 | 2021/22 | 2020/22 | 2020/22 | |
| Age 15-24 | Age 15 | Age 15 | Age 13 | Age 11 | Age 12-13 | Age 10-11 | |
| Albania | 6.51 | 8.01 | 8.14 | 8.67 | 9.18 | 8.51 | 9.16 |
| Bosnia and Herzegovina | 6.88 | ||||||
| Bulgaria | 6.29 | 7.04 | 7.10 | 7.34 | 7.64 | ||
| Croatia | 7.51 | 7.37 | 7.57 | 7.91 | 8.47 | 8.50 | 9.03 |
| Czech Republic | 7.17 | 6.56 | 7.26 | 7.51 | 8.04 | ||
| Estonia | 6.79 | 6.91 | 6.95 | 7.26 | 7.91 | 8.00 | 8.53 |
| Hungary | 7.03 | 7.21 | 6.99 | 7.33 | 7.92 | ||
| Kosovo | 6.94 | 7.87 | |||||
| Latvia | 6.86 | 6.76 | 6.73 | 7.06 | 7.64 | ||
| Lithuania | 7.39 | 7.14 | 6.95 | 7.21 | 7.71 | ||
| Montenegro | 6.56 | 7.52 | |||||
| North Macedonia | 6.58 | 7.65 | 7.42 | 7.79 | 8.42 | ||
| Poland | 6.55 | 6.26 | 6.20 | 6.28 | 7.06 | ||
| Romania | 7.62 | 7.53 | 7.76 | 8.06 | 8.67 | 9.00 | 9.09 |
| Serbia | 7.53 | 7.48 | 7.89 | 8.30 | 8.84 | ||
| Slovak Republic | 6.70 | 7.02 | 6.00 | 6.28 | 6.91 | ||
| Slovenia | 7.17 | 6.61 | 7.08 | 7.34 | 8.05 | ||
| GWP | PISA | HBSC | CW | ||||
|---|---|---|---|---|---|---|---|
| 2020/22 | 2022 | 2021/22 | 2021/22 | 2021/22 | 2020/22 | 2020/22 | |
| Age 15-24 | Age 15 | Age 15 | Age 13 | Age 11 | Age 12-13 | Age 10-11 | |
| Armenia | 6.16 | 8.15 | 8.52 | 8.80 | |||
| Azerbaijan | 5.34 | ||||||
| Azerbaijan (Baku) | 6.80 | ||||||
| Georgia | 6.08 | 7.62 | |||||
| Kazakhstan | 6.52 | 8.41 | 7.97 | 8.30 | 8.49 | ||
| Kyrgyz Republic | 6.15 | 7.95 | 8.30 | 8.60 | |||
| Moldova, Republic of | 6.94 | 7.01 | 7.70 | 8.02 | 8.47 | ||
| Russian Federation | 6.34 | 7.76 | |||||
| Tajikistan | 5.61 | 8.00 | 8.07 | 8.10 | |||
| Ukraine | 6.23 | ||||||
| Uzbekistan | 5.98 | 8.20 | |||||
| GWP | PISA | HBSC | CW | ||||
|---|---|---|---|---|---|---|---|
| 2020/22 | 2022 | 2021/22 | 2021/22 | 2021/22 | 2020/22 | 2020/22 | |
| Age 15-24 | Age 15 | Age 15 | Age 13 | Age 11 | Age 12-13 | Age 10-11 | |
| China, People's Republic of | 6.05 | ||||||
| Hong Kong S.A.R. of China | 5.33 | 6.49 | 7.74 | 7.55 | |||
| Japan | 6.51 | 6.76 | |||||
| Macao S.A.R. of China | 6.41 | ||||||
| Mongolia | 5.94 | 7.20 | |||||
| South Korea | 6.59 | 6.36 | 7.36 | ||||
| Taiwan Province of China | 7.12 | 6.85 | 7.80 | 7.91 | |||
| GWP | PISA | HBSC | CW | ||||
|---|---|---|---|---|---|---|---|
| 2020/22 | 2022 | 2021/22 | 2021/22 | 2021/22 | 2020/22 | 2020/22 | |
| Age 15-24 | Age 15 | Age 15 | Age 13 | Age 11 | Age 12-13 | Age 10-11 | |
| Argentina | 6.55 | 6.69 | |||||
| Bolivia | 6.23 | ||||||
| Brazil | 6.46 | 6.85 | |||||
| Chile | 6.65 | 6.41 | 7.76 | 8.44 | |||
| Colombia | 5.95 | 6.96 | 8.82 | ||||
| Costa Rica | 6.93 | 7.32 | |||||
| Dominican Republic | 6.38 | 7.44 | |||||
| Ecuador | 6.40 | ||||||
| El Salvador | 6.72 | 7.40 | |||||
| Guatemala | 6.65 | 7.72 | |||||
| Honduras | 6.47 | ||||||
| Jamaica | 5.81 | 5.83 | |||||
| Mexico | 6.77 | 7.26 | |||||
| Nicaragua | 6.84 | ||||||
| Panama | 6.94 | 7.04 | |||||
| Paraguay | 6.18 | 7.32 | |||||
| Peru | 6.23 | 6.37 | |||||
| Uruguay | 6.77 | 7.03 | |||||
| Venezuela | 5.59 | ||||||
| GWP | PISA | HBSC | CW | ||||
|---|---|---|---|---|---|---|---|
| 2020/22 | 2022 | 2021/22 | 2021/22 | 2021/22 | 2020/22 | 2020/22 | |
| Age 15-24 | Age 15 | Age 15 | Age 13 | Age 11 | Age 12-13 | Age 10-11 | |
| Algeria | 5.54 | 8.15 | 7.94 | ||||
| Bahrain | 6.52 | ||||||
| Egypt | 4.38 | ||||||
| Iran | 5.46 | ||||||
| Iraq | 5.61 | ||||||
| Israel | 7.98 | 8.58 | 8.78 | ||||
| Jordan | 4.86 | 6.77 | |||||
| Kuwait | 7.39 | ||||||
| Lebanon | 2.93 | ||||||
| Libya | 5.93 | ||||||
| Morocco | 5.34 | 6.76 | |||||
| Palestine, State of | 5.25 | ||||||
| Qatar | 6.77 | ||||||
| Saudi Arabia | 6.45 | 7.36 | |||||
| Tunisia | 4.87 | ||||||
| Turkish Republic of Northern Cyprus | 5.32 | ||||||
| Türkiye, Republic of | 5.07 | 4.90 | 7.28 | 8.11 | |||
| United Arab Emirates | 6.54 | 6.85 | |||||
| Yemen | 3.93 | ||||||
| GWP | PISA | HBSC | CW | ||||
|---|---|---|---|---|---|---|---|
| 2020/22 | 2022 | 2021/22 | 2021/22 | 2021/22 | 2020/22 | 2020/22 | |
| Age 15-24 | Age 15 | Age 15 | Age 13 | Age 11 | Age 12-13 | Age 10-11 | |
| Australia | 6.94 | ||||||
| Canada | 6.70 | 6.63 | 7.00 | 7.54 | |||
| New Zealand | 6.85 | 6.27 | |||||
| U.S. | 6.61 | ||||||
| GWP | PISA | HBSC | CW | ||||
|---|---|---|---|---|---|---|---|
| 2020/22 | 2022 | 2021/22 | 2021/22 | 2021/22 | 2020/22 | 2020/22 | |
| Age 15-24 | Age 15 | Age 15 | Age 13 | Age 11 | Age 12-13 | Age 10-11 | |
| Afghanistan | 1.96 | ||||||
| Bangladesh | 4.72 | 7.55 | 7.66 | ||||
| India | 4.33 | ||||||
| Nepal | 5.67 | ||||||
| Pakistan | 5.17 | ||||||
| Sri Lanka | 4.80 | 8.22 | 7.96 | ||||
| GWP | PISA | HBSC | CW | ||||
|---|---|---|---|---|---|---|---|
| 2020/22 | 2022 | 2021/22 | 2021/22 | 2021/22 | 2020/22 | 2020/22 | |
| Age 15-24 | Age 15 | Age 15 | Age 13 | Age 11 | Age 12-13 | Age 10-11 | |
| Brunei Darussalam | 5.86 | ||||||
| Cambodia | 4.62 | 7.65 | |||||
| Indonesia | 5.81 | 7.22 | 8.12 | 8.46 | |||
| Lao P.D.R. | 4.90 | ||||||
| Malaysia | 6.41 | 6.63 | |||||
| Myanmar | 4.40 | ||||||
| Philippines | 6.12 | 6.97 | |||||
| Singapore | 6.45 | ||||||
| Thailand | 6.75 | 7.12 | |||||
| Vietnam | 6.06 | 7.35 | |||||
| GWP | PISA | HBSC | CW | ||||
|---|---|---|---|---|---|---|---|
| 2020/22 | 2022 | 2021/22 | 2021/22 | 2021/22 | 2020/22 | 2020/22 | |
| Age 15-24 | Age 15 | Age 15 | Age 13 | Age 11 | Age 12-13 | Age 10-11 | |
| Benin | 4.52 | ||||||
| Botswana | 4.09 | ||||||
| Burkina Faso | 4.98 | ||||||
| Cameroon | 5.36 | ||||||
| Chad | 4.56 | ||||||
| Comoros | 4.01 | ||||||
| Congo | 5.78 | ||||||
| Congo, Democratic Republic of the | 3.37 | ||||||
| Côte d'Ivoire | 5.32 | ||||||
| Eswatini | 3.84 | ||||||
| Ethiopia | 4.48 | ||||||
| Gabon | 5.52 | ||||||
| Gambia | 4.52 | ||||||
| Ghana | 4.84 | ||||||
| Guinea | 5.05 | ||||||
| Kenya | 4.78 | ||||||
| Lesotho | 3.80 | ||||||
| Liberia | 4.73 | ||||||
| Madagascar | 4.17 | ||||||
| Malawi | 3.83 | ||||||
| Mali | 4.47 | ||||||
| Mauritania | 4.61 | ||||||
| Mauritius | 6.03 | ||||||
| Mozambique | 5.32 | ||||||
| Namibia | 5.05 | ||||||
| Niger | 4.63 | ||||||
| Nigeria | 5.28 | ||||||
| Senegal | 5.06 | ||||||
| Sierra Leone | 3.19 | ||||||
| South Africa | 5.75 | 8.60 | 8.86 | ||||
| Tanzania | 4.15 | ||||||
| Togo | 4.34 | ||||||
| Uganda | 4.69 | ||||||
| Zambia | 4.09 | ||||||
| Zimbabwe | 3.77 | ||||||
PISA 2022 data reveals the highest life satisfaction for individuals aged 15 is found in Central and Eastern Europe.
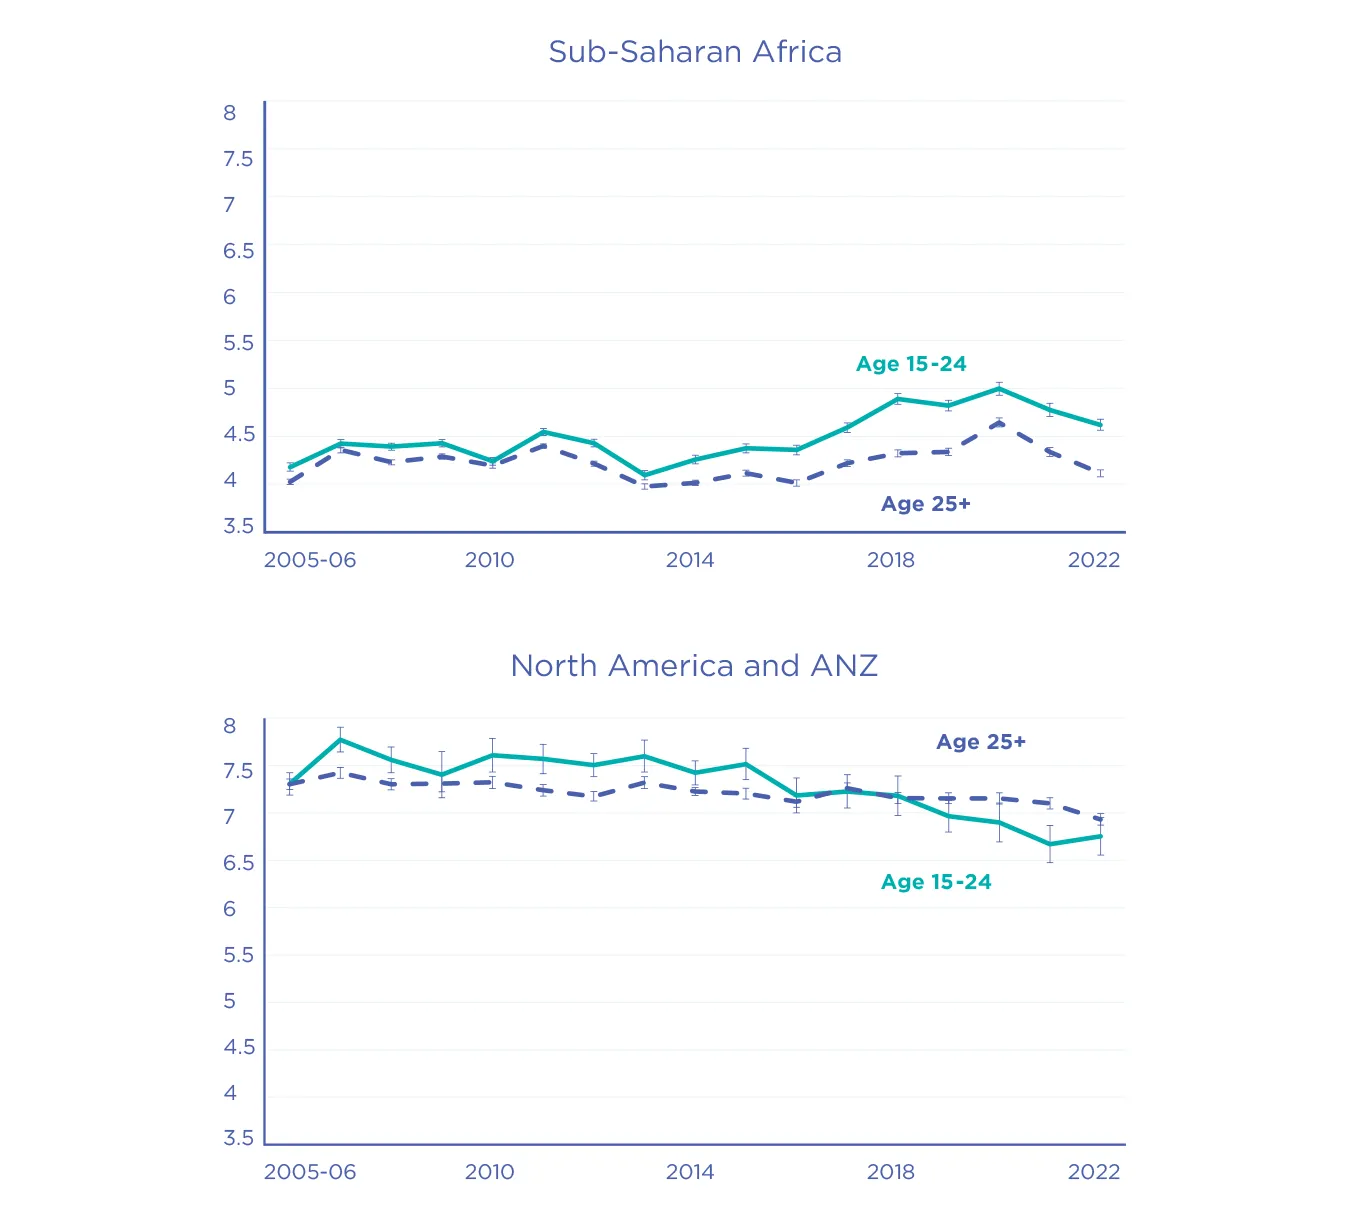
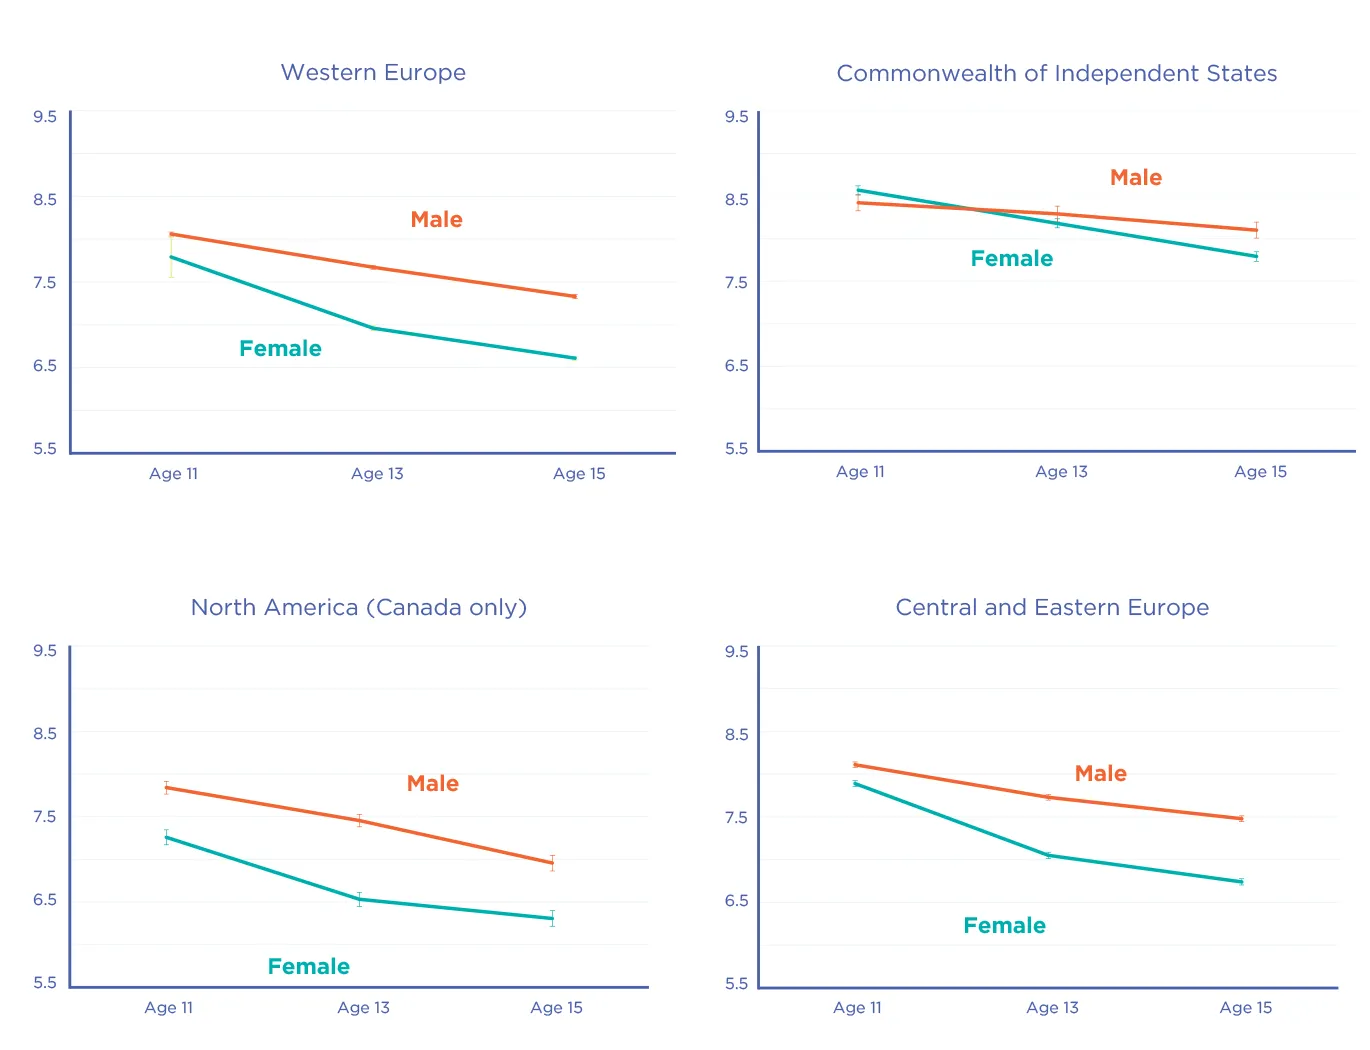
Finally, it is also evident that younger children and adolescents consistently report higher life satisfaction than their older counterparts, illustrating an early start to the decline from childhood to middle age. Figure 3.3 shows the decline from age 11 to 15 in HBSC data, indicating a larger decline among females, particularly between age 11 and 13, with some variation across regions. Including data from the other three studies, Table 3.2A-J shows that this declining pattern is evident from age 10 to 15 in all countries, and continues into late adolescence (age 15-24) in most of them. The decline from age 10-12 to age 15-24 is remarkably larger in lower-income countries. This is observed in the lowest-income countries with available data, including Algeria, Turkey, Bangladesh, Sri Lanka, Tajikistan, Indonesia and South Africa. In contrast, in many Western countries (mostly in Europe), there is no further decline at age 15-24, and in some of them (notably, Iceland, Ireland, Sweden, and the U.K.), there seems to be higher life satisfaction at age 15-24 than at age 15.
Figure 3.3: Life satisfaction declines throughout early-to-middle adolescence (HBSC 2021/22), by gender
Adolescent Well-Being Inequalities and Correlates
To offer a more comprehensive view of the current global state of child and adolescent well-being, we enhance the preceding analyses on subjective well-being levels and trends by presenting a series of correlational analyses. Using data from the GWP and PISA, we examine subjective well-being inequalities across socio-demographic groups, and life domain factors explaining variation in adolescent subjective well-being. Inequalities across gender and age have been explored in some of the previous analyses, and further insights are provided in the correlational analysis presented in this section.
Middle-to-Late Adolescence (Age 15-24): Gallup World Poll
The correlational analysis of GWP data (age 15-24) considers all the countries where data were collected in 2022, and delves into socio-demographic factors (gender, rural/urban residence, household income, and country GDP) and 10 items on satisfaction with different aspects of life.[49] This analysis is summarized in Table 3.3, which shows the results for Model 1 (socio-demographic factors only) and Model 2 (10 satisfaction items, controlling for socio-demographic factors). Separate analyses by GDP levels are available in Tables A1.7.A-D in Appendix 1.
Inequalities Across Socio-Demographic Groups
On average, females report a life satisfaction 0.09 points higher than males (Table 3.3), and this gap is larger in lower-income countries, with no gender differences noted in high-income countries (Tables A1.7.A-D in Appendix 1). Similarly, life satisfaction is -0.10 points lower in rural communities compared to urban ones, and this gap is larger in lower-income countries, with no differences observed in high-income countries. Additionally, compared to those in the first (lowest) quintile of the country’s household income distribution, those in the third, fourth, and fifth (highest) quintiles report 0.16, 0.30, and 0.43 points higher life satisfaction respectively, with smaller effects in high-income countries than lower-income ones. Moreover, compared to residents of high-income countries, those in upper-middle-, lower-middle-, and low-income countries report -0.63, -1.74, and -2.91 points lower life satisfaction respectively. This association can also be visualized in Table A1.7.A-D in Appendix 1, which ranks all countries by GDP.
Chapter 2 of this World Happiness Report presents a similar analysis for those aged 15-29, including a broader range of correlates. This analysis suggests that the relative importance of household income diminishes when controlling for other important factors.[50]
| Model 1 | Model 2 | ||||||
|---|---|---|---|---|---|---|---|
| β | S.E. | β | S.E. | ||||
| Socio-demographic factors | |||||||
| Gender (ref.: male) | |||||||
| Female | 0.09 | ** | 0.03 | 0.12 | *** | 0.03 | |
| Urban/rural residence (ref.: urban residence) | |||||||
| Rural residence | -0.10 | ** | 0.03 | -0.08 | ** | 0.03 | |
| Household income (ref.: lowest 20%) | |||||||
| Second 20% | 0.04 | 0.04 | 0.03 | 0.05 | |||
| Middle 20% | 0.16 | *** | 0.04 | 0.11 | * | 0.05 | |
| Fourth 20% | 0.30 | *** | 0.04 | 0.24 | *** | 0.05 | |
| Highest 20% | 0.43 | *** | 0.05 | 0.33 | *** | 0.05 | |
| Country's economic development (ref.: high-income countries) | |||||||
| Upper middle-income countries | -0.63 | *** | 0.04 | -0.40 | *** | 0.04 | |
| Lower middle-income countries | -1.74 | *** | 0.04 | -1.40 | *** | 0.04 | |
| Low-income countries | -2.91 | *** | 0.05 | -2.07 | *** | 0.06 | |
| 10 satisfaction items | |||||||
| Satisfied with the public transportation system in your city/area | 0.08 | * | 0.03 | ||||
| Satisfied with the roads and highways in your city/area | -0.04 | 0.03 | |||||
| Satisfied with the quality of air in your city/area | 0.03 | 0.04 | |||||
| Satisfied with the quality of water in your city/area | 0.02 | 0.04 | |||||
| Satisfied with the availability of affordable housing in your city/area | 0.20 | *** | 0.03 | ||||
| Satisfied with the education system/schools in your city/area | 0.07 | 0.04 | |||||
| Satisfied with the quality healthcare in your city/area | 0.24 | *** | 0.04 | ||||
| Satisfied with opportunities to meet people and make friends in your city/area | 0.28 | *** | 0.04 | ||||
| Satisfied with the city/area where you live | 0.37 | *** | 0.04 | ||||
| Satisfied with your standard of living (things you can buy and do) | 1.42 | *** | 0.04 | ||||
Note: Significance Levels: * 0.05 ** 0.01 *** 0.001. Model 1: R²= 0.15; N=25,877, p<.001. Model 2: R²= 0.25; N=22699, p<.001
Satisfaction with Different Aspects of Life
Life satisfaction tends to be higher amongst those who report being satisfied with: standards of living, the city or region they reside in, opportunities for social interactions and friendships in their city or area, accessibility of quality healthcare services in their city or area, availability of good and affordable housing in their city or area, and the public transportation system. Satisfaction with standards of living has – by far – the most significant impact on life satisfaction, emphasizing the role of material well-being. In contrast, statistically significant associations (p<0.05) are not found for the quality of roads, air quality, water quality, and the quality of the schools and education system within their city or area.
Separate analyses by GDP levels reveal additional insights:
- In upper-middle-income countries, there are no statistically significant associations (p<0.05) between life satisfaction and satisfaction with the public transportation system and access to quality healthcare.
- In lower-middle-income countries, there are no statistically significant associations (p<0.05) between life satisfaction and satisfaction with the public transportation system, access to quality healthcare and opportunities to meet people and make friends. In contrast, there is an association with satisfaction with the education system/schools.
- In low-income countries, there are no statistically significant associations (p<0.05) between life satisfaction and satisfaction with the public transportation system, opportunities to meet people and make friends, and the city/area of residence. In contrast, there is an association with satisfaction with water quality and the education system/schools.
Middle Adolescence (Age 15): PISA
Similar to the GWP correlational analysis, the correlational analysis of PISA 2022 data (age 15) examines inequalities across socio-demographic groups (gender, rural/urban residence, household possessions, and economic development of the country of residence) and 10 items on satisfaction with different aspects of life. The results are presented in Table 4. Model 1 examines socio-demographic factors in the 74 countries and territories with available life satisfaction data, and Model 2 examines the 10 satisfaction items – controlling for socio-demographic factors – in the 13 countries where these data were collected (Brazil, Hong Kong, Hungary, Ireland, Macau, Mexico, the Netherlands, New Zealand, Panama, Saudi Arabia, Slovenia, Spain, and the United Arab Emirates).
Inequalities Across Socio-Demographic Groups
On average, life satisfaction is -0.78 points lower among females than males. This contrasts with findings at age 15-24 showing higher life satisfaction among females than males since 2014 globally (see Figure 3.1B and Table 3.4). This could largely be explained by the focus on mostly high-income, Western countries in the available data. Indeed, GWP results at age 15-24 show no gender differences (p<0.05) in high-income countries (Table A1.7A in Appendix 1). Evidence from HBSC (Table A1.4 and Figure A1.4 in Appendix 1), and Children’s Worlds (Table A1.5 in Appendix 1) from mainly high-income Western countries shows that the gender gap is rarely observed at age 10-11, tends to become noticeable from age 12, and widens at age 13-15.
Similarly, life satisfaction is lower in more populated areas compared to more rural areas. The GWP analysis at age 15-24 reveals the opposite pattern globally, but no statistically significant differences in high-income countries (Table A1.7A in Appendix 1). This suggests again that these differences could partly be explained by the different nature of countries collecting PISA and GWP data.
Moreover, compared to those in the lowest quintile of the household possessions distribution within each country, those in higher quintiles report increasingly higher life satisfaction. By contrast, there is a negative association between the level of economic development in the country of residence (log GDP)[51] and life satisfaction. This association is also illustrated in Table A1.7 in Appendix 1, which ranks all countries by GDP. This table shows a distinct pattern at age 15-24, when a clear positive association is evident, compared to age 10-15, when no clear association is observed, arguably due in part to the nature of participating countries in each study.
| Model 1 | Model 2 | ||||||
|---|---|---|---|---|---|---|---|
| β | S.E. | β | S.E. | ||||
| Socio-demographic factors | |||||||
| Gender (ref.: male) | |||||||
| Female | -0.78 | *** | 0.01 | -0.51 | *** | 0.01 | |
| Urban/rural residence (ref.: population of +10 million people) | |||||||
| 1 million to 10 million | 0.02 | 0.03 | -0.09 | * | 0.04 | ||
| 100,000 to 1 million | 0.26 | *** | 0.03 | -0.02 | 0.04 | ||
| 15,000 to 100,000 | 0.34 | *** | 0.03 | 0.02 | 0.04 | ||
| 3,000 to 15,000 | 0.55 | *** | 0.03 | 0.07 | 0.04 | ||
| Less than 3,000 | 0.62 | *** | 0.03 | 0.05 | 0.05 | ||
| Household possessions (ref.: lowest 20%) | |||||||
| Second 20% | 0.17 | *** | 0.02 | 0.20 | *** | 0.02 | |
| Middle 20% | 0.27 | *** | 0.02 | 0.28 | *** | 0.03 | |
| Fourth 20% | 0.39 | *** | 0.02 | 0.40 | *** | 0.04 | |
| Highest 20% | 0.50 | *** | 0.02 | 0.49 | *** | 0.05 | |
| Log GDP | -0.04 | *** | 0.01 | ||||
| 10 satisfaction items | |||||||
| Satisfied with your health | 0.57 | *** | 0.02 | ||||
| Satisfied with the way you look | 1.02 | *** | 0.02 | ||||
| Satisfied with what you learn at school | 0.13 | *** | 0.02 | ||||
| Satisfied with the friends you have | -0.05 | * | 0.03 | ||||
| Satisfied with the neighbourhood you live in | 0.24 | *** | 0.02 | ||||
| Satisfied with all the things you have | 0.02 | 0.03 | |||||
| Satisfied with how you use your time | 0.56 | *** | 0.02 | ||||
| Satisfied with the relationship with your parents/guardians | 1.01 | *** | 0.02 | ||||
| Satisfied with your relationships with your teachers | -0.11 | *** | 0.02 | ||||
| Satisfied with your life at school | 0.88 | *** | 0.02 | ||||
Note: Significance Levels: * 0.05 ** 0.01 *** 0.001. Model 1 (43 countries): R²= 0.03; N=295,345, p<.001. Model 2 (13 countries): R²= 0.25; N=92,666, p<.001. GDP= Gross Domestic Product per capita, constant prices. We follow World Bank Analytical Classifications (GNI per capita in US$; Atlas methodology (World Bank, n.d.)), to categorize countries as high-income, upper middle-income, lower middle-income and low-income.
Satisfaction with Different Aspects of Life
The 10 satisfaction items analysis in Model 2 shows that, compared to those who report not being satisfied, life satisfaction is higher among those who report being satisfied with their body image (1.02 points), their relationship with their parents (1.01 points), their life at school (0.88 points), their health (0.57 points), their use of their time (0.56 points), their neighborhood (0.24 points), and what they learn at school (0.13 points). Interestingly, differences are not statistically significant (p<0.05) for satisfaction with the things you have (material well-being), and a small negative association is found for satisfaction with the friends you have (-0.05 points) and relationships with teachers (-0.11 points). These results (especially those involving a small effect size) are to be interpreted with caution given the small number of countries considered in Model 2 due to data availability limitations.

Discussion
The analyses presented in this chapter have provided insights into the state of child and adolescent subjective well-being and the key data limitations affecting the field. These are discussed below. We also present a discussion on the necessary steps to collectively enhance the well-being of children and adolescents globally.
Main Findings
Life Satisfaction Levels
In the post-pandemic world, the life satisfaction of those aged 10-15 tends to be the highest in Central and Eastern Europe (notably in the Balkans), and the CIS, and the lowest in East Asia, North America and ANZ, and MENA. However, it is important to note that, for this age group, data is only available in some world regions, including mostly high-income countries. Cross-country inequalities among younger adolescents (age 10-15) are smaller compared to older adolescents (age 15-24). For those aged 15-24, global data is available and the highest life satisfaction is observed in Israel, Northern Europe and some Central and Eastern European countries, and the lowest in Sub-Saharan Africa and South Asia. This contrasts with the adult ranking in Chapter 2, where most Central and Eastern European countries rank much lower, and life satisfaction in North America and ANZ and Western Europe is much higher compared to other regions. These differences have been shaped by distinct trends for these age groups observed in the last 15 years.
Trends in Middle-to-Late Adolescence
In middle-to-late adolescence (age 15-24), there was a positive 2006-2019 global trend in life satisfaction, in line with adult trends, which ended with the pandemic, in line with adult trends. Global trends mask regional trends – which, at the same time, mask sub-regional and national trends – that do not always match adult trends. Our results suggest that the widely reported pre-COVID-19 declines in young people’s subjective well-being observed across countries[52] may concentrate in those regions that tend to collect data systematically (e.g. North America and Western Europe), as well as in other regions such as the MENA and South Asia. However, when young people from (almost) the whole world are considered, these negative trends start to look less global as positive trends are observed in Sub-Saharan Africa, Central and Eastern Europe, the CIS, Latin America and the Caribbean, and Southeast Asia. As a result of these trends, while life satisfaction for those aged 15-24 and adults was the highest in Western Europe, and North America and ANZ in the late 2000s, in 2022 this held true only for adults, while for those aged 15-24 life satisfaction was on par and not higher compared to Central and Eastern Europe, and Latin America and the Caribbean.
Trends in Early-to-Middle Adolescence
In early-to-middle adolescence (age 10-15), assessments of global trends are not possible as data is only available mostly in high-income, Western countries. PISA, HBSC and Children’s Worlds data show substantial post-COVID-19 declines in almost all of the countries analyzed, which tend to be more severe among females and older adolescents. However, as opposed to declines in (mostly) Western countries, increases are observed in most East Asian countries at age 15.
While there seems to be robust evidence regarding post-pandemic trends, evidence is more mixed with regards to pre-pandemic trends, including some discrepancies between HBSC and PISA at age 15. Contrasting results emerge in many Western European nations and almost all the Central and Eastern European countries examined at age 15 in the 5-6 years preceding the COVID-19 pandemic. These discrepancies highlight the need for caution when interpreting trends for this age group only on the basis of evidence from international studies in the absence of further evidence from national studies (see Appendix 2). This speaks of the need to address shortcomings in the available international data, which is discussed in the next section. Despite discrepancies affecting some countries and regions, there is consistent evidence in others, including declines in North America (Canada, and the U.S.), some Western European countries (e.g. Austria, Iceland, Ireland, and the Netherlands), and two MENA countries (Turkey and Israel), which are largely driven by female declines. Canada emerges as the country with the longest female decline in the available data, which started in the early 2010s, and is still ongoing. In contrast, HBSC data (age 11, 13, 15) shows evidence of positive trends in some countries in Central and Eastern Europe (Estonia, Latvia, Croatia) in the 2000s and early 2010s.
Age Decline
Consistent with existing literature,[53] we find life satisfaction declines from childhood through adolescence into adulthood. This decline is more pronounced among females and in lower-income countries. From age 15 to 24, declines are not observed in multiple European countries, and increases are observed in some of them. Moreover, although adults tend to report lower life satisfaction than adolescents, the gap between those aged 15-24 and those 25 and older is contracting in Western Europe and reversing in North America, juxtaposed with a widening gap in Sub-Saharan Africa.
Gender Differences
Also consistent with prior research,[54] we observe no gender differences at age 10-11, but females start to report lower life satisfaction than males at around age 12 and the gap further expands from age 13 to 15. This gender gap has widened after the pandemic. In contrast, when moving from analyses in early-to-middle adolescence (age 10-15) in mostly high-income, Western countries, to global analyses in middle-to-late adolescence (age 15-24), a distinct picture emerges. Our global analyses show no gender differences between 2006 and 2013 at age 15-24, but that females started reporting higher life satisfaction than males from 2014. The global gender gap has narrowed after the pandemic. Regional analyses at age 15-24 show that gender differences are small or non-existent in most world regions during most years in the 2006-2022 series, with the notable exception of the MENA, where females consistently report higher life satisfaction than males. In 2022, this gender gap favoring females over males was more pronounced in lower-income countries, with no gender differences observed in high-income countries.
Females start to report lower life satisfaction than males at around age 12 and the gap further expands between age 13 to 15
Other Inequalities
Beyond the gender, age and geographic inequalities discussed above, the correlational analysis in middle-to-late adolescence (age 15-24) shows higher life satisfaction in urban areas than in rural areas. However, this is not observed in high-income countries or in early-to-middle adolescence (age 15), where data was collected mainly in high-income nations.
We also find that the higher the country’s GDP the higher the average life satisfaction in middle-to-late adolescence (age 15-24), which contrasts with findings in early-to-middle adolescence (age 10-15), where no association is observed at age 10-12, and a paradoxical negative association is found at age 15.[55] Recent evidence suggests this contradiction may stem from limited data collection in non-high-income countries in early-to-middle adolescence because when adolescents from these countries are considered, a positive association is observed in middle adolescence (age 15-17). Notably, this association is stronger in lower-income countries for adolescents but this pattern reverses with age in adulthood.[56]
Correlates of Life Satisfaction
The correlational analyses presented in this chapter using GWP data in middle-to-late adolescence (age 15-24) underscore the significance of socio-economic indicators not only at the national level (GDP) but also at the household (household income quintile within each country) and individual levels (satisfaction with living standards). Among the life domain factors examined, satisfaction with living standards emerges as the strongest correlate of life satisfaction by far. Moreover, we find differences across levels of economic development again. For instance, satisfaction with schools and the education system is positively associated with life satisfaction in lower middle- and low-income countries, but not in upper middle- and high-income countries. The correlational analysis in middle adolescence (age 15) highlights the importance of body image, relationships with parents, school life, health, and time-use to the life satisfaction of 15-year-olds, although this is only reflective of the 13 countries that collected these data in PISA 2022, which limits the generalizability of these results.
Several of the above findings underscore disparities when considering adolescents from lower-income countries and regions with limited subjective well-being data, challenging prevailing literature largely derived from high-income, Western countries. Given that the majority of our understanding of child and adolescent subjective well-being stems from data in these more affluent Western contexts, the implications are substantial for global initiatives aimed at enhancing the well-being of children and young people worldwide. These and other data limitations are discussed next.
Addressing Limitations in International Data on Child and Adolescent Well-Being
The existing data limitations represent a substantial challenge in generating evidence-based insights to advance the well-being of children and adolescents on a global scale. Despite substantial efforts in the past 15 years to enhance data availability across countries, a considerable gap persists in global data for children and adolescents compared to adults. This chapter has shone some light on the key gaps and limitations in international data, together with some other data issues (see Appendix 2) that warrant attention. The main limitations are:
- The absence of a common subjective well-being measure. Establishing at least one identical subjective well-being item in each survey would facilitate data across children’s, adolescents’, and adults’ subjective well-being. This becomes crucial in the absence of large international panel surveys exploring well-being from childhood to adulthood globally.
- The limited number of subjective well-being measures. Since the existing surveys, on the whole, are not primarily subjective well-being focused – with the exception of Children’s Worlds – they tend to only include one aspect of subjective well-being, predominantly overall life satisfaction, usually measured using a single item. It would be advantageous to have the capacity to explore affect and eudaimonia in the child and adolescent surveys to give us a more nuanced understanding of how the three components interact in global samples, comparable with what exists in the literature on adults. It is also important to improve data availability on drivers of subjective well-being to be able to rigorously examine what explains variations in subjective well-being levels and trends – and among whom.
- The ages of the samples. No one dataset spans across the range of middle-childhood (when self-report measures become reliable, at around age 8) to late-adolescence (at the upper bound, age 24), nor into adulthood. Moreover, data from representative samples in late adolescence (age 16-24) is lacking. This means that comparing across ages and exploring how subjective well-being changes globally over time is limited to using multiple datasets, which are not consistent and comparable.
- Data in early-to-middle adolescence (age 10-15) is only available in high- and upper-middle-income countries, mostly in the Western World. This is largely due to the fact that gaining access to children in lower-income countries is challenging, expensive, and time consuming for researchers.[57] School is a common point of access for researchers to survey children across the world, and children in lower-income countries have less access to schooling and are less likely to attend for a myriad of reasons.[58] The findings in this chapter referring to early-to-middle adolescents (age 10-15), and those from the existing literature, largely represent what we find in high-income, and a few middle-income countries. As noted, there is recent evidence suggesting that, when adolescents from lower-income countries are considered, findings may contradict the existing literature from higher-income countries.[59] This is troubling, as it means that children and adolescents across the largest parts of the world, who arguably need the most support, are not represented in global samples, which prevent us from reaching a better understanding on how we can promote their well-being.
Promoting the Well-Being of Children and Adolescents Globally
It is evident that for younger populations international data collection and availability are lagging due to a variety of difficulties in collecting data from younger people. However, there is a global appetite for improving data collection and assessment to enhance child and adolescent well-being globally. This is being materialized in efforts in three main areas.
The widely reported negative trends in adolescent well-being in Western Europe and North America, supported by our analysis, contrast with positive pre-pandemic trends in regions like Sub-Saharan Africa and positive post-pandemic trends in East Asia
Addressing Shortcomings in International Data
The four data providers whose data has been used in this chapter have made huge efforts over the last decade in expanding the number of available measures (e.g. the OECD has included a well-being questionnaire in the last two editions of PISA), and the number of participating countries, including more non-Western non-high-income countries (e.g. in its latest wave, HBSC, which began to collect data in Central Asian countries in its latest wave, and has a global Linked Projects initiative which enables countries outside of Europe and North America to collect comparable data using a common protocol).[60] Beyond these four studies, there are some excellent initiatives making inroads at the international level with the collection of data from lower-income populations such as PISA for Development by the OECD;[61] and Multiple Indicator Cluster Surveys (MICS) by UNICEF.[62] In Europe, there is ongoing work to conduct the first cross-national birth cohort survey of child well-being through GUIDE (Growing Up In Digital Europe), supported by the Coordinate project.[63] This project is mobilizing researchers and organizations, fostering coordinated efforts to enhance the harmonization and accessibility of international survey data, specifically focusing on panel survey data for examining the well-being of children and young individuals as they grow up. This initiative will contribute significantly to a key longer-term goal in the field: obtaining more comparable longitudinal data across countries to enable more robust evidence on how to promote child and adolescent well-being.
Improving Current Approaches to Assess Child and Adolescent Well-Being Across Nations
Various international actors are leading the way on this issue. For example, the OECD has established a Child Well-Being Data Portal[64] with data from the major international surveys and a focus on inclusivity, with consideration of inequalities across relevant socio-demographic groups. Moreover, OECD’s WISE Centre is updating the ‘Guidelines on Measuring Subjective Well-being’, also among children and adolescents, with a call for considering broader and more globally inclusive measures.[65] Similarly, UNICEF Innocenti is expanding its work on child well-being in high-income nations to include the views and experiences of children living in lower-income countries, where this type of work is far more scarce.[66] Moreover, the World Health Organisation, in collaboration with the Partnership for Maternal, Newborn and Child Health and United Nations partners and together with the support of an Expert Consultative Group, is developing an adolescent well-being measurement approach for use at global, regional, and country levels, with an emphasis on existing data use and adolescent and youth engagement.[67] Apart from these well-known international actors, other organizations such as the Wellbeing for Planet Earth Foundation[68] are working to establish a more inclusive and global understanding of well-being by incorporating cross-cultural perspectives.
From Data to Action
At the international level, the OECD has recently published a report to facilitate the development of policies aimed at enhancing child well-being,[69] and UNICEF is working towards policy initiatives to promote child well-being.[70] At the national level, South Korea is a good from-data-to-action example. In its efforts to make children’s happiness a national priority, South Korea aims to integrate a child-centered perspective into all government policy by using insights into child and adolescent subjective well-being.[71] An important consideration is that initiatives such as this require effective inter-sectoral collaborations encompassing data collection, analysis, and evidence-based responses, which may be difficult to achieve at the national and international levels. In certain contexts, regional or local cooperation can be more feasible, particularly where regions and local authorities wield influence over crucial aspects of children’s lives, such as education and social services. A pioneering project that exemplifies the potential of such initiatives is #BeeWell, a youth-centered programme led by the University of Manchester, The Gregson Family Foundation and Anna Freud, initially launched in Greater Manchester, U.K., and now expanding to other locations in England. This programme brings together academic expertise, policy-makers, and hundreds of local organizations to make adolescents’ well-being everybody’s business. Utilizing data from the #BeeWell survey (co-produced with adolescents) and linked to data from other sources, it offers schools and local authorities personalized well-being dashboards and advice to facilitate evidence-based responses. #BeeWell provides valuable insights into the efficacy of bottom-up approaches for assessing and promoting child and adolescent well-being. While focused on a Western socio-cultural context, these insights can be applicable to regions and countries facing challenges in country-level initiatives, fostering progress across diverse parts of the world.
Conclusions
There is a growing interest in improving child and adolescent well-being globally. Despite notable progress in research and data availability over the past 15 years, along with recent ground-breaking initiatives at regional, national, and international levels, a significant data gap persists for children and adolescents compared to adults. These limitations prevent researchers from substantially improving our understanding of how to promote child and adolescent well-being worldwide.
This chapter outlines the crucial necessary next steps to address existing data limitations: the use of – at least one – standardized subjective well-being measure(s) across the available international studies, a broader age coverage from age 8 to late adolescence and into adulthood, and collecting data from more world regions, with particular attention to improving data collection in middle- and low-income countries.
The chapter aims to provide the most accurate picture of the global state of child and adolescent subjective well-being that is possible despite existing data limitations. The analysis reveals a nuanced picture: life satisfaction levels, trends, and correlates vary across age, gender, world regions, countries, and levels of economic development. Notably, the analysis suggests that shifting the focus from constantly surveyed high-income countries in the Western World reveals different patterns. For instance, the widely reported negative trends in adolescent subjective well-being (and related constructs) in Western Europe and North America, supported by our analysis, contrast with positive pre-pandemic trends in regions like Sub-Saharan Africa and positive post-pandemic trends in East Asia. These and other findings presented in this chapter underscore the importance of addressing data limitations to understand what drives positive and negative change – and among whom – in different parts of the world.
References
Anaya, L. M., & Zamarro, G. (2023). The role of student effort on performance in PISA: Revisiting the gender gap in achievement. Oxford Economic Papers, gpad018. https://doi.org/10.1093/oep/gpad018
Anders, J., Has, S., Jerrim, J. et al. Is Canada really an education superpower? The impact of non-participation on results from PISA 2015. Educ Asse Eval Acc 33, 229–249 (2021). https://doi.org/10.1007/s11092-020-09329-5
Andersson, C., & Sandgren Massih, S. (2023). PISA 2018: Did Sweden exclude students according to the rules? Assessment in Education: Principles, Policy & Practice, 30(1), 33–52. [https://doi.org/10.1080/0969594X.2023.2189566]
Arain, M., Haque, M., Johal, L., Mathur, P., Nel, W., Rais, A., Sandhu, R., & Sharma, S. (2013). Maturation of the adolescent brain. Neuropsychiatric Disease and Treatment, 9, 449–461. https://doi.org/10.2147/NDT.S39776
Atasever, U., Jerrim, J., & Tieck, S. (2023). Exclusion rates from international large-scale assessments: An analysis of 20 years of IEA data. Educational Assessment, Evaluation and Accountability. [https://doi.org/10.1007/s11092-023-09416-3]
Aymerich, M., Cladellas, R., Castelló, A., Casas, F., & Cunill, M. (2021). The Evolution of Life Satisfaction Throughout Childhood and Adolescence: Differences in Young People’s Evaluations According to Age and Gender. Child Indicators Research, 14(6), 2347–2369. [https://doi.org/10.1007/s12187-021-09846-9]
Azzopardi, P. S., Hearps, S. J. C., Francis, K. L., Kennedy, E. C., Mokdad, A. H., Kassebaum, N. J., Lim, S., Irvine, C. M. S., Vos, T., Brown, A. D., Dogra, S., Kinner, S. A., Kaoma, N. S., Naguib, M., Reavley, N. J., Requejo, J., Santelli, J. S., Sawyer, S. M., Skirbekk, V., … Patton, G. C. (2019). Progress in adolescent health and wellbeing: Tracking 12 headline indicators for 195 countries and territories, 1990–2016. The Lancet, 393(10176), 1101–1118. [https://doi.org/10.1016/S0140-6736(18)32427-9]
Ball, J., Grucza, R., Livingston, M., Ter Bogt, T., Currie, C., & De Looze, M. (2023). The great decline in adolescent risk behaviours: Unitary trend, separate trends, or cascade? Social Science & Medicine, 317, 115616. [https://doi.org/10.1016/j.socscimed.2022.115616]
Banks, J., & Smyth, E. (2015). ‘Your whole life depends on it’: Academic stress and high-stakes testing in Ireland. Journal of Youth Studies, 18(5), 598–616. [https://doi.org/10.1080/13676261.2014.992317]
Batalle, D., O’Muircheartaigh, J., Makropoulos, A., Kelly, C. J., Dimitrova, R., Hughes, E. J., Hajnal, J. V., Zhang, H., Alexander, D. C., Edwards, A. D., & Counsell, S. J. (2019). Different patterns of cortical maturation before and after 38 weeks gestational age demonstrated by diffusion MRI in vivo. NeuroImage, 185, 764–775. https://doi.org/10.1016/j.neuroimage.2018.05.046
Bedin, L. M., & Sarriera, J. C. (2014). Dyadic Analysis of Parent-Children Subjective Well-Being. Child Indicators Research, 7(3), 613–631. [https://doi.org/10.1007/s12187-014-9235-9]
Ben-Arieh, A. (2008). The Child Indicators Movement: Past, Present, and Future. Child Ind Res 1, 3–16 (2008). [https://doi.org/10.1007/s12187-007-9003-1]
Bevans, K. B., Riley, A. W., & Forrest, C. B. (2010). Development of the Healthy Pathways Child-Report Scales. Quality of Life Research, 19(8), 1195–1214. https://doi.org/10.1007/s11136-010-9687-4
Blakemore, S.-J. (2018). Avoiding Social Risk in Adolescence. Current Directions in Psychological Science, 27(2), 116–122. [https://doi.org/10.1177/0963721417738144]
Bradshaw, J. (2015). Subjective Well-Being and Social Policy: Can Nations Make Their Children Happier? Child Indicators Research, 8(1), 227–241. [https://doi.org/10.1007/s12187-014-9283-1]
Byrne, J., Day, E., & Raftree, L. (2021) The Case for Better Governance of Children’s Data: A Manifesto. UNICEF. New York.
Campbell, A. (1976). Subjective measures of well-being. American Psychologist, 31(2), 117–124. https://doi.org/10.1037/0003-066X.31.2.117
Campbell, O. L. K., Bann, D., & Patalay, P. (2021). The gender gap in adolescent mental health: A cross-national investigation of 566,829 adolescents across 73 countries. SSM - Population Health, 13, 100742. [https://doi.org/10.1016/j.ssmph.2021.100742]
Cantril, H. (1965). The pattern of human concerns. New Brunswick, NJ: Rutgers University Press
Casas, F. (2011). Subjective Social Indicators and Child and Adolescent Well-being. Child Indicators Research, 4(4), 555–575. [https://doi.org/10.1007/s12187-010-9093-z]
Casas, F. (2016). Children, Adolescents and Quality of Life: The Social Sciences Perspective Over Two Decades. In: Maggino, F. (eds) A Life Devoted to Quality of Life. Social Indicators Research Series, 60. https://doi.org/10.1007/978-3-319-20568-7_1
Casas, F., Coenders, G., González, M., Malo, S., Bertran, I., & Figuer, C. (2012). Testing the Relationship Between Parents’ and Their Children’s Subjective Well-Being. Journal of Happiness Studies, 13(6), 1031–1051. [https://doi.org/10.1007/s10902-011-9305-3]
Casas, F., & González, M. (2017). School: One world or two worlds? Children’s perspectives. Children and Youth Services Review, 80, 157–170. [https://doi.org/10.1016/j.childyouth.2017.06.054]
Casas, F., & González‐Carrasco, M. (2019). Subjective Well‐Being Decreasing With Age: New Research on Children Over 8. Child Development, 90(2), 375–394. [https://doi.org/10.1111/cdev.13133]
Casas, F., González‐Carrasco, M., & Luna, X. (2018). Children’s rights and their subjective well‐being from a multinational perspective. European Journal of Education, 53(3), 336–350. https://doi.org/10.1111/ejed.12294
Casas, F., González-Carrasco, M., Oriol, X., & Malo, S. (2022). Economic and Children’s Subjective Well-Being Indicators at the National Level in 35 Countries. *Child Indicators Research, 15(*5), 1539–1563. [https://doi.org/10.1007/s12187-022-09918-4]
Casas, F., Tiliouine, H., & Figuer, C. (2014). The Subjective Well-being of Adolescents from Two Different Cultures: Applying Three Versions of the PWI in Algeria and Spain. *Social Indicators Research, 115(*2), 637–651. [https://doi.org/10.1007/s11205-012-0229-z]
Cerna, L., Brussino, O., & Mezzanotte, C. (2023). Social and emotional skills (SES): Latest evidence on teachability and impact on life outcomes (OECD Education Working Papers 304; OECD Education Working Papers, Vol. 304). https://doi.org/10.1787/ba34f086-en
Chen, X., Cai, Z., He, J., & Fan, X. (2020). Gender Differences in Life Satisfaction Among Children and Adolescents: A Meta-analysis. Journal of Happiness Studies, 21(6), 2279–2307. [https://doi.org/10.1007/s10902-019-00169-9]
Clair, A. (2012). The Relationship Between Parent’s Subjective Well-Being and the Life Satisfaction of Their Children in Britain. Child Indicators Research, 5(4), 631–650. [https://doi.org/10.1007/s12187-012-9139-5]
Clark, A. E., Flèche, S., Layard, R., Powdthavee, N., & Ward, G. (2018). The Origins of Happiness: The Science of Well-Being over the Life Course. Princeton University Press. [https://doi.org/10.2307/j.ctvc77dgq]
Colom, M., & Rohloff, P. (2018). Cultural considerations for informed consent in paediatric research in low/middle-income countries: A scoping review. *BMJ Paediatrics Open, 2(*1), e000298. https://doi.org/10.1136/bmjpo-2018-000298
Cosma A., Abdrakhmanova, S., Taut, D., Schrijvers, K.,Catunda, C., & Schnohr, C. (2023). A focus on adolescent mental health and well- being in Europe, central Asia and Canada. Health Behaviour in School-aged Children international report from the 2021/2022 survey. Volume 1. Copenhagen: WHO Regional Office for Europe; 2023. Licence: CC BY-NC-SA 3.0 IGO.
Cosma, A., Stevens, G., Martin, G., Duinhof, E. L., Walsh, S. D., Garcia-Moya, I., Költő, A., Gobina, I., Canale, N., Catunda, C., Inchley, J., & De Looze, M. (2020). Cross-National Time Trends in Adolescent Mental Well-Being From 2002 to 2018 and the Explanatory Role of Schoolwork Pressure. *Journal of Adolescent Health, 66(*6), S50–S58. [https://doi.org/10.1016/j.jadohealth.2020.02.010]
Cummins, R. A. (1996). The domains of life satisfaction: An attempt to order chaos. Social Indicators Research, 38(3), 303–328. [https://doi.org/10.1007/BF00292050]
Cummins, R. A. (2016). The Theory of Subjective Wellbeing Homeostasis: A Contribution to Understanding Life Quality. In F. Maggino (Ed.), A Life Devoted to Quality of Life (Vol. 60, pp. 61–79). Springer International Publishing. https://doi.org/10.1007/978-3-319-20568-7_4
Cummins, R., & Gullone, E. (2000). Why we should not use 5-point Likert scales: The case for subjective quality of life measurement. Proceedings, Second International Conference on Quality of Life in Cities, 74–93.
Daly, M. (2022). Cross‐national and longitudinal evidence for a rapid decline in life satisfaction in adolescence. *Journal of Adolescence, 94(*3), 422–434. https://doi.org/10.1002/jad.12037
Deaton, A. (2008). Income, Health, and Well-Being around the World: Evidence from the Gallup World Poll. Journal of Economic Perspectives, 22(2), 53–72. [https://doi.org/10.1257/jep.22.2.53]
De Neve, J.-E., & Oswald, A. J. (2012). Estimating the influence of life satisfaction and positive affect on later income using sibling fixed effects. PNAS Proceedings of the National Academy of Sciences of the United States of America, 109(49), 19953–19958. https://doi.org/10.1073/pnas.1211437109
Department for Education. (2022). State of the nation 2021: Children and young people’s wellbeing. Department for Education.
Diener, E., Kahneman, D., & Helliwell, J. (2010). International Differences in Well-Being (1st ed.). Oxford University PressNew York. [https://doi.org/10.1093/acprof:oso/9780199732739.001.0001]
Diener, E., Lucas, R. E., & Oishi, S. (2002). Subjective well-being: The science of happiness and life satisfaction. In C. R. Snyder & S. J. Lopez (Eds.), Handbook of positive psychology (pp. 463–73). Oxford University Press.
Diener, E., & Suh, E. M. (Eds.). (2003). Culture and subjective well-being. MIT press.
Diener, E., Suh, E. M., Lucas, R. E., & Smith, H. L. (1999). Subjective well-being: Three decades of progress. Psychological Bulletin, 125(2), 276–302. [https://doi.org/10.1037/0033-2909.125.2.276]
Due, P., Eriksson, C., Torsheim, T., et al. (2019). Trends in high life satisfaction among adolescents in five Nordic countries 2002–2014*. Nordisk välfärdsforskning, 4*, 54–66. [https://doi.org/10.18261/issn.2464-4161-2019-02-03]
Elgar, F. J., Sen, A., Gariépy, G., Pickett, W., Davison, C., Georgiades, K., Hammami, N., Azevedo Da Silva, M., Gordon, D., & Melgar-Quiñonez, H. R. (2021). Food insecurity, state fragility and youth mental health: A global perspective*. SSM - Population Health, 14,* 100764. [https://doi.org/10.1016/j.ssmph.2021.100764]
Engel De Abreu, P. M. J., Neumann, S., Wealer, C., Abreu, N., Coutinho Macedo, E., & Kirsch, C. (2021). Subjective Well-Being of Adolescents in Luxembourg, Germany, and Brazil During the COVID-19 Pandemic. *Journal of Adolescent Health, 69(*2), 211–218. [https://doi.org/10.1016/j.jadohealth.2021.04.028]
Foulkes, L., Leung, J. T., Fuhrmann, D., Knoll, L. J., & Blakemore, S. (2018). Age differences in the prosocial influence effect. Developmental Science, 21(6), e12666. https://doi.org/10.1111/desc.12666
Fuhrmann, D., Madsen, K. S., Johansen, L. B., Baaré, W. F. C., & Kievit, R. A. (2022). The midpoint of cortical thinning between late childhood and early adulthood differs between individuals and brain regions: Evidence from longitudinal modelling in a 12-wave neuroimaging sample. NeuroImage, 261, 119507. https://doi.org/10.1016/j.neuroimage.2022.119507
Giedd, J. N., Blumenthal, J., Jeffries, N. O., Castellanos, F. X., Liu, H., Zijdenbos, A., Paus, T., Evans, A. C., & Rapoport, J. L. (1999). Brain development during childhood and adolescence: A longitudinal MRI study. *Nature Neuroscience, 2(*10), 861–863. https://doi.org/10.1038/13158
Gilman, R., & Huebner, S. (2003). A review of life satisfaction research with children and adolescents. *School Psychology Quarterly, 18(*2), 192–205. https://doi.org/10.1521/scpq.18.2.192.21858
Goldbeck, L., Schmitz, T. G., Besier, T., Herschbach, P., & Henrich, G. (2007). Life Satisfaction Decreases during Adolescence. Quality of Life Research, 16(6), 969–979. [http://www.jstor.org/stable/27641333]
González-Carrasco, M., Casas, F., Viñas, F., Malo, S., Gras, M. E., & Bedin, L. (2017). What Leads Subjective Well-Being to Change Throughout Adolescence? An Exploration of Potential Factors. Child Indicators Research, 10(1), 33–56. [https://doi.org/10.1007/s12187-015-9359-6]
Gromada, A., Rees, G., & Chzhen, Y(2020). Worlds of Influence: Understanding What Shapes Child Well-being in Rich Countries, Innocenti Report Card, no. 16, UNICEF Office of Research - Innocenti, Florence
Guthold, R., Newby, H., Keogh, S., Afifi, R. A., Austrian, K., Baird, S., Blum, R. W., Bundy, D. A. P., Deardorff, J., Engel, D., Klein, J. D., Kostelecky, S. M., Mackworth-Young, C., Marquez, J., NicGabhainn, S., Requejo, J., Ross, D. A., Saewyc, E., & Mohan, A. (2023). Developing a Global Approach for Measurement of Adolescent Well-Being. The Journal of adolescent health : official publication of the Society for Adolescent Medicine, 73(6), 972–974. https://doi.org/10.1016/j.jadohealth.2023.08.029
Handa, S., Pereira, A., & Holmqvist, G. (2023). The Rapid Decline of Happiness: Exploring Life Satisfaction among Young People across the World. *Applied Research in Quality of Life, 18(*3), 1549–1579. https://doi.org/10.1007/s11482-023-10153-4
Helliwell, J., Huang, H., & Wang, S. Changing World Happiness. In Helliwell, J., Layard, R., & Sachs, J. (2019). World Happiness Report 2019, New York: Sustainable Development Solutions Network.
Helliwell, J., Huang, H., Wang, S., & Norton, M. Social Environments for World Happiness. In Helliwell, J., Layard, R., Sachs, J., & De Neve, J E. (2020). World Happiness Report 2020, New York: Sustainable Development Solutions Network.
Helliwell, J., Huang, H., Wang, S., & Norton, M. Happiness, Benevolence, and Trust During COVID-19 and Beyond. In Helliwell, J., Huang, H., Wang, S., & Norton, M.Helliwell, J. F., Layard, R., Sachs, J. D., De Neve, J.-E., Aknin, L. B., & Wang, S. (Eds.). (2022). World Happiness Report 2022. New York: Sustainable Development Solutions Network.
Helliwell, J., Huang, H., Wang, S., & Norton, M.Helliwell, J. F., Layard, R., Sachs, J. D., De Neve, J.-E., Aknin, L. B., & Wang, S. (Eds.). (2022). World Happiness Report 2022. New York: Sustainable Development Solutions Network.
Helliwell, J. F., Layard, R., Sachs, J. D., Aknin, L. B., De Neve, J.-E., & Wang, S. (Eds.). (2023). World Happiness Report 2023 (11th ed.). Sustainable Development Solutions Network.
Holte, A., Barry, M. M., Bekkhus, M., Borge, A. I. H., Bowes, L., Casas, F., Friborg, O., Grinde, B., Headey, B., Jozefiak, T., Lekhal, R., Marks, N., Muffels, R., Nes, R. B., Røysamb, E., Thimm, J. C., Torgersen, S., Trommsdorff, G., Veenhoven, R., … Zachrisson, H. D. (2014). Psychology of Child Well-Being. In A. Ben-Arieh, F. Casas, I. Frønes, & J. E. Korbin (Eds.), Handbook of Child Well-Being (pp. 555–631). Springer Netherlands. https://doi.org/10.1007/978-90-481-9063-8_13
Huebner, E. S. (2004). Research on Assessment of Life Satisfaction of Children and Adolescents. Social Indicators Research, 66(1/2), 3–33. [https://doi.org/10.1023/B:SOCI.0000007497.57754.e3]
Huisman, J., & Smits, J. (2009). Effects of Household- and District-Level Factors on Primary School Enrollment in 30 Developing Countries. World Development, 37(1), 179–193. [https://doi.org/10.1016/j.worlddev.2008.01.007]
Inchley, J. (Ed.). (2016). Growing up unequal: Gender and socioeconomic differences in young people’s health and well-being: health behaviour in school-aged children (HBSC) study: International Report from the 2013/2014 survey. World Health Organization, Regional Office for Europe.
Inchley, J., Currie, D., Budisavljevic, S., Torsheim, T., Jåstad, A., & Cosma, A. (2020). Spotlight on adolescent health and well-being. Findings from the 2017/2018 Health Behaviour in School-aged Children (HBSC) survey in Europe and Canada. International report. Volume 1. Key findings. Copenhagen: WHO Regional Office for Europe; 2020
Innocenti, G. M., & Price, D. J. (2005). Exuberance in the development of cortical networks. Nature Reviews Neuroscience,6(12), 955–965. https://doi.org/10.1038/nrn1790
Jerrim, J. (2021). PISA 2018 in England, Northern Ireland, Scotland and Wales: Is the data really representative of all four corners of the UK? Review of Education, 9(3), e3270. [https://doi.org/10.1002/rev3.3270]
Knies, G. (2017). Income effects on children’s life satisfaction: Longitudinal evidence for England. Institute for Social and Economic Research. University of Exeter. [https://repository.essex.ac.uk/21104/1/2017-02.pdf]
Lee, B. J., & Yoo, M. S. (2015). Family, School, and Community Correlates of Children’s Subjective Well-being: An International Comparative Study. Child Indicators Research, 8(1), 151–175. [https://doi.org/10.1007/s12187-014-9285-z]
Levin, K. A., & Currie, C. (2014). Reliability and validity of an adapted version of the Cantril Ladder for use with adolescent samples. Social Indicators Research, 119(2), 1047–1063. https://doi.org/10.1007/s11205-013-0507-4
Lewis, A. D., Huebner, E. S., Malone, P. S., & Valois, R. F. (2011). Life Satisfaction and Student Engagement in Adolescents. Journal of Youth and Adolescence, 40(3), 249–262. https://doi.org/10.1007/s10964-010-9517-6
Lucas, R. E., & Diener, E. (2009). Personality and subjective well-being. In E. Diener (Ed.), The science of well-being: The collected works of Ed Diener (pp. 75–102). Springer Science + Business Media.
Mahoney, J. (2023), “Subjective well-being measurement: Current practice and new frontiers”, OECD Papers on Well-being and Inequalities, No. 17, OECD Publishing, Paris, [https://doi.org/10.1787/4e180f51-en]
Main, G. (2014). Child Poverty and Children’s Subjective Well-Being. Child Indicators Research, 7(3), 451–472. [https://doi.org/10.1007/s12187-014-9237-7]
Main, G., Montserrat, C., Andresen, S., Bradshaw, J., & Lee, B. J. (2019). Inequality, material well-being, and subjective well-being: Exploring associations for children across 15 diverse countries. Children and Youth Services Review, 97, 3–13. [https://doi.org/10.1016/j.childyouth.2017.06.033]
Marquez, J. (2023). Gender Differences in School Effects on Adolescent Life Satisfaction: Exploring Cross-National Variation. Child & Youth Care Forum. [https://doi.org/10.1007/s10566-023-09756-7]
Marquez, J., Casas, F., Taylor, L., & De Neve, JE. (2024, under review). Economic development and adolescent wellbeing in 139 countries. [under review in Child Indicators Research]. Preprint: [https://osf.io/preprints/socarxiv/7cqen/]
Marquez, J., & Long, E. (2021). A Global Decline in Adolescents’ Subjective Well-Being: A Comparative Study Exploring Patterns of Change in the Life Satisfaction of 15-Year-Old Students in 46 Countries. Child Indicators Research, 14(3), 1251–1292. https://doi.org/10.1007/s12187-020-09788-8
Marquez, J., & Main, G. (2021). Can Schools and Education Policy Make Children Happier? A Comparative Study in 33 Countries. Child Indicators Research, 14(1), 283–339. [https://doi.org/10.1007/s12187-020-09758-0]
Nelson, E. E., Jarcho, J. M., & Guyer, A. E. (2016). Social re-orientation and brain development: An expanded and updated view. Developmental Cognitive Neuroscience, 17, 118–127. https://doi.org/10.1016/j.dcn.2015.12.008
OECD (2017). PISA for Development Assessment and Analytical Framework: Reading, Mathematics and Science. Preliminary Version. OECD Publishing, Paris.
OECD. (2018). PISA for Development Assessment and Analytical Framework: Reading, Mathematics and Science. OECD. [https://doi.org/10.1787/9789264305274-en]
OECD. (2019). Rejuvenating Korea: Policies for a Changing Society. OECD. [https://doi.org/10.1787/c5eed747-en]
OECD. (2021). Measuring What Matters for Child Well-Being and Policies. OECD. [https://doi.org/10.1787/e82fded1-en]
Orben, A., Lucas, R. E., Fuhrmann, D., & Kievit, R. A. (2022). Trajectories of adolescent life satisfaction. Royal Society Open Science, 9(8), 211808. [https://doi.org/10.1098/rsos.211808]
Orben, A., & Przybylski, A. K. (2019). The association between adolescent well-being and digital technology use. *Nature Human Behaviour, 3(*2), 173–182. https://doi.org/10.1038/s41562-018-0506-1
Pavot, W., & Diener, E. (2004). The subjective evaluation of well-being in adulthood: Findings and implications. Ageing International, 29(2), 113–135. [https://doi.org/10.1007/s12126-004-1013-4]
Pigaiani, Y., Zoccante, L., Zocca, A., Arzenton, A., Menegolli, M., Fadel, S., Ruggeri, M., & Colizzi, M. (2020). Adolescent Lifestyle Behaviors, Coping Strategies and Subjective Wellbeing during the COVID-19 Pandemic: An Online Student Survey. Healthcare, 8(4), 472. [https://doi.org/10.3390/healthcare8040472]
Riley, A. W. (2004). Evidence That School-Age Children Can Self-Report on Their Health. *Ambulatory Pediatrics, 4(*4), 371–376. https://doi.org/10.1367/A03-178R.1
Rudolf, R., & Bethmann, D. (2023). The Paradox of Wealthy Nations’ Low Adolescent Life Satisfaction. Journal of Happiness Studies, 24(1), 79–105. [https://doi.org/10.1007/s10902-022-00595-2]
Ryff, C. D., Boylan, J. M., & Kirsch, J. A. (2021). Eudaimonic and Hedonic Well-Being: An Integrative Perspective with Linkages to Sociodemographic Factors and Health. In M. T. Lee, L. D. Kubzansky, & T. J. VanderWeele (Eds.), Measuring Well-Being (1st ed., pp. 92–135). Oxford University Press New York. https://doi.org/10.1093/oso/9780197512531.003.0005
Savahl, S., Casas, F., & Adams, S. (2021). The Structure of Children’s Subjective Well-being. Frontiers in Psychology, 12, 650691. https://doi.org/10.3389/fpsyg.2021.650691
Savahl, S., Casas, F., & Adams, S. (2023). Considering a Bifactor Model of Children’s Subjective Well-Being Using a Multinational Sample. Child Indicators Research, 16(6), 2253–2278. [https://doi.org/10.1007/s12187-023-10058-6]
Savahl, S., Lee, B. J., & Casas, F. (eds.), (2022). Children’s views on their lives and well-being during Covid- 19: A report on the Children’s Worlds project, 2020-2022. Jerusalem, Israel: Children’s Worlds Project (ISCWeB).
Save the Children. (2021). Adolescent Wellbeing Framework – A Critical Opportunity to Fulfil Human Rights and Drive Change. Save the Children International. [https://resourcecentre.savethechildren.net/pdf/adolescent_wellbeing_framework.pdf/]
Sawyer, S. M., Azzopardi, P. S., Wickremarathne, D., & Patton, G. C. (2018). The age of adolescence. The Lancet Child & Adolescent Health, 2(3), 223–228. https://doi.org/10.1016/S2352-4642(18)30022-1
Stevenson, B., & Wolfers, J. (2013). Subjective Well-Being and Income: Is There Any Evidence of Satiation? American Economic Review, 103(3), 598–604. [https://doi.org/10.1257/aer.103.3.598]
Stewart-Brown, S., Tennant, A., & Tennant, R. (2009). Internal construct validity of the Warwick-Edinburgh Mental Well-being Scale (WEMWBS): a Rasch analysis using data from the Scottish Health Education Population Survey. Health Qual Life Outcomes 7, 15. https://doi.org/10.1186/1477-7525-7-15
Sutcliffe, K., Ball, J., Clark, T. C., Archer, D., Peiris-John, R., Crengle, S., & Fleming, T. (Theresa). (2023). Rapid and unequal decline in adolescent mental health and well-being 2012–2019: Findings from New Zealand cross-sectional surveys. Australian & New Zealand Journal of Psychiatry, 57(2), 264–282. [https://doi.org/10.1177/00048674221138503]
Tamnes, C. K., Herting, M. M., Goddings, A.-L., Meuwese, R., Blakemore, S.-J., Dahl, R. E., Güroğlu, B., Raznahan, A., Sowell, E. R., Crone, E. A., & Mills, K. L. (2017). Development of the cerebral cortex across adolescence: A multisample study of inter-related longitudinal changes in cortical Vol., surface area, and thickness. The Journal of Neuroscience, 37(12), 3402–3412. https://doi.org/10.1523/JNEUROSCI.3302-16.2017
The Children’s Society (2020). The Good Childhood Report 2020. https://www.childrenssociety.org.uk/sites/default/files/2020-11/Good-Childhood-Report-2020.pdf
The Children’s Society (2020). The Good Childhood Report 2023. [https://www.childrenssociety.org.uk/sites/default/files/2023-09/The Good Childhood Report 2023.pdf]
Twenge, J. M., Martin, G. N., & Campbell, W. K. (2018). Decreases in psychological well-being among American adolescents after 2012 and links to screen time during the rise of smartphone technology. Emotion, 18(6), 765–780. [https://doi.org/10.1037/emo0000403]
UNICEF. (2013). UNICEF Multiple Indicator Cluster Surveys. [https://mics.unicef.org]
Veenhoven, R. (2008). Healthy happiness: Effects of happiness on physical health and the consequences for preventive health care. Journal of Happiness Studies: An Interdisciplinary Forum on Subjective Well-Being, 9(3), 449–469. https://doi.org/10.1007/s10902-006-9042-1
Vijayakumar, N., Allen, N. B., Youssef, G., Dennison, M., Yücel, M., Simmons, J. G., & Whittle, S. (2016). Brain development during adolescence: A mixed‐longitudinal investigation of cortical thickness, surface area, and volume. Human Brain Mapping, 37(6), 2027–2038. https://doi.org/10.1002/hbm.23154
Von Der Embse, N., Jester, D., Roy, D., & Post, J. (2018). Test anxiety effects, predictors, and correlates: A 30-year meta-analytic review. Journal of Affective Disorders, 227, 483–493. [https://doi.org/10.1016/j.jad.2017.11.048]
Watson, R. E., DeSesso, J. M., Hurtt, M. E., & Cappon, G. D. (2006). Postnatal growth and morphological development of the brain: a species comparison. Birth Defects Research Part B: Developmental and Reproductive Toxicology, 77(5), 471-484.
Weinstein, N. (2022). ‘Life is getting better’ for most looked-after children. Children & Young People Now. [https://www.cypnow.co.uk/news/article/life-is-getting-better-for-most-looked-after-children]
Wierzbicka, A. (2004). “Happiness” in Cross-Linguistic & Cross-Cultural Perspective. Daedalus, 133(2), 34–43. [http://www.jstor.org/stable/20027911]
Endnotes
Batalle et al. (2019); Innocenti and Price (2005); Watson et al. (2006) ↩︎
Nelson et al. (2016); Sawyer et al. (2018) ↩︎
Blakemore (2018); Foulkes et al. (2018); Giedd et al. (1999); Tamnes et al. (2017); Vijayakumar et al. (2016) ↩︎
Arian et al. (2013) ↩︎
Sawyer et al. (2018) ↩︎
Diener et al. (2002) ↩︎
Huebner (2004) ↩︎
Campbell et al. (2021); Fuhrmann et al. (2022); Orben and Przybylski (2019); Stewart-Brown et al. (2009) ↩︎
Aymerich et al. (2021); González-Carrasco et al. (2017); Savahl et al. (2023) ↩︎
Diener et al. (1999); Pavot and Diener (2004) ↩︎
Savahl et al. (2021) ↩︎
Bedin and Sarriera (2014); Casas (2011); Casas et al. (2012); Clair (2012) ↩︎
Bevans et al. (2010); Gilman and Huebner (2003); Lewis et al. (2011) ↩︎
Bevans et al. (2010); Riley (2004) ↩︎
Levin and Currie (2014) ↩︎
Cerna et al. (2023); Marquez and Main (2021); Weinstein (2022) ↩︎
Casas and Gonzále-Carrasco (2019); Goldbeck et al. (2007); Orben et al. (2022) ↩︎
Casas et al. (2014) ↩︎
Marquez and Long (2021); The Children’s Society (2020) ↩︎
Cosma et al. (2023); Savahl et al. (2022) ↩︎
Cosma et al. (2023); Marquez and Long (2021) ↩︎
Marquez and Long (2021) ↩︎
Ben-Arieh (2008) ↩︎
Clark et al. (2018) ↩︎
De Neve and Oswald (2012) ↩︎
Knies (2017); Main (2014) ↩︎
Casas and González (2017); Marquez and Main (2020) ↩︎
Azzopardi et al. (2019); Casas et al., 2018; Department for Education (2022); OECD (2021) ↩︎
Lee and Yoo (2015) ↩︎
Bradshaw (2015) ↩︎
Casas et al. (2022); Helliwell et al. (2023); Lee and Yoo (2015) ↩︎
Rudolf and Bethmann (2023) ↩︎
Marquez et al. (2024) ↩︎
Diener and Suh (2003); Helliwell et al. (2023) ↩︎
Diener et al. (1999); Huebner (2004) ↩︎
Helliwell et al. (2023) ↩︎
Lucas and Diener (2009); Veenhoven (2008) ↩︎
Casas (2016); Cummins (2016) ↩︎
We follow World Bank Analytical Classifications (GNI per capita in US$; Atlas methodology (World Bank, n.d.)), to categorize countries as high-income, upper middle-income, lower middle-income and low-income. World Bank (n.d.). World Bank Country and Lending Groups. Country Classification. The World Bank. Accessible at: https://datahelpdesk.worldbank.org/knowledgebase/articles/906519-world-bank-country-and-lending-groups ↩︎
Helliwell et al. (2019); Helliwell et al. (2020); Helliwell et al. (2022) ↩︎
Marquez and Long (2021) ↩︎
Engel De Abreu et al. (2021); Pigaiani et al. (2020) ↩︎
Engel De Abreu et al. (2021); Marquez and Long (2021) ↩︎
Helliwell et al. (2022) ↩︎
Helliwell et al. (2022) ↩︎
See Chapter 2 of the current World Happiness Report ↩︎
Casas and González-Carrasco (2019); Goldbeck et al. (2007); Orben et al. (2022) ↩︎
See Chapter 2 of the current World Happiness Report ↩︎
Cummins (1996) ↩︎
See Chapter 2 of the current World Happiness Report ↩︎
PISA includes mostly high-income countries, so logGDP is the only option. GWP includes many high-, upper middle-, lower middle-, and low-income countries, which allows for a more nuanced comparison across GDP tiers. We believe this is preferable to visualize the magnitude of well-being inequalities across countries from different GDP tiers compared to the other inequalities examined. This approach also facilitates the discussion on the links between GDP and life satisfaction (negative or non-existent in high-income countries; positive everywhere else) and the limitations on available data that explain counterintuitive results found in the literature (Marquez et al., 2024). ↩︎
Cosma et al. (2023); Due et al. (2019) ↩︎
Daly (2022); Orben et al. (2022) ↩︎
Chen et al. (2020); Orben et al. (2022); ↩︎
Campbell et al. (2021); Rudolf and Bethmann (2023) ↩︎
Marquez et al. (2024) ↩︎
Byrne et al. (2021); Colom and Rohloff (2018) ↩︎
Huisman and Smits (2009) ↩︎
Marquez et al. (2024) ↩︎
See Gallup World Poll retrieved from: [https://www.gallup.com/analytics/318875/global-research.aspx]; see PISA Participants retrieved from: [https://www.oecd.org/pisa/aboutpisa/pisa-participants.htm]; see HBSC Participants retrieved from: [https://hbsc.org/network/countries/]; see Children’s Worlds retrieved from: [https://isciweb.org/wp-content/uploads/2019/12/Session1-ChildrensWorlds.pdf] ↩︎
OECD (2018) ↩︎
UNICEF (2023) ↩︎
See Coordinate Project retrieved from: [https://www.coordinate-network.eu/] ↩︎
See OECD retrieved from: [https://www.oecd.org/els/family/child-well-being/data/] ↩︎
Mahoney (2023); OECD (2017) ↩︎
See UNICEF retrieved from: [https://www.unicef.org/health/child-and-adolescent-health-and-well-being] ↩︎
See Adolescent Well-being Measurement Expert Consultative Group retrieved from: [https://www.who.int/groups/adolescent-well-being-measurement-expert-consultative-group] ↩︎
See Wellbeing for Planet Earth retrieved from: [https://www.globalwellbeinginitiative.org/about-us] ↩︎
OECD (2021) ↩︎
PLACEHOLDER FOOTNOTE ONCE REFERENCE CONFIRMED (Camila Teixeira) ↩︎
OECD (2019) ↩︎