Trusting others: How unhappiness and social distrust explain populism
Key insights
The decline in happiness and social trust in Europe and the US explains a large share of the rise in political polarisation and anti-system votes.
Subjective attitudes such as life satisfaction and trust play a much greater role in shaping values and voting behaviour than traditional ideologies or class struggle.
Unhappy people are attracted by the extremes of the political spectrum. Low-trust people are found more often on the far right, whereas high-trust people are more inclined to vote for the far left.
We highlight the political implications of both the presence and absence of caring and sharing practices.
Introduction
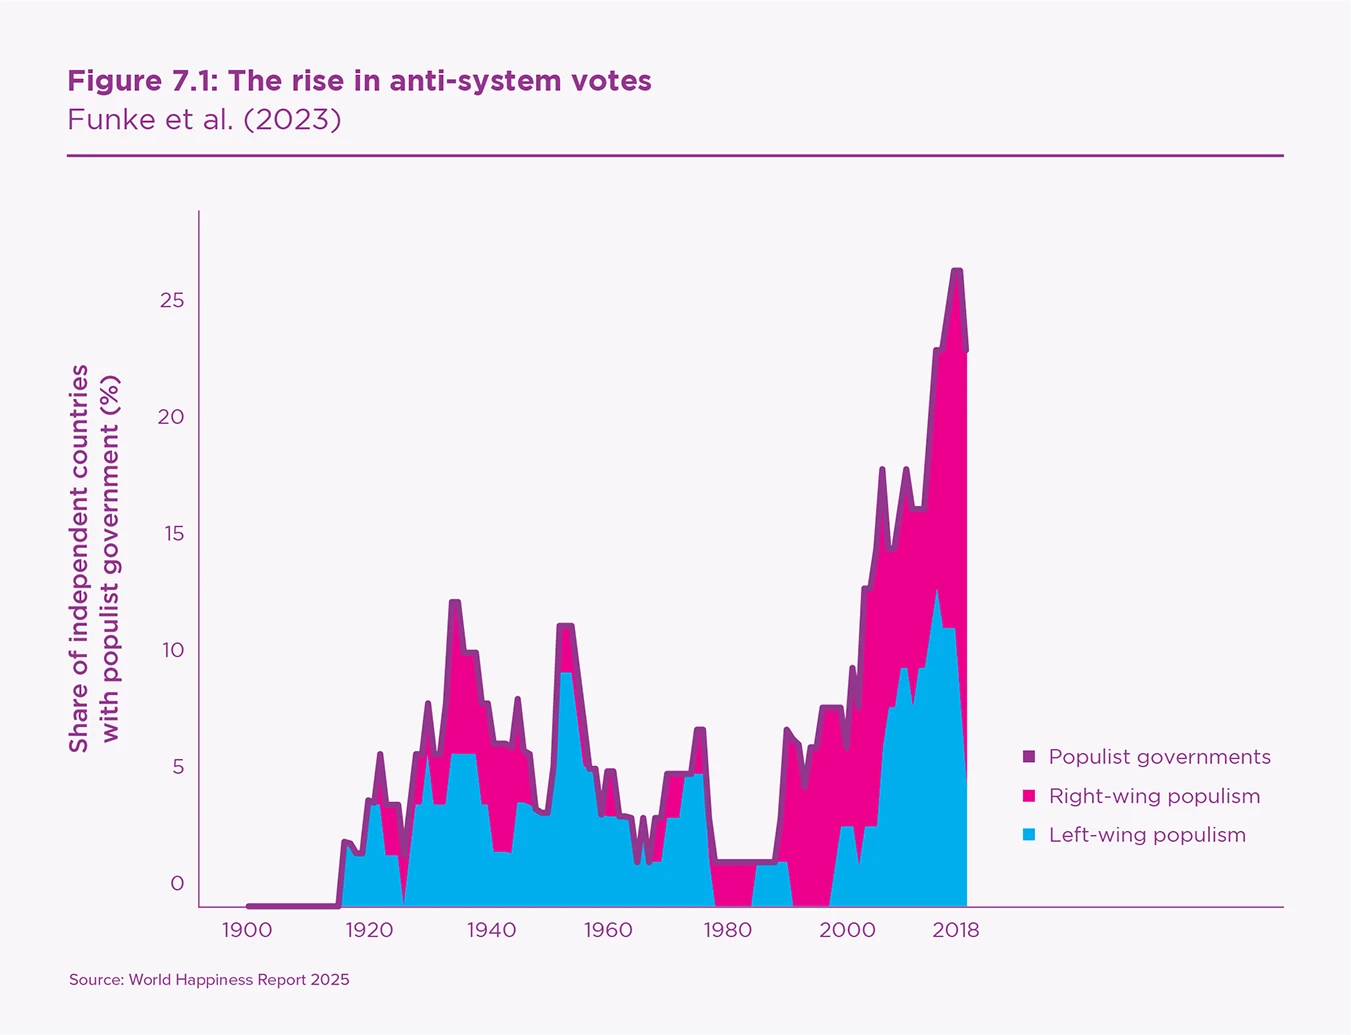
During the last decade, Western countries have seen a cascade of anti-system political victories, from Brexit in 2015 to the election of Donald Trump in 2024. During this period, resentment of ‘the system’ has grown in most European countries, particularly in Austria, Denmark, Finland, France, Germany, Hungary, Italy, Poland, Sweden, and Switzerland. Figure 7.1 illustrates the global rise in anti-system populist parties over the 20th century, both on the far left and the far right, with a sharp increase since the 1980s.
Voters question immigration and globalisation, protectionism is on the rise, and attacks on experts and mainstream media are increasingly common. At first glance, these patterns can be surprising, given the historically unprecedented levels of prosperity and security after World War II and the fall of the Berlin Wall in 1989.
A number of studies suggest that this anti-system wave originates in a loss of confidence in traditional political parties, both right and left, and a more general loss of confidence in elites, giving rise to “anti-party parties”.[1] This loss of confidence in the system may be attributed to economic factors – such as rising economic insecurity and the economic consequences of globalisation, trade, and automation[2] – or cultural factors leading to a backlash against modernity and growing hostility towards immigrants.[3]
These explanations rarely address the important question of why some anti-system voters respond to these pressures by moving to the far left, while others move to the far right.[4] Equally puzzling are the different agendas of the populist right and the extreme left in terms of income inequality and the persistent paradox that poor people, who would benefit from income redistribution, often vote for parties that oppose it.[5]
The recent victory of Donald Trump in 2024 is a perfect illustration of this puzzle. Likewise, in the French context, during the first round of the 2022 presidential election, anti-system parties, both from the far left (La France Insoumise) and the far right (Rassemblement National) gathered around 20% of the votes, often coming from the same social background. Le Pen, the populist right candidate, and Mélenchon, the extreme left candidate, are both able to attract the votes of similar anti-system, blue-collar workers despite proposing very different policy programs on immigration and redistribution.
To explain these patterns of political behaviour, one must acknowledge the decline of the traditional class-based divide in voting behaviour and search for a new framework that can explain the rise in anti-system votes. In particular, why they flow either to the populist right (with anti-redistribution, anti-immigrant, and more parochial ideology) or the far left (pro-redistribution, pro-immigrant, and more universalist values).
In this chapter, we propose such a framework, where subjective attitudes such as life satisfaction and interpersonal trust play a crucial role. In the context of post-industrial societies that have become increasingly individualistic, subjective attitudes play a much greater role in shaping values and voting behaviour than traditional ideologies or class struggle. In line with previous findings,[6] we show that (low) life satisfaction is highly related to distrust in institutions and voting preferences for anti-system candidates, both in the United States (US) and in Europe, using various international databases.
Then we highlight a key new element: the role of social trust in explaining how these anti-system forces are oriented to the right or left of the political spectrum. Far-left voters have a higher level of social trust, while right-wing populists have a very low level of social trust. For the populist right, this low trust is not limited to strangers, but also extends to others in general, from homosexuals to their own neighbours. The xenophobic inclination of the populist right, well-documented worldwide,[7] seems to be a particular case of a broader distrust towards the rest of society. Right-wing populists throughout the world share xenophobic and anti-immigration inclinations. The Sweden Democrats, the Danish People’s Party, the Finns Party, the Freedom Party of Austria, Greece’s Golden Dawn, the Northern League and Fratelli in Italy, the National Rally in France, and a fraction of the Republican Party in the US are all built on strong anti-immigration foundations.
Far-left voters have a higher level of social trust, while right-wing populists have a very low level of social trust.
To encompass these patterns in a unifying framework, we construct a matrix of interpersonal trust and life satisfaction and show how voters in the United States and Western Europe are positioned in the matrix over the last decade. We test the relevance of this framework by combining various databases: the Gallup World Poll (2004–2024), the European Social Survey (2002–2023), the General Social Survey (1970–2023), and the World Values Survey (1981–2023). We show how our new paradigm offers additional insight for a more general analysis of political preferences. In particular, how social trust and life satisfaction combine to explain otherwise puzzling ideological attitudes. For example, why populist right-wing voters, while poorer than the average, tend not to support income redistribution policies.
An additional key element is to explain the rise of anti-system parties over time. If happiness and social trust can explain anti-system votes and ideologies not only in cross-section but also over time, we should see both attitudes moving in opposite directions over the last decade, especially among particular groups of people. We show, with the new release of the Gallup data, an acceleration in the decrease of life satisfaction in the US and, to a lesser extent, in Western European countries, as already documented in World Happiness Report 2024.[8]
We also provide new evidence for a strong decline in social trust. As an illustration, the share of American people who trust others has almost halved since the 1970s, dropping from 50% to 30%. These new findings resonate with Bob Putnam’s seminal book, Bowling Alone, and with the original data discussed in Chapter 3 of this report,[9] that documents a sharp increase in the number of Americans who dine alone every day of the week. We show that the country-wide evolution of happiness and trust is highly associated with the rise in the likelihood of voting for anti-system parties in Western Europe and the United States, and discuss the groups of people whose life satisfaction and social trust have declined the most during this period, pushing them to anti-system and populist parties.
A new paradigm to explain anti-system votes
A growing literature has established the importance of looking at subjective attitudes, such as life satisfaction, for explaining voting behaviour. In particular, it has already been shown that unhappy people have less faith in political parties and the political system, are more likely to agree with authoritarian ideas such as having a strong leader to rule the country, and are more likely to reject incumbents, both in the European and Brexit contexts.[10] In the US context, low life satisfaction was highly predictive of Trump’s election victory in 2016.[11] In addition, negative emotions measured by international surveys and social media, were also highly predictive of populist votes in the US and Western Europe.[12]
This evidence adds to the extensive literature documenting the political consequences of economic shocks and risks such as the financial crisis, globalisation, and the rise in income inequality. It makes a crucial addition by showing how measures of life satisfaction capture the impact of these shocks on life experience much more accurately than simple socio-demographic measures. It also shows how these negative subjective experiences translate into the blaming of institutions and elites for offering insufficient protection from these shocks.
Our contribution here is to show the importance of adding social trust as a second dimension – in addition to life satisfaction – to understand the partitioning of unsatisfied citizens into the far left or far right.
Yet, this literature cannot explain why unhappy voters turn either to the left or to the right along the spectrum of anti-system parties, nor their different ideologies (i.e., economic and cultural values). Our contribution here is to show the importance of adding social trust as a second dimension – in addition to life satisfaction – to understand the partitioning of unsatisfied citizens into the far left or far right. We also pay attention to abstainers, whose lack of social inclusion is associated with a withdrawal from the political game and the refusal to vote. This is particularly revealing in the case of the United States, where this behaviour represents an addition to the limited options offered by the bi-partisan system.
This partitioning resonates with previous work showing the role of universalist versus parochial moral values in the rise of the pro-Trump vote in the US context.[13] It also talks to other studies that have identified cultural causes as the root of the upswing in populism. For instance, Inglehart and Norris claim that populist voting is mainly driven by the generation born between the two World Wars, driven by a rejection of cultural modernity, diversity, and the emancipation of women and sexual minorities.[14] However, these traditional explanations fall short of explaining why, in some countries, populist platforms attract at least as much support from the youth as from the older generation. The rise in populist votes is ubiquitous, cutting across generations and categories. Cultural backlash is equally unable to explain the dramatic drop in trust in government observed throughout the Western world, across all cohorts. Economic factors are also unable to explain why there is a strong xenophobic undercurrent in some anti-system parties but not others, or why many populist parties and their poor constituencies are hostile to income redistribution policies.
Instead, we build on abundant social science research showing how social trust shapes ideologies. This literature shows how an important part of economic values – in particular citizens’ predisposition to pay taxes, finance public goods, or favour more or less redistributive policies – is related to the level of social trust. For example, the willingness to pay taxes depends on the belief that others are also contributing their share, a finding confirmed by laboratory experiments of public good games on the funding of collective services.[15] People who are most in favour of redistribution and, more generally, countries where the welfare state system is more generous, have higher levels of trust. By contrast, distrust undermines support for income redistribution. In the French context, trust explains a large share of economic and cultural values, especially attitudes towards immigration or homosexuality.[16]
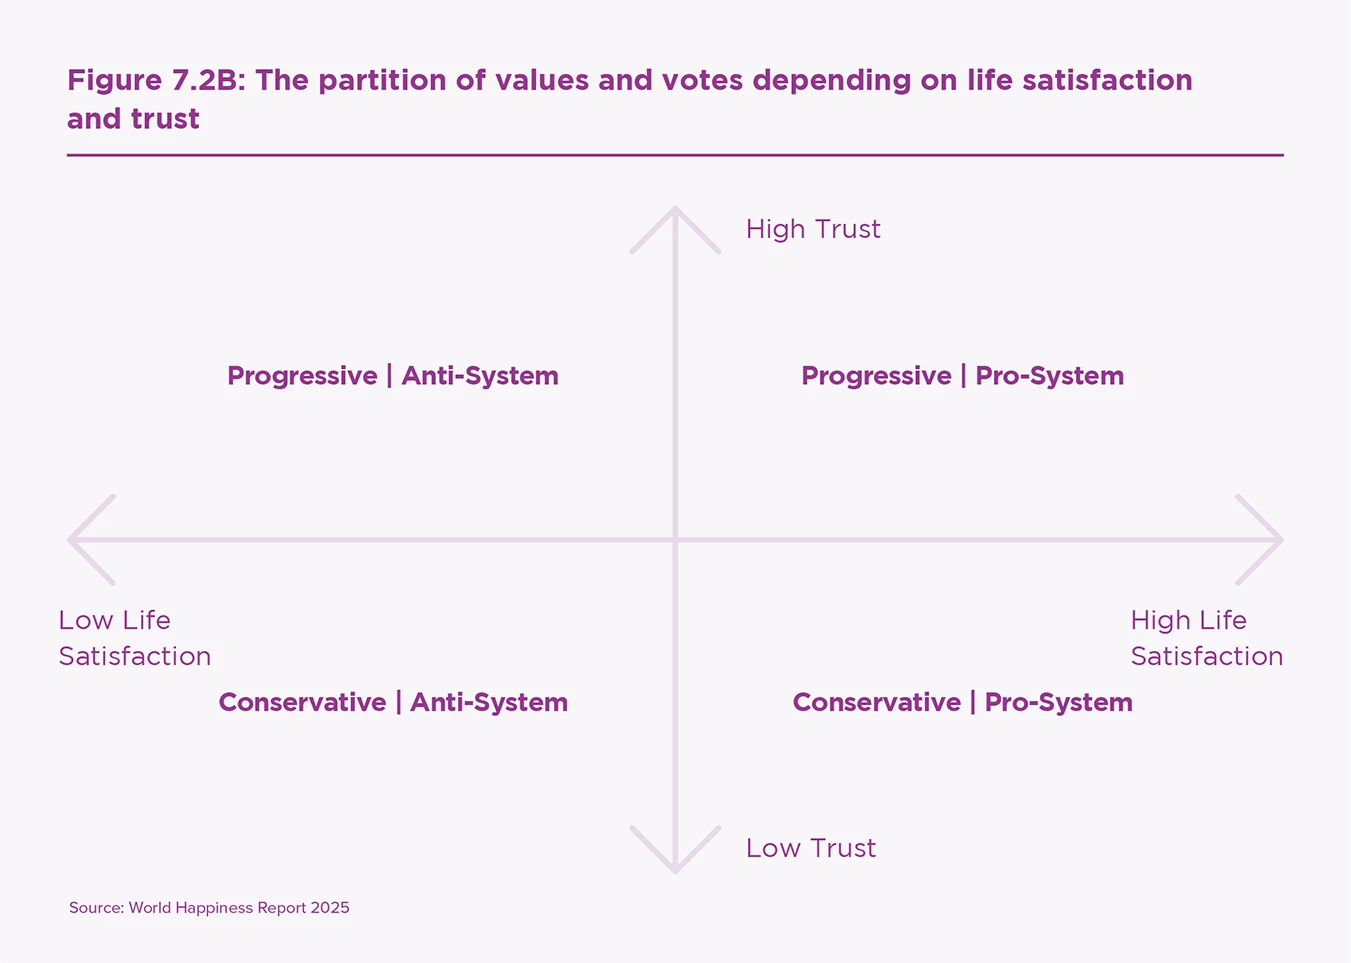
The two diagrams below illustrate our proposed paradigm. Figure 7.2A shows how life satisfaction and social trust explain ideologies (both cultural and economic attitudes) and political attitudes and votes. Figure 7.2B shows how life satisfaction and social trust are both necessary to fully understand anti-system movements.
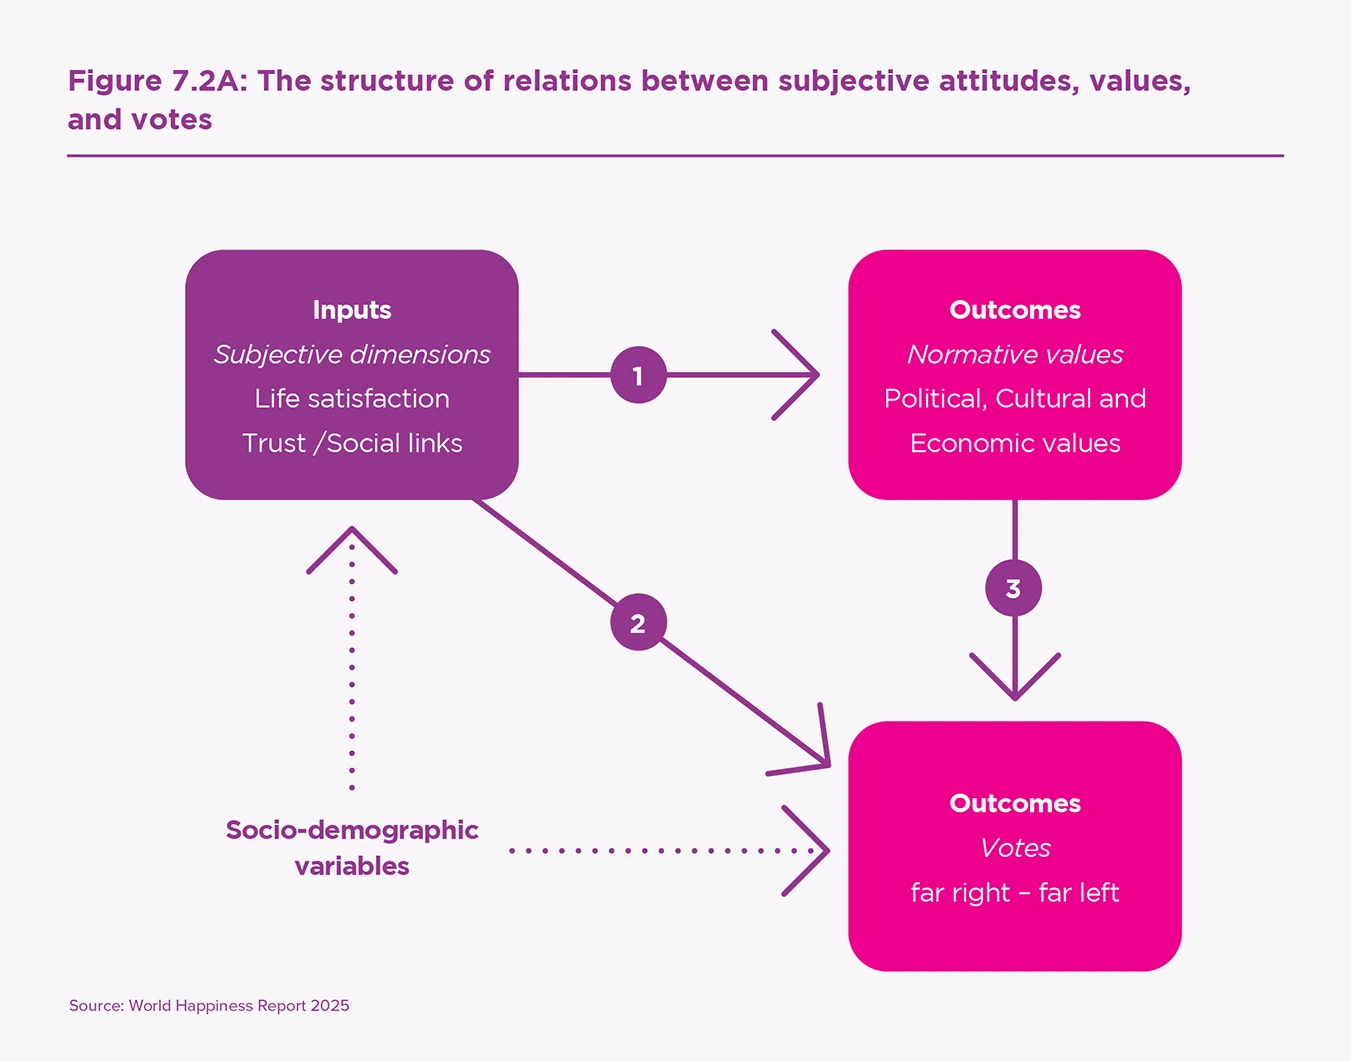
In the following sections, we apply this paradigm using several individual-level, cross-national surveys that contain information on subjective life evaluation, trust in others, and values in Western Europe and the United States.[17] In the next section, we show the relationship between these variables and political, economic, and cultural values (corresponding to arrow 1 of Figure 7.2A). In the following section, we illustrate the political consequences of these attitudes on votes (arrows 2 and 3 of Figure 7.2A and the partitioning in Figure 7.2B).
The influence of life satisfaction and trust on ideology
We start by illustrating the relationship between life satisfaction and social trust, on the one hand, and political, cultural, and economic values on the other hand.
Life satisfaction is measured with the question, “Are you satisfied with your life in general?” with responses on a scale from 0 (very dissatisfied) to 10 (very satisfied). Social trust is measured by interpersonal trust, which is the trust that people have in other people. Importantly, it is different from institutional trust, which is the trust that people have in institutions (government, parliament, legal, etc.). To measure interpersonal trust, we use the question, “In general, would you say that most people can be trusted or that one can never be too careful when dealing with others?” This question has become a standard reference in international surveys for estimating the social fabric in a society, and the ability to cooperate outside the family and the private circle. We also propose additional measures of social trust based on concrete measures of social relationships.
We implement our framework and look at the interplay between life satisfaction and social trust. For simplicity, we split the population of each country into high trust versus low trust groups and into high life satisfaction versus low life satisfaction (as compared to the median level). We then represent the average values of the four groups defined by this partition.

Political values
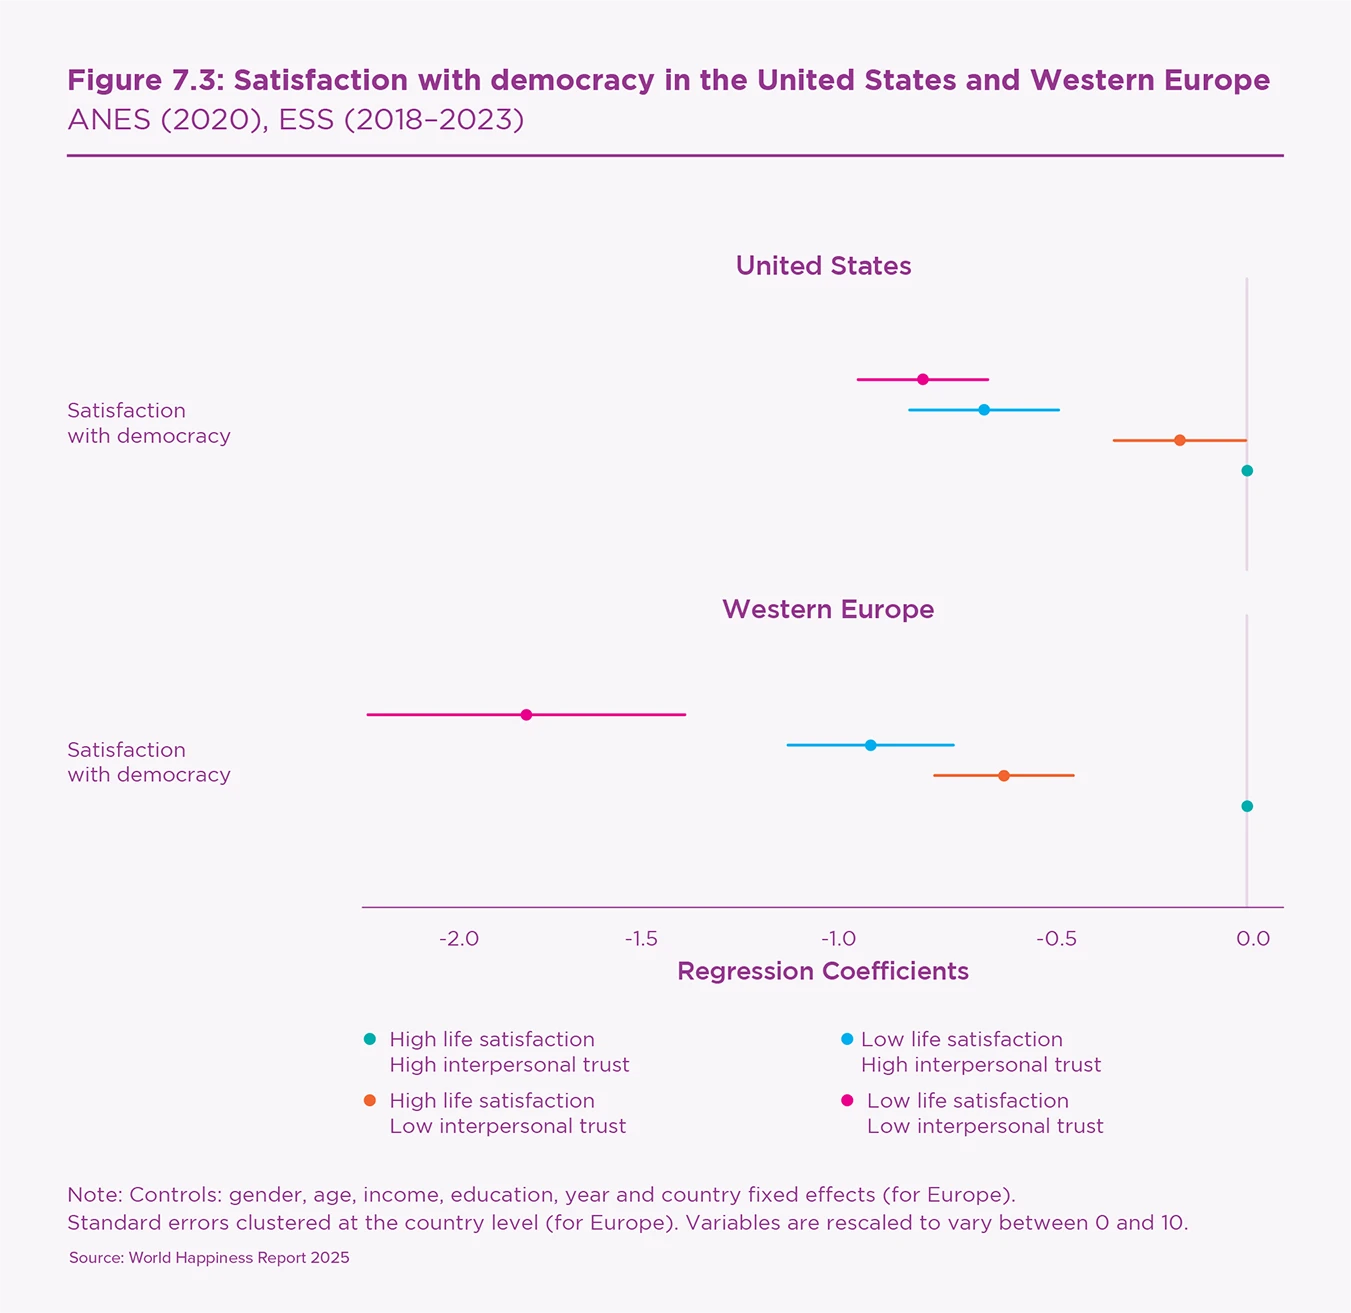
Figure 7.3 shows how satisfaction with democracy is associated with life satisfaction and interpersonal trust using individual estimates in Europe and the US and controlling for income, education, gender, and age. Results for trust in the parliament, the legal system, politicians, and support of European integration are reported in the online appendix.
The green dots at the right of the figure represent the attitudes of individuals who declare a high level of life satisfaction and trust. Compared with this benchmark, the other coloured dots correspond to the three other groups: high life satisfaction and low trust (orange), low life satisfaction and low trust (pink), and low life satisfaction and high trust (blue).
As can be seen, dissatisfaction with democracy is particularly high when people express a low level of life satisfaction (pink and blue), especially in Europe. This is true whether they have a high (blue) or low (pink) level of social trust. In Europe, people with low life satisfaction and low social trust (pink) are 1.8 points less satisfied with democracy compared to the baseline, on a 0–10 scale. For the US, it is 0.8 points. People with high social trust but low life satisfaction (blue) also tend to be highly dissatisfied with democracy compared to their counterparts with high life satisfaction (green). We find similar results for distrust in legal institutions.
The main takeaway of this first finding is the anti-system political attitudes of citizens with the lowest level of life satisfaction. Those who are dissatisfied with their lives may feel that the system has failed them and consider that the democratic system and legal institutions have not protected them against life risks.
Cultural values
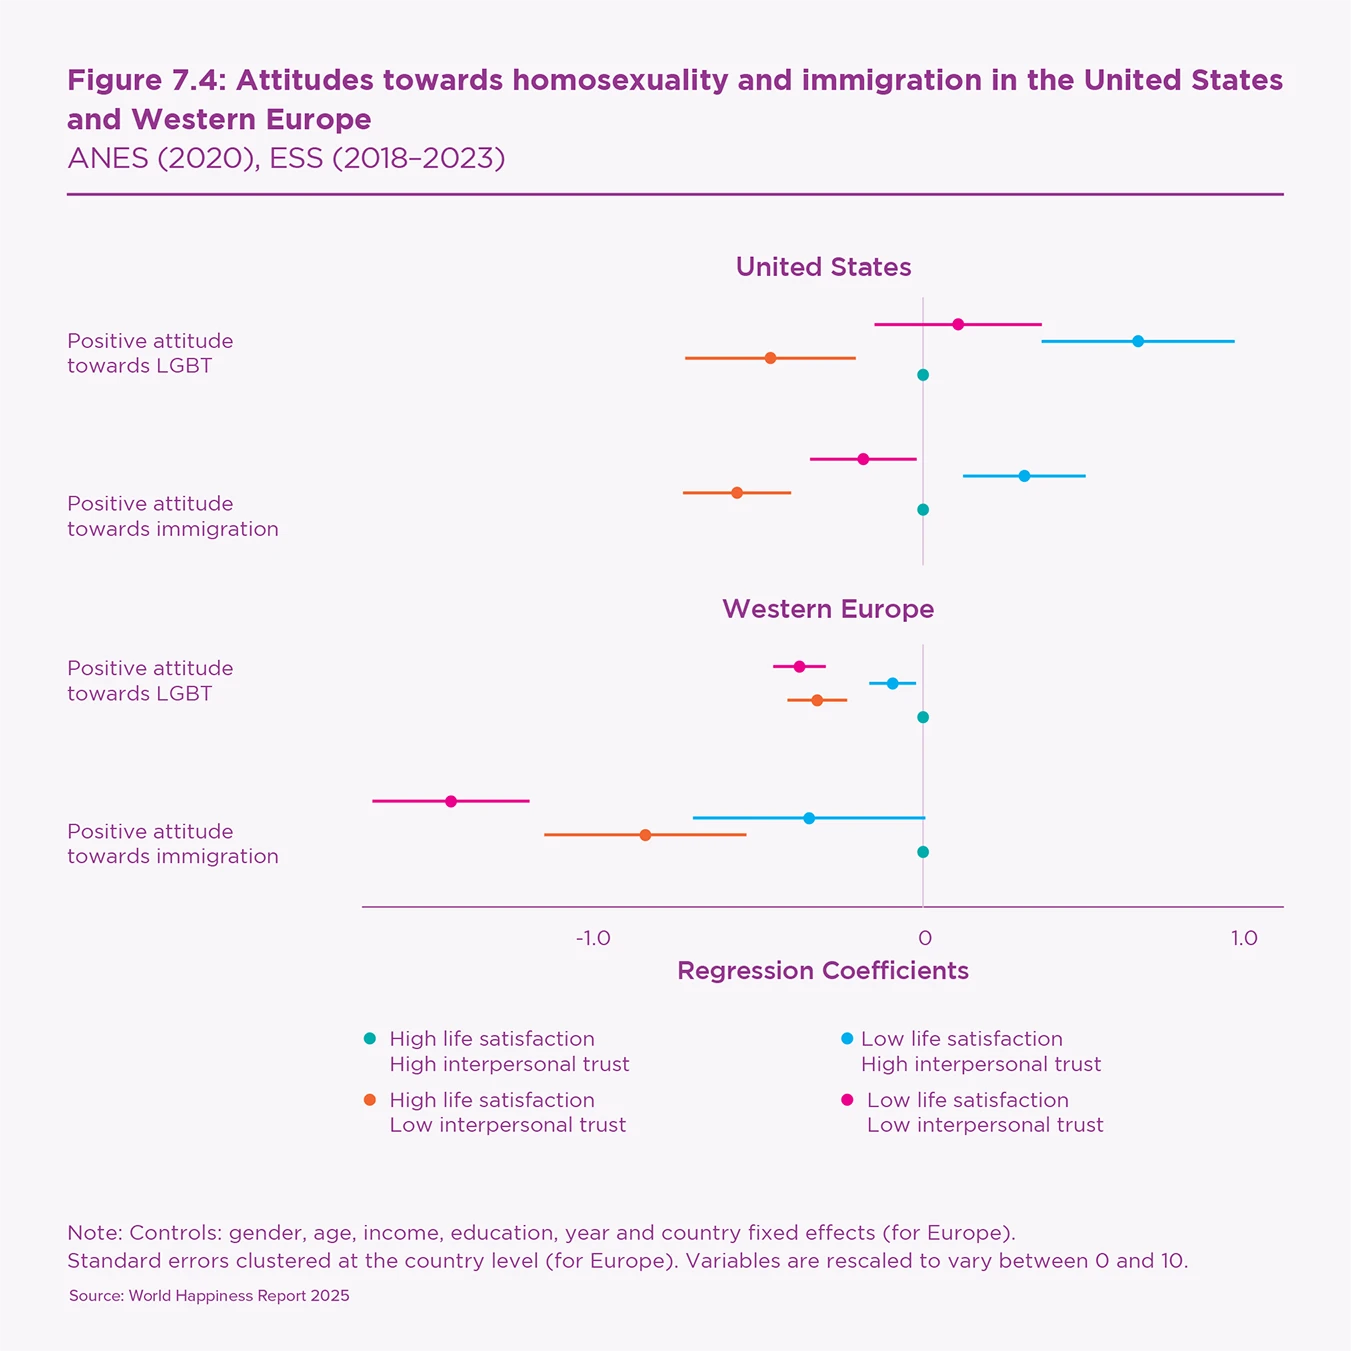
The group of citizens with the lowest level of satisfaction, the anti-system group, is divided in terms of cultural values and what should replace ‘the system’, depending on their level of social trust. Figure 7.4 shows that social trust is the main predictor of the cultural divide in terms of attitudes towards homosexuality and immigration. We measure positive attitudes towards homosexuality with questions on whether gay and lesbian people should be able to adopt children (in the US) or are free to live their lives as they wish (in Europe). We measure positive attitudes towards immigrants with questions on whether immigrants are good for the country’s economy or could take the jobs of natives.
The crucial role of social trust in shaping cultural values is powerfully illustrated by the contrast between the two groups of citizens with low life satisfaction. The attitudes of those with low trust (pink) are almost twice as negative as those with high trust (blue). These less satisfied but trusting citizens (blue) are more tolerant towards homosexuality and immigration than highly satisfied but distrusting people (orange). Thus, unlike political ideology, which maps onto the distribution of life satisfaction, the distribution of cultural ideology is aligned along the axis of interpersonal trust, as shown earlier in Figure 7.2B.
Economic values
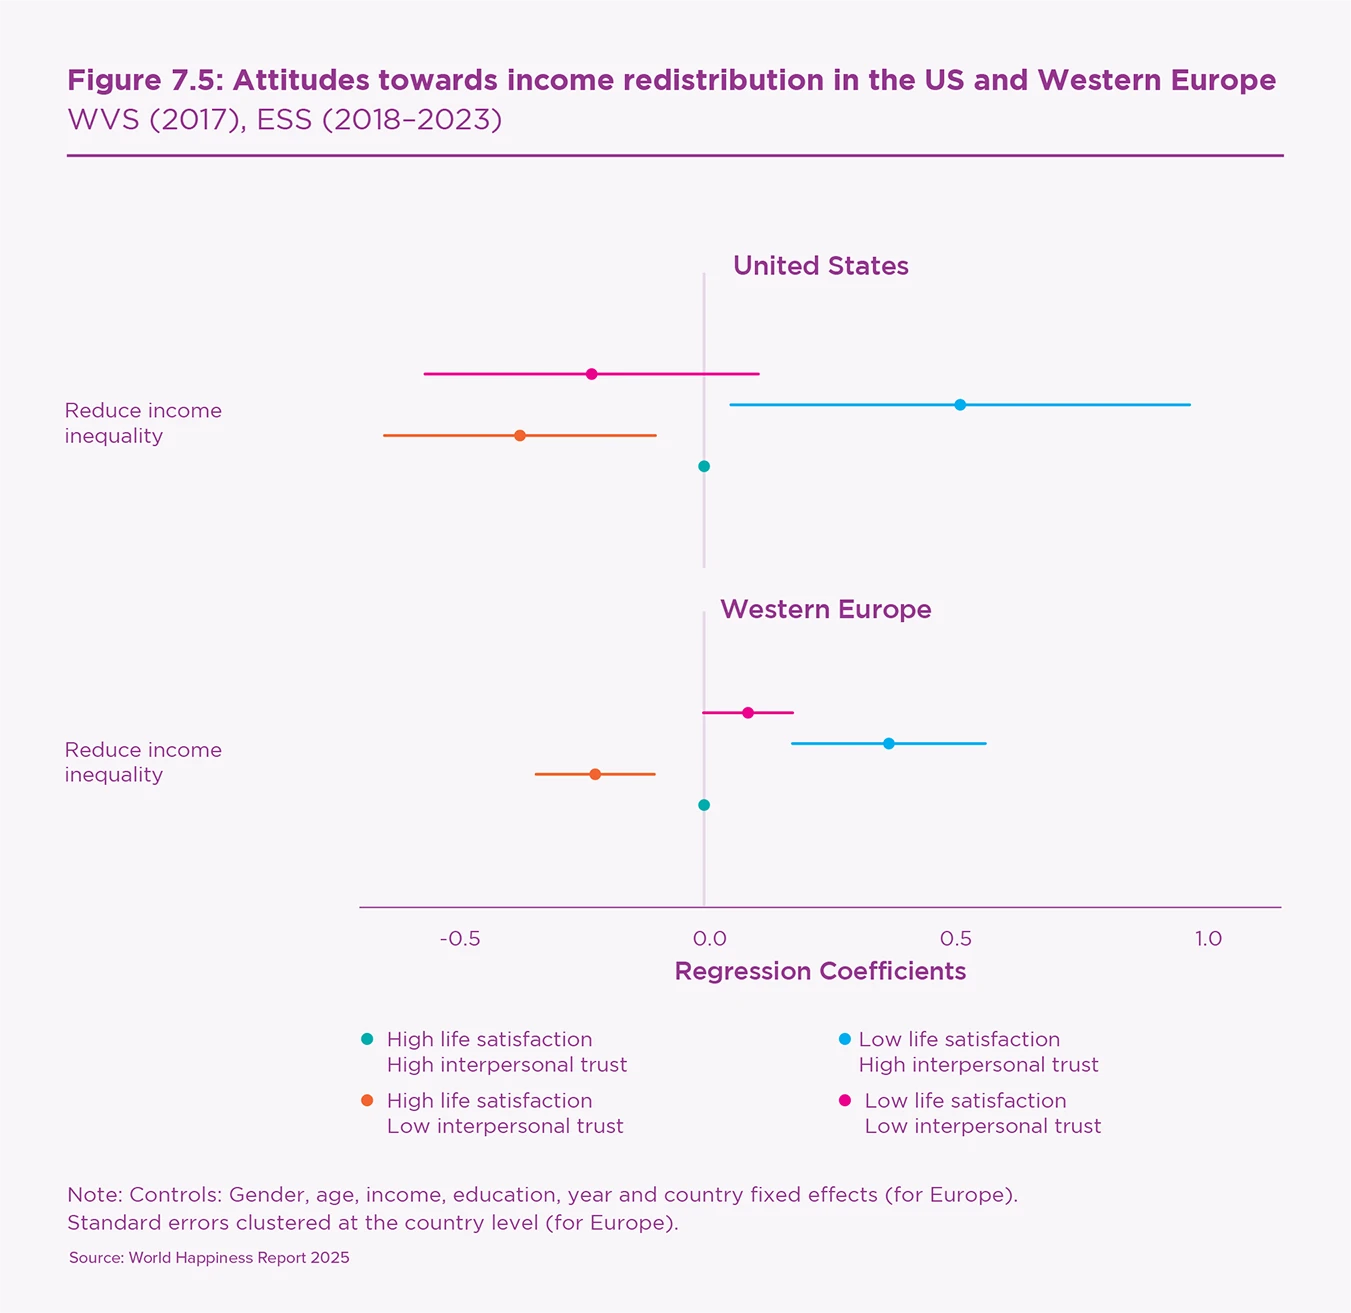
The same patterns hold for the relationships between life satisfaction, social trust, and economic values. Social trust appears as the main predictor of the ideological divide in terms of income redistribution. We measure attitudes towards redistribution using a question that asks whether “Government should reduce differences in income levels” (1–10 scale) for Europe and “There should be greater incentives for individual effort” versus “Incomes should be made more equal” (1–10 scale) for the United States.
Figure 7.5 shows that support for income redistribution is generally associated with higher social trust and lower life satisfaction (blue). Those who are highly satisfied but less trusting (orange) are the ones who most often oppose income redistribution. The contrast is even more salient within the group of citizens with the lowest life satisfaction. They are less supportive of income redistribution if they have a low level of interpersonal trust (pink) and more in favour if they trust others (blue).
Citizens with low interpersonal trust may be sceptical of the social contract and doubt reciprocity on behalf of other people. Indeed, the economic literature has shown that the level of interpersonal trust explains an important part of citizens’ predisposition to finance public goods, pay taxes, or support redistributive policies.[18] This sheds light on the key puzzle of why a large part of the working class, who are the least satisfied with life in general, might vote for parties that oppose redistributive policies.
The influence of life satisfaction and trust on voting behaviour
We now turn to voting behaviour. First, we study the connection between life satisfaction, interpersonal trust, and votes (the second arrow of Figure 7.2A) and then the relationship between economic and cultural values and votes (the third arrow of Figure 7.2A).
Western Europe
In Western Europe, Table 7.1 shows that high levels of life satisfaction are negatively associated with votes for far-left and far-right parties at the last national election. By contrast, voters for centre-left and centre-right parties are more satisfied with their lives on average. However, a low level of trust is only associated with an attraction to the far right, and to a lesser extent to the right, but not to the left and the far left.
| Dependent variable | |||||
|---|---|---|---|---|---|
| Far left | Left | Center | Right | Far right | |
| (1) | (2) | (3) | (4) | (5) | |
| Life satisfaction | −0.010∗∗∗ | −0.005∗∗∗ | 0.005∗∗∗ | 0.015∗∗∗ | −0.005∗∗∗ |
| (0.001) | (0.001) | (0.001) | (0.001) | (0.001) | |
| Trust in others | 0.004∗∗∗ | 0.014∗∗∗ | 0.003∗∗∗ | −0.006∗∗∗ | −0.016∗∗∗ |
| (0.001) | (0.001) | (0.001) | (0.001) | (0.001) | |
| Observations | 32,450 | 32,450 | 32,450 | 32,450 | 32,450 |
| R2 | 0.068 | 0.083 | 0.088 | 0.073 | 0.083 |
| Adjusted R2 | 0.067 | 0.082 | 0.087 | 0.072 | 0.082 |
| Residual Std. Error (df = 32414) | 0.289 | 0.487 | 0.332 | 0.443 | 0.334 |
Note: Weighted least squares. Estimates of the likelihood to vote for either party at the last national election. Additional controls: gender, income, age, education level, country and year fixed effects. Standard errors clustered at the country level. Abstainers are excluded from the sample.
∗p<0.1; ∗∗p<0.05; ∗∗∗p<0.01
Figure 7.6 shows that, in Western Europe, far-left and far-right voters both declare low levels of life satisfaction but are symmetrically positioned on high trust (far left) and low trust (far right) levels. This is consistent with our previous findings on political, economic, and cultural values. Anti-system ideology and institutional distrust are related to low life satisfaction but low life satisfaction alone is not sufficient to generate a populist far-right movement. The populist right requires the dimension of low interpersonal trust which is associated with anti-immigration and anti-redistribution attitudes.
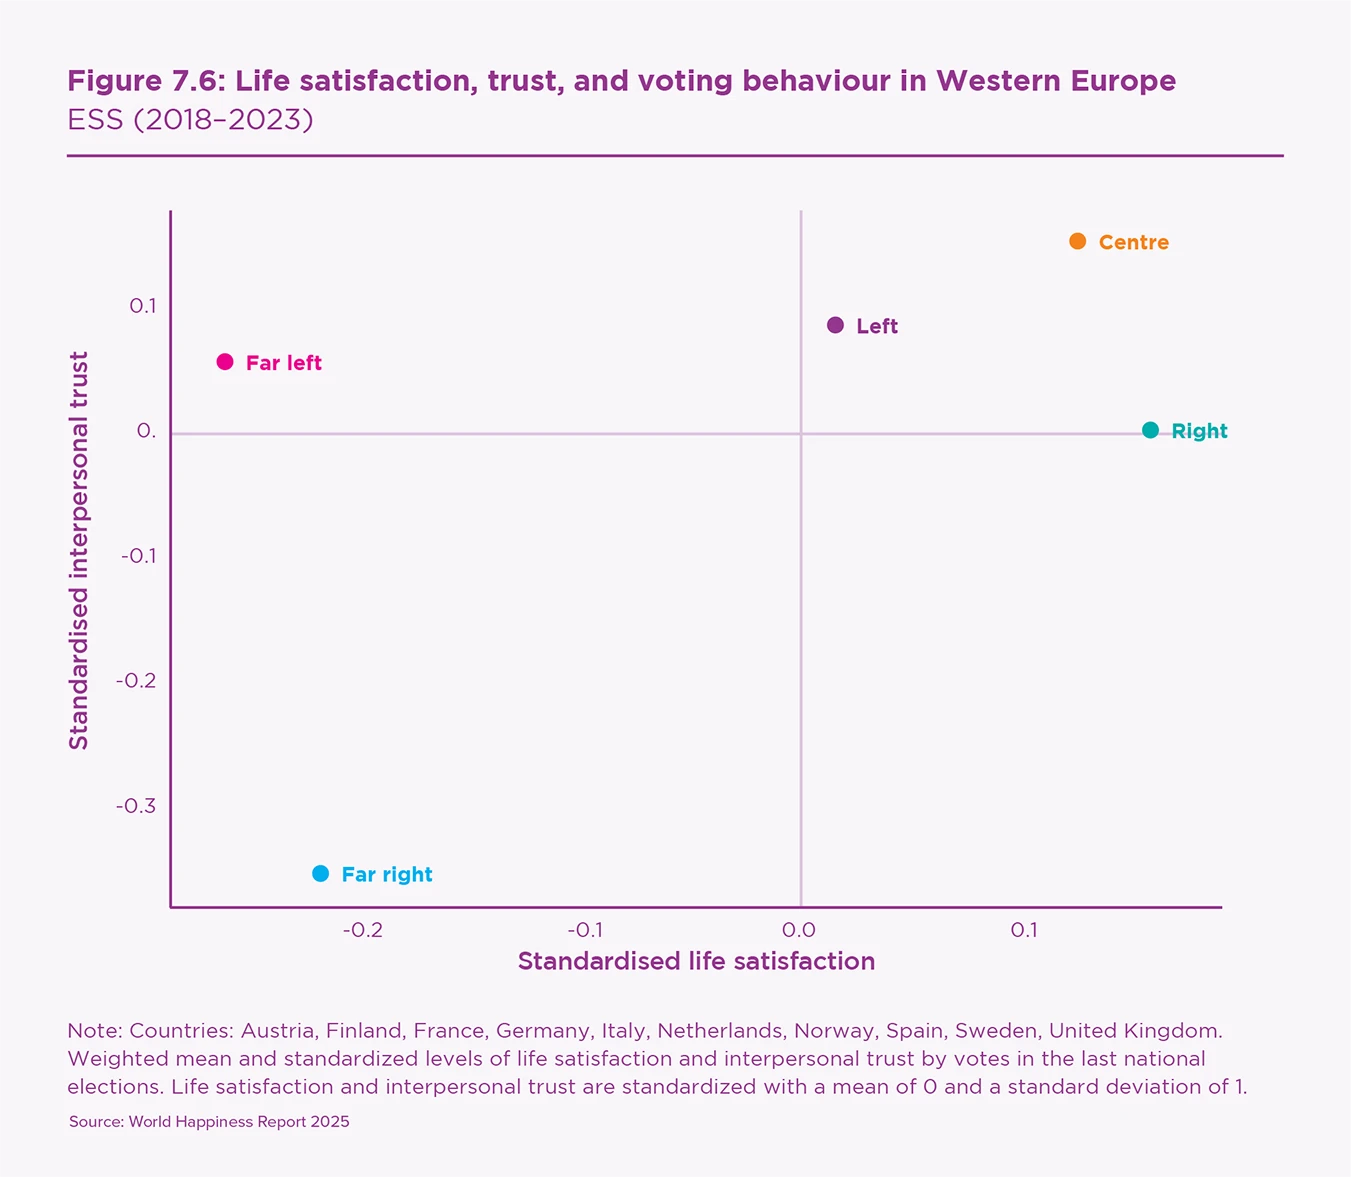
Figure 7.7 highlights these results for a selection of European countries from the south (Spain), the centre (France and Germany), and the north (Sweden). In all countries, far-right voters stand much lower on social trust measures than electors for any other political party. In general, voters for centre-right, or centre-left parties have above-average life satisfaction and social trust.
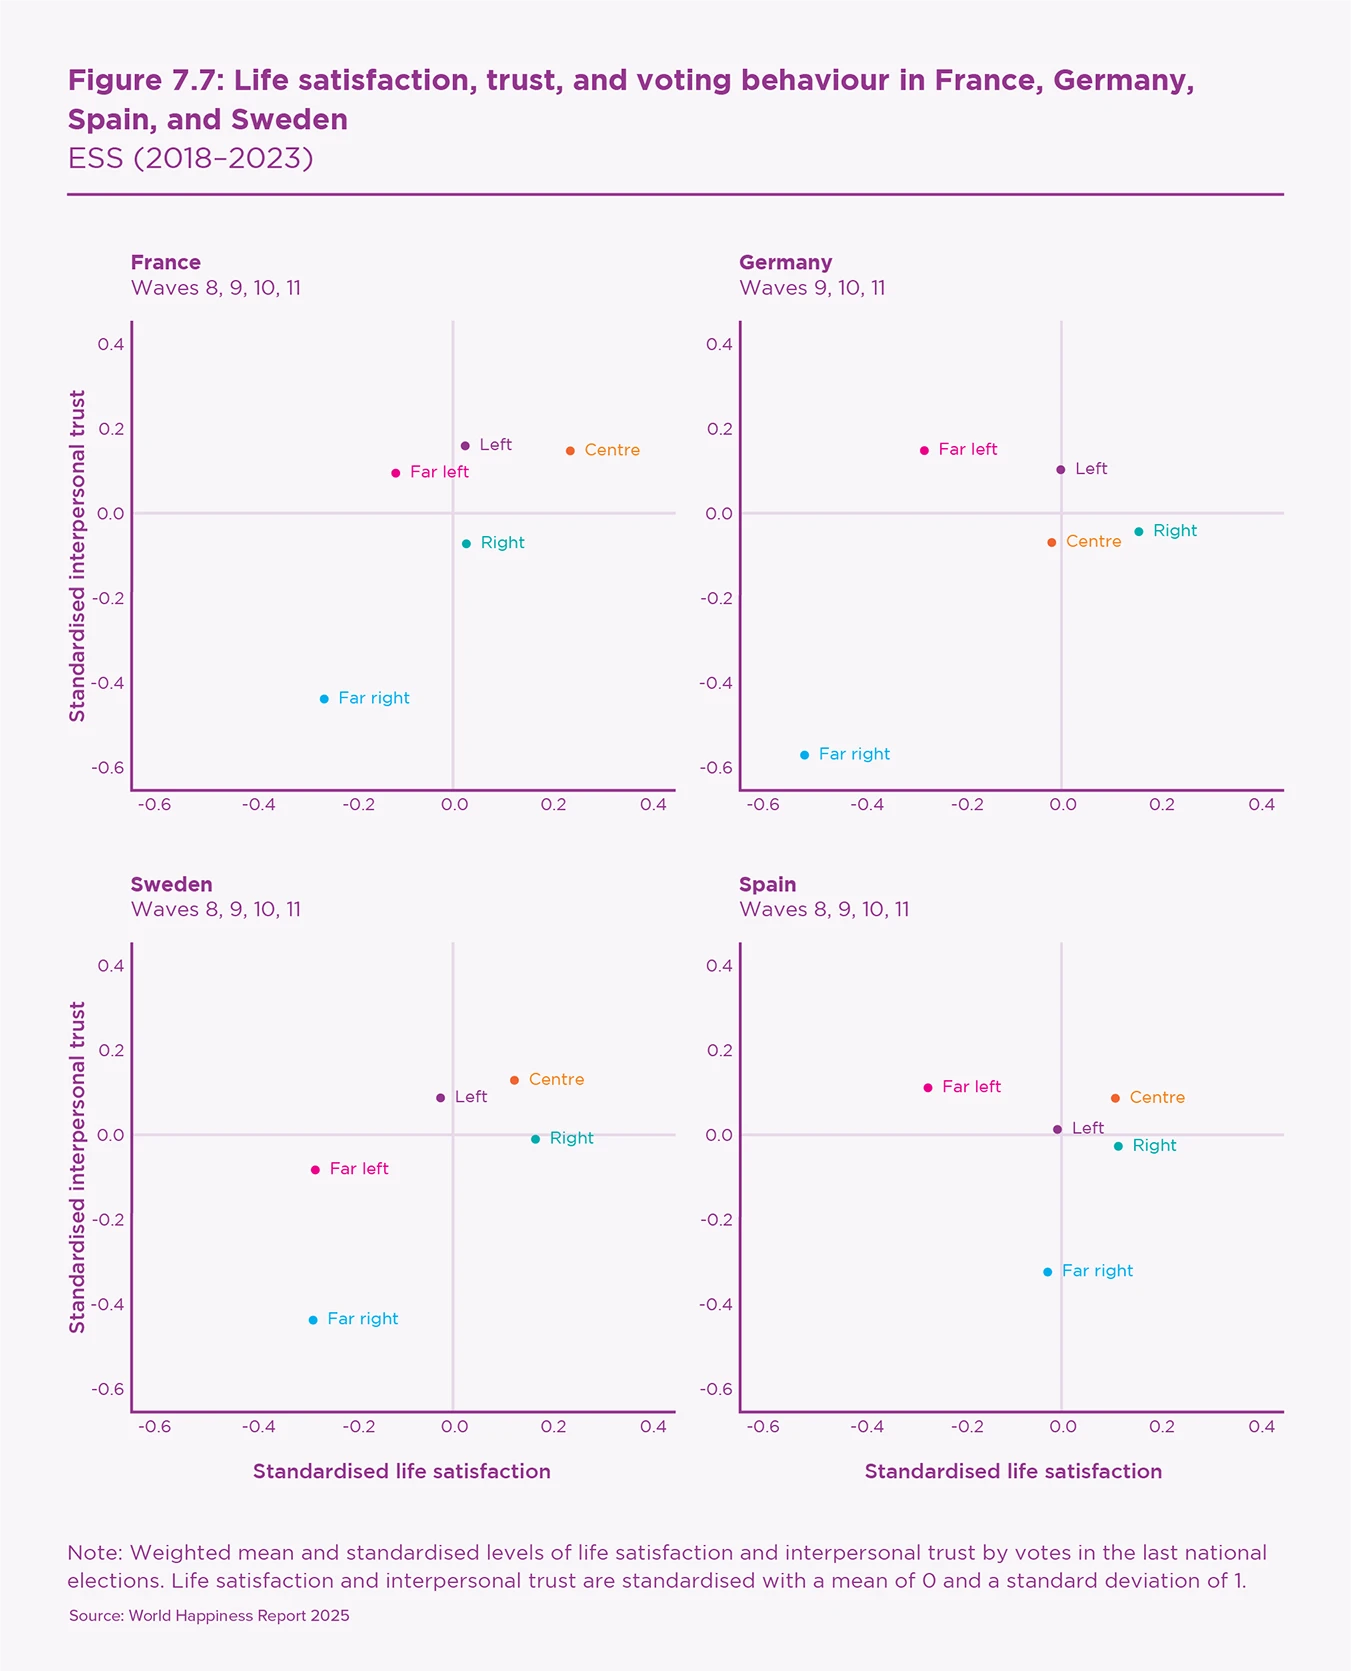
The French elections are a textbook illustration of our paradigm. There, both the far left (Mélenchon) and the far right (Le Pen) have prominent electorates (18–25% in the 2017 and 2022 presidential elections). Citizens with high interpersonal trust are more likely to vote for the left and those with lower trust are more likely to vote for the right. Le Pen and Mélenchon voters share a low level of life satisfaction but differ in terms of trust. The centre electorate is embodied by Emmanuel Macron, with high life satisfaction and high trust, which correspond to wealthier people with liberal and pro-European values. In contrast, those who vote for centre-right parties are satisfied with life (mainly due to their high income) but are less trusting. We find the same patterns among anti-system parties in Germany (Die Linke versus AfD ) and Spain (Podemos versus Vox).
United States
Our framework is more difficult to apply in the US bi-partisan system (Democrats versus Republicans) that protects the parties from splintering. When applying our framework, we uncover a great schism, not only between political parties but also between voters and abstainers, where the latter display the lowest levels of life satisfaction and interpersonal trust. In the US, this group of citizens, who can be considered as the anomic, are not represented by a party.
We focus specifically on the two presidential elections in 2016 and 2020 which are associated with the upsurge of votes for Trump. Although survey data on the 2024 elections are not available yet, we use data on voters’ preferences across candidates in the two previous primaries and general presidential elections.
In a multi-party system, voters can choose – or create – a party that corresponds to their preferences over several important dimensions. In a two-party system, the parties often take opposite positions on each salient policy issue, which eventually shapes the nature of polarisation: politicians and voters are divided along a single dimension which aggregates several issues. On the other hand, each of the two parties effectively represents a coalition of voters who support different policy stances on various dimensions. In our analysis, we try to identify such subgroups to understand their characteristics and their voting behaviour.
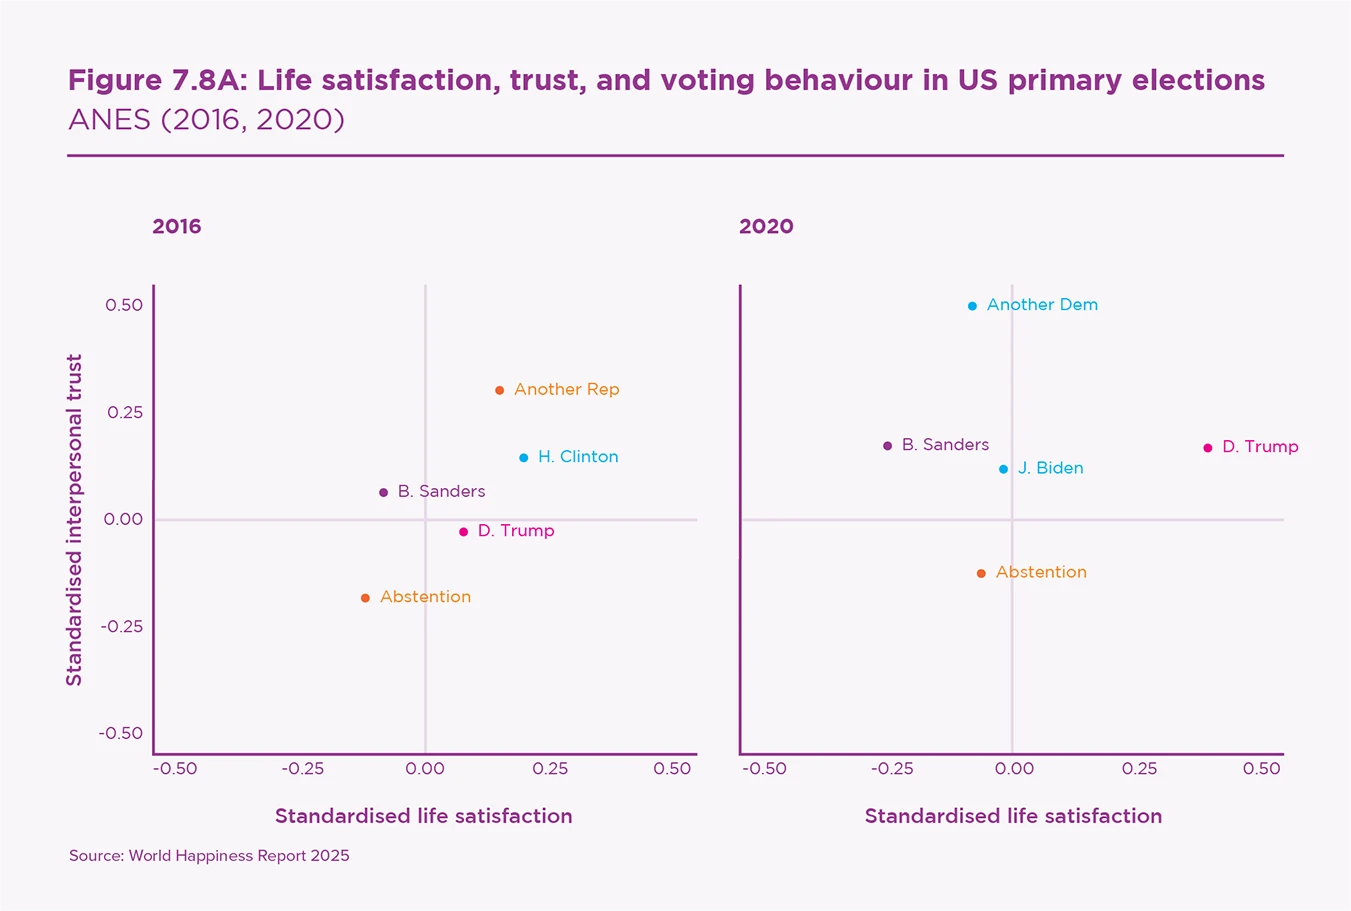
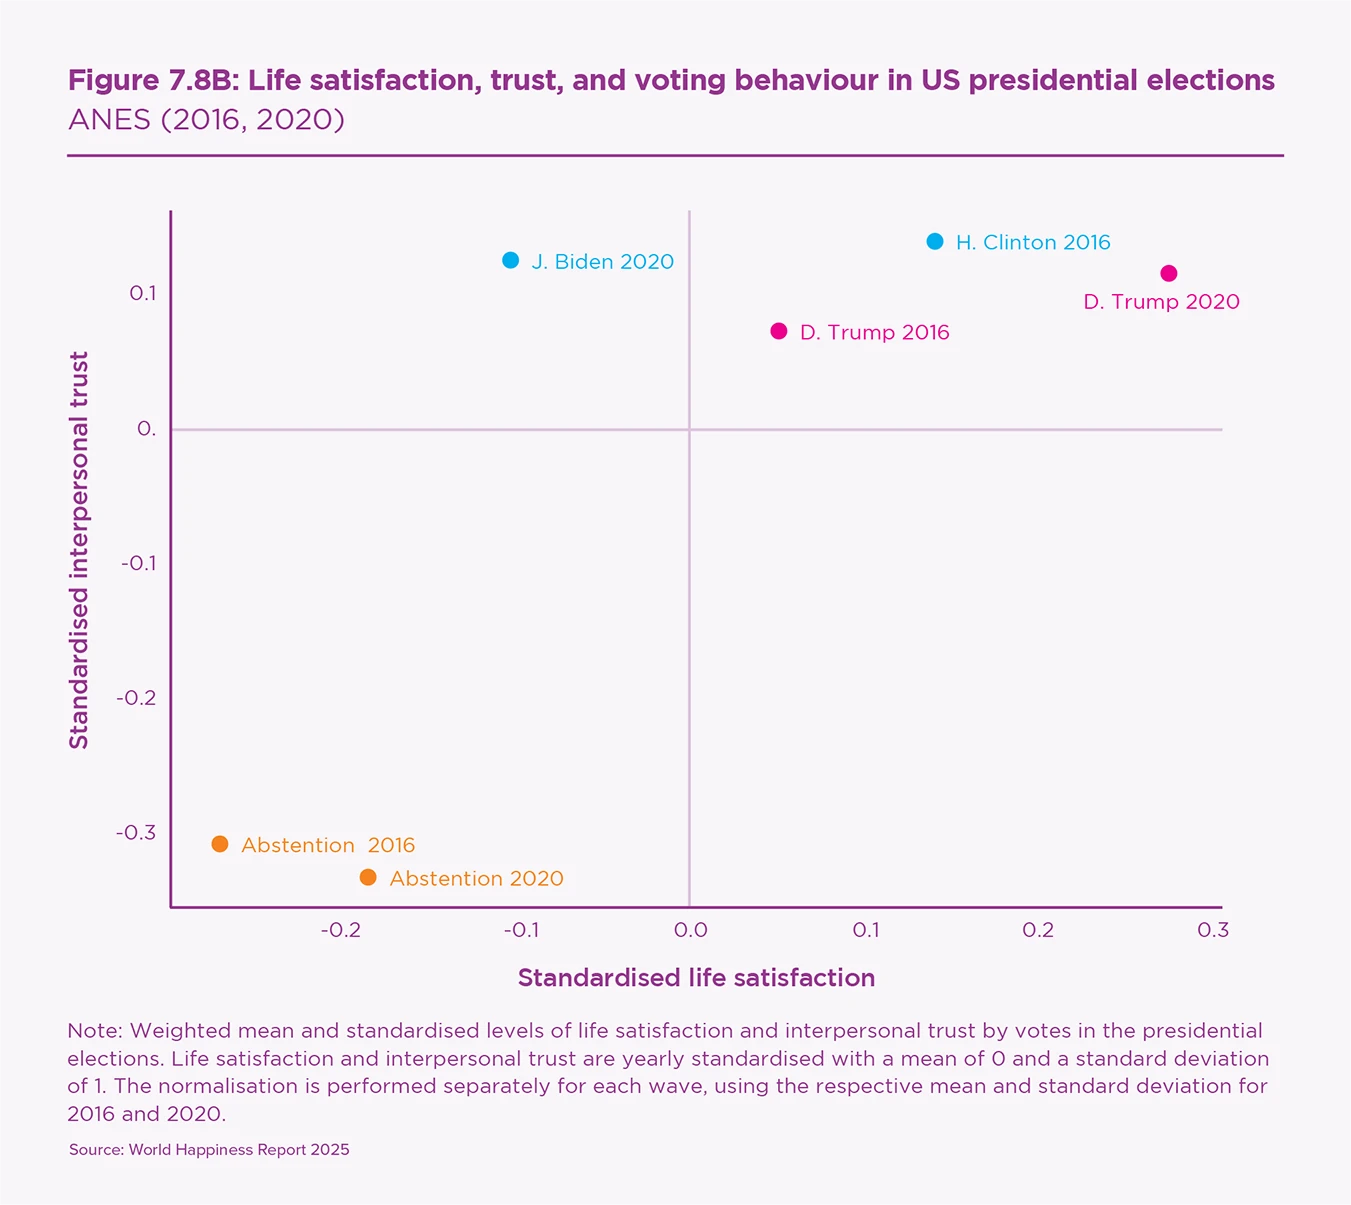
Figures 7.8A and 7.8B illustrate votes in 2016 and 2020 for primary and presidential elections.
In 2016, votes for Hillary Clinton were votes for the status quo, coming from people with high trust and high life satisfaction. Clinton voters are wealthier than the average (which is highly correlated with their life satisfaction) and their high level of trust makes them more favourable to immigration and globalisation. Sanders voters also express a higher level of trust than the average, but a lower level of life satisfaction. This pattern explains why they vote for a candidate whose main campaign motto was about the redistribution of income and taxation of the wealthiest. Trump voters displayed different features. Their level of life satisfaction is slightly higher than the national average (this is due to the composition of this electorate, combining both the white working and middle class and the wealthy ), but a low level of trust. This is consistent with both the anti-tax and anti-immigration platform of Trump.
In 2020, Donald Trump was the only Republican candidate. The rally of traditional wealthy Republican voters (who voted for other Republican candidates in the 2016 presidential primaries) explains this group’s above-average life satisfaction and average level of trust. By contrast, all Democrat voters displayed low life satisfaction and average or above-average levels of trust.
The most striking feature in the 2016 and 2020 US elections is the low levels of life satisfaction and trust of abstainers compared to voters. While in Europe, the ‘anomics’ turn to the far-right parties, in the US they withdraw from public life.
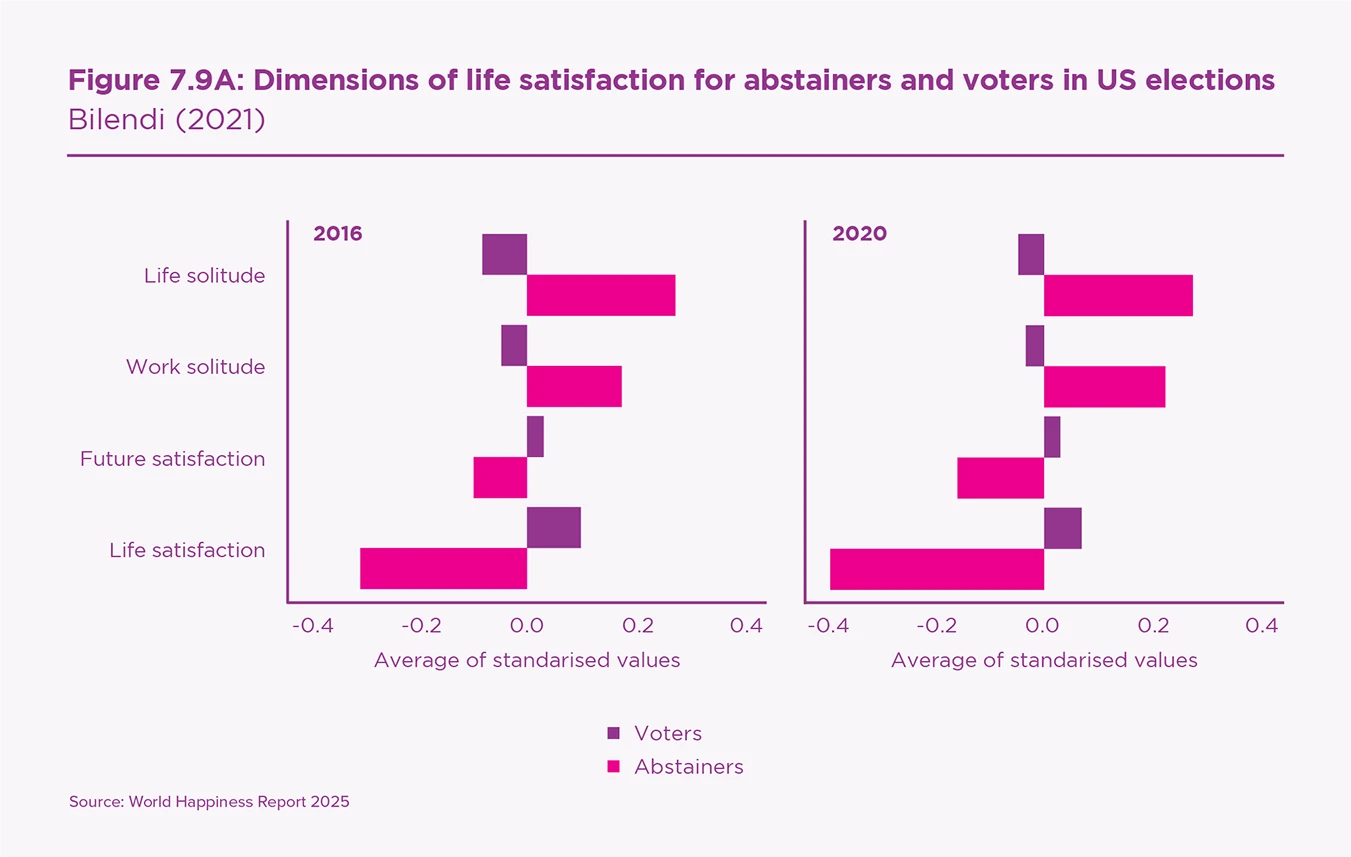
To dig deeper, we use a unique 2021 survey conducted by the market research company, Bilendi, on a representative sample of 15,000 US citizens. The survey asked about voting behaviour during the 2016 and 2020 presidential elections alongside specific questions on life satisfaction and various dimensions of trust and ideology.[19]
Figure 7.9A illustrates the schism between abstainers and voters across four dimensions of life satisfaction. Abstainers report higher solitude both at work and in life, lower life satisfaction, and less optimism for the future. The situation of abstentionists worsens between the two elections. Their life satisfaction is 31 percentage points lower than average in 2016, and this increases to 39 percentage points in 2020.
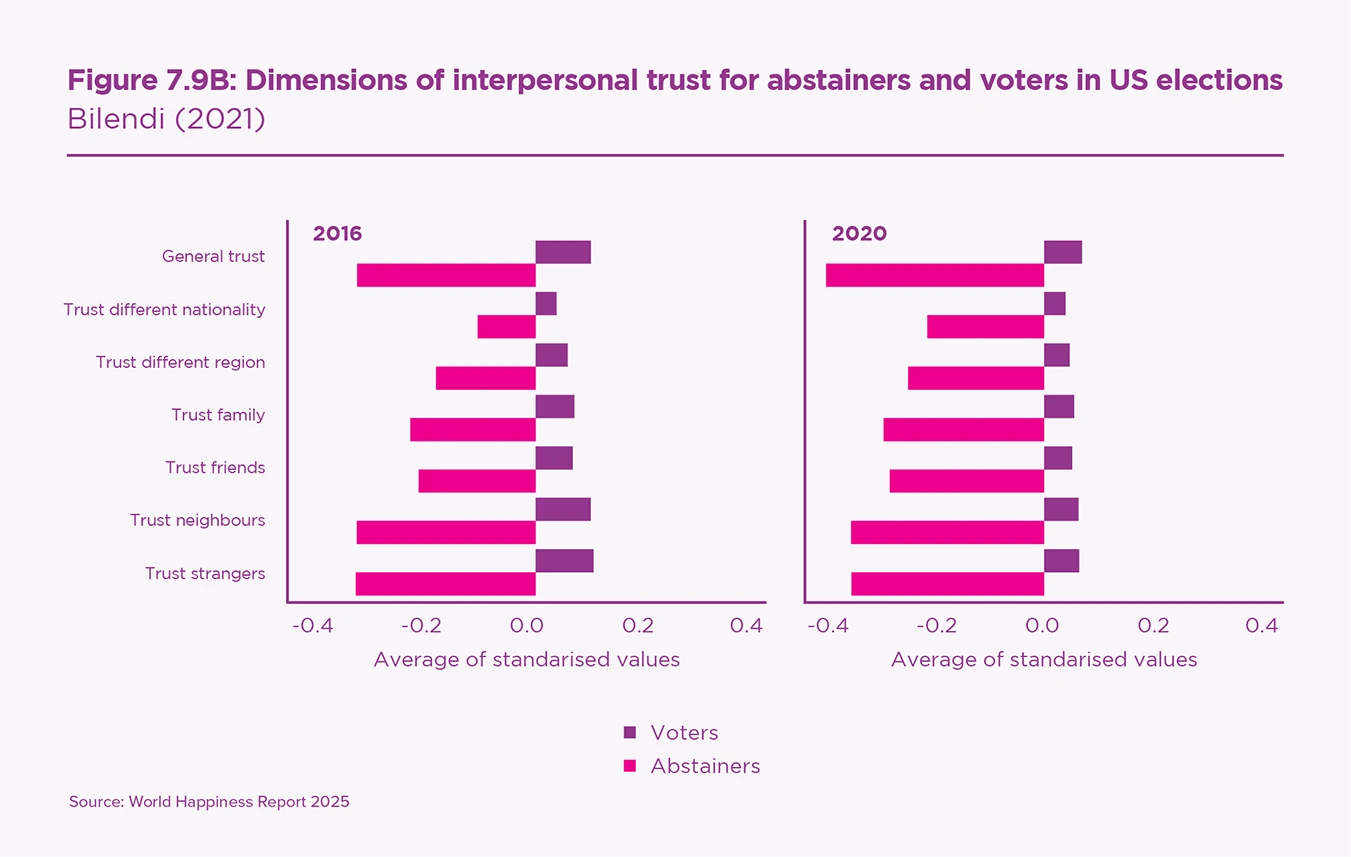
Figure 7.9B shows that abstainers have consistently lower trust than voters in every dimension. They tend to distrust their own family or friends (30 percentage points lower than the average) almost as much as strangers (36 percentage points) and others in general (41 percentage points).
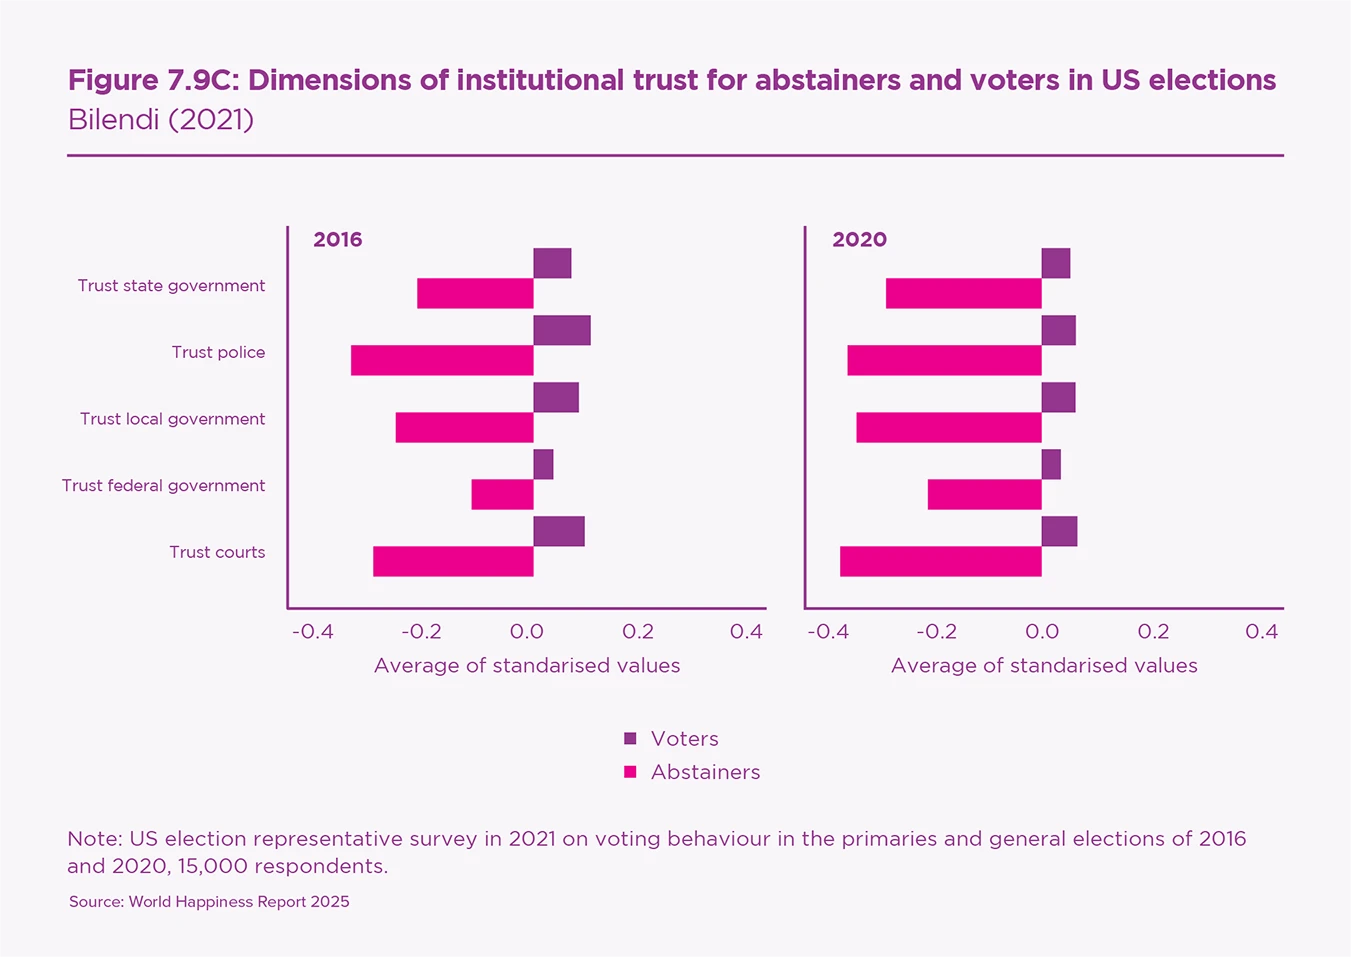
Figure 7.9C shows that abstainers display a specific distrust in institutions. In particular, they had lower than average trust in courts (39 percentage points), police (37 percentage points), and government (30 percentage points) in 2020. This dramatic low level of institutional trust has deteriorated between 2016 and 2020.
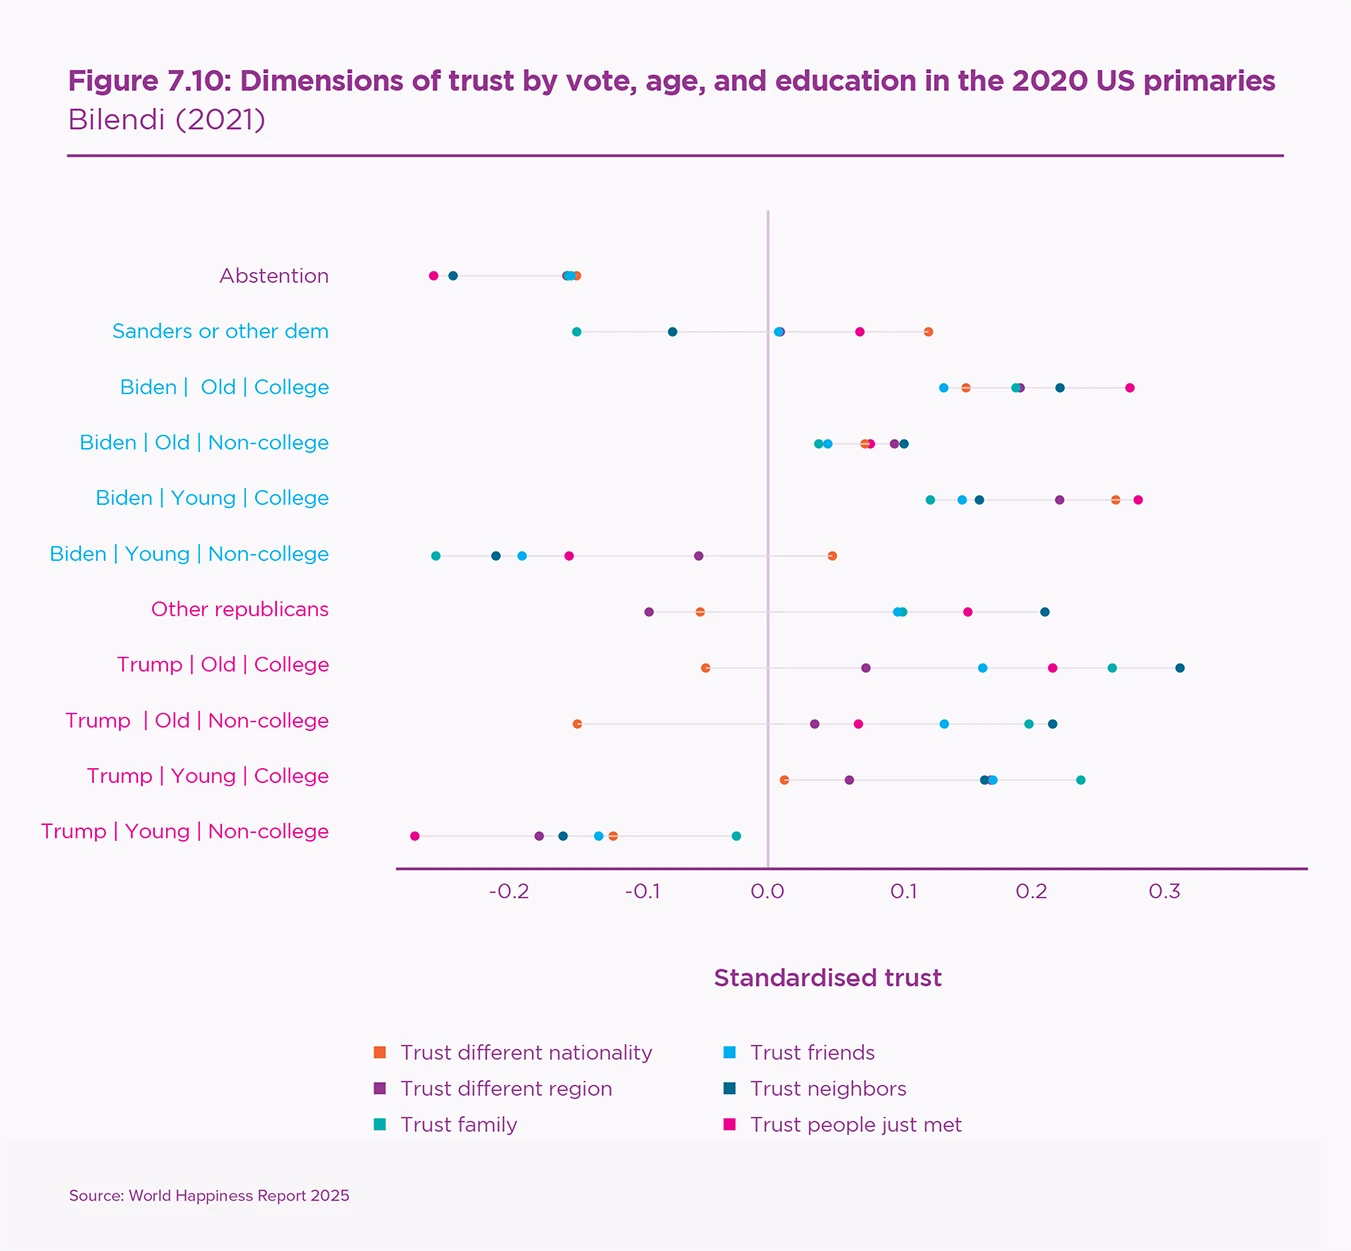
This pattern is quite different from the divide between Democrat and Republican voters. In Figure 7.10, we break down their level of trust by education (non-college versus college degree) and age (under 45 versus over 45). The most striking result concerns the differences between trust in one’s private circle (family, friends, and neighbours) and trust in open society. Democrat voters have a lower-than-average level of parochial trust, but a much higher-than-average level of trust in strangers. The picture is reversed among Trump voters. Strikingly, this result applies to all generations and education levels.
Values and political behaviour
Finally, we examine the link between economic or cultural values and political behaviour (the third arrow of Figure 7.2A).
Western Europe
Table 7.2A shows that all measures of political trust are negatively correlated with far left and far right positioning. Table 7.2B displays the expected relationship between support for income redistribution and equal opportunities versus political positioning and votes. In particular, the far left is more in favour of redistribution and the far right is less in favour compared to the centre. The table also shows the expected relationship between cultural attitudes and voting behaviour with the far right much less tolerant towards immigration and same-sex couples. In terms of magnitude, income redistribution matters much more for the low-satisfaction, high-trust voters of the far left and immigration is the obsession of the low-satisfaction, low-trust voters of the far right.
| Dependent variable | |||||
|---|---|---|---|---|---|
| Satisfaction democracy | Trust politicians | trust legal system | EU Integration | trust parliament | |
| (1) | (2) | (3) | (4) | (5) | |
| Far left | −1.337∗∗ | −0.589∗ | −0.787∗ | −0.285 | −0.836∗∗ |
| (0.432) | (0.298) | (0.343) | (0.333) | (0.307) | |
| Left | −0.153 | 0.100 | −0.102 | 0.224 | 0.109 |
| (0.435) | (0.317) | (0.270) | (0.323) | (0.327) | |
| Centre (Baseline) | |||||
| Right | −0.290 | −0.121 | −0.277 | −0.491 | −0.151 |
| (0.349) | (0.261) | (0.234) | (0.395) | (0.319) | |
| Far right | −1.780∗∗∗ | −1.286∗∗∗ | −1.589∗∗∗ | −2.101∗∗∗ | −1.558∗∗∗ |
| (0.477) | (0.322) | (0.209) | (0.154) | (0.378) | |
| Observations | 31,606 | 31,657 | 31,648 | 31,067 | 31,616 |
| R2 | 0.165 | 0.176 | 0.176 | 0.158 | 0.163 |
| Adjusted R2 | 0.164 | 0.176 | 0.175 | 0.158 | 0.162 |
| Residual Std. Error | 2.354 (df = 31573) | 2.212 (df = 31624) | 2.406 (df = 31615) | 2.593 (df = 31034) | 2.408 (df = 31583) |
| Dependent variable | |||||
|---|---|---|---|---|---|
| Gays and lesbians free to live | Immigration good for economy | Cultural life enriched by immigrants | Government should reduce income inequalities | Equality of opportunities | |
| (1) | (2) | (3) | (4) | (5) | |
| Far left | 0.318∗∗ | 0.672∗ | 0.993∗∗∗ | 0.607∗∗∗ | 0.196∗∗∗ |
| (0.109) | (0.295) | (0.266) | (0.073) | (0.037) | |
| Left | 0.182∗∗ | 0.329∗∗∗ | 0.555∗ | 0.355∗∗∗ | 0.158∗∗∗ |
| (0.057) | (0.087) | (0.273) | (0.065) | (0.035) | |
| Centre (Baseline) | – | – | – | – | – |
| Right | −0.454∗∗∗ | −0.486∗∗ | −0.352 | −0.135 | −0.133∗∗ |
| (0.094) | (0.162) | (0.295) | (0.119) | (0.047) | |
| Far right | −0.671∗∗∗ | −2.188∗∗∗ | −2.180∗∗∗ | −0.006 | −0.216∗∗∗ |
| (0.119) | (0.193) | (0.124) | (0.073) | (0.041) | |
| Observations | 31,647 | 31,780 | 31,780 | 31,633 | 22,768 |
| R2 | 0.160 | 0.016 | 0.031 | 0.112 | 0.068 |
| Adjusted R2 | 0.159 | 0.015 | 0.030 | 0.111 | 0.067 |
| Residual Std. Error | 1.910 (df = 31614) | 9.046 (df = 31747) | 7.955 (df = 31747) | 0.988 (df = 31600) | 1.026 (df = 22735) |
Note: Weighted least squares. Additional controls: gender, income, age, education level, country and year fixed effects. Standard errors clustered at the country level.
∗p<0.1; ∗∗p<0.05; ∗∗∗p<0.01
United States
Similarly in the US case, Trump voters oppose income redistribution and are generally against government intervention. They are also much less supportive of immigration and much less tolerant towards homosexuality (Table 7.3).
| Dependent variable | |||||
|---|---|---|---|---|---|
| Satisfaction with democracy | Immigration is good for US economy | America’s culture is not harmed by immigrants | LBGT couples should be allowed to adopt | Government should reduce income inequalities | |
| (1) | (2) | (3) | (4) | (5) | |
| Trump | 0.162∗ | −0.875∗∗∗ | −1.025∗∗∗ | −1.281∗∗∗ | −2.602∗∗∗ |
| (0.093) | (0.091) | (0.098) | (0.159) | (0.141) | |
| Constant | 4.847∗∗∗ | 6.469∗∗∗ | 6.634∗∗∗ | 10.258∗∗∗ | 5.832∗∗∗ |
| (0.208) | (0.203) | (0.220) | (0.355) | (0.316) | |
| Observations | 3,604 | 3,611 | 3,613 | 3,604 | 3,624 |
| R2 | 0.019 | 0.051 | 0.069 | 0.050 | 0.131 |
| Adjusted R2 | 0.017 | 0.049 | 0.067 | 0.048 | 0.130 |
| Residual Std. Error | 2.676 (df = 3595) | 2.612 (df = 3602) | 2.826 (df = 3604) | 4.567 (df = 3595) | 4.056 (df = 3615) |
| F Statistic | 8.932∗∗∗ (df = 8; 3595) | 24.011∗∗∗ (df = 8; 3602) | 33.610∗∗∗ (df = 8; 3604) | 23.565∗∗∗ (df = 8; 3595) | 68.409∗∗∗ (df = 8; 3615) |
Note: Weighted least squares. Additional controls: gender, income, age, education level. “Trump” is a binary variable equal to 1 when an individual voted for Trump in the 2020 presidential primary election and 0 otherwise.
∗p<0.1; ∗∗p<0.05; ∗∗∗p<0.01
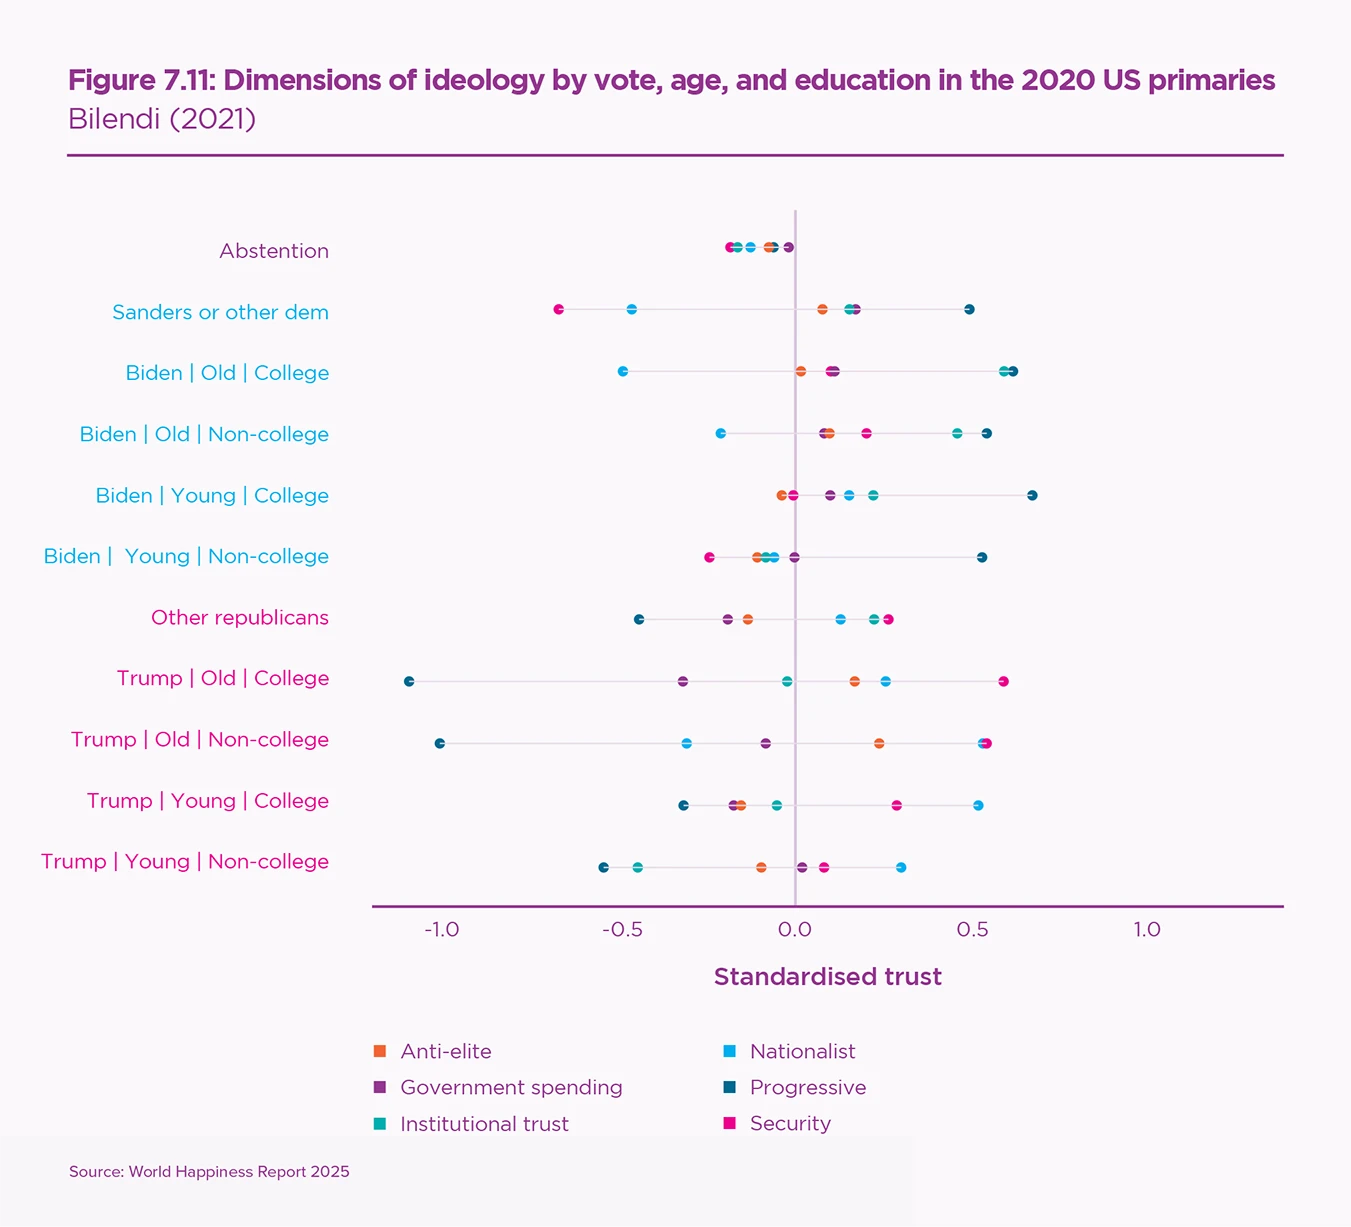
Figure 7.11 details these ideological patterns for the 2020 US primary elections across six ideological dimensions: nationalist is measured with questions about anti-immigration and protectionism; progressive measures support for homosexuality, affirmative actions, and gun controls; security measures support for spending on police and defence; anti-elite measures negative attitudes towards experts, scientists, MPs, and judges; government spending measures attitudes towards taxes on millionaires, income redistribution, and reduction of income inequalities; and institutional trust measures trust in institutions and science and whether elections are fair. Democrat voters are much more in favor of immigration, sexual minorities, redistribution, and much less anti-elite and pro-security than the average. Trump voters display the exact opposite cultural and economic values. This pattern of attitudes holds irrespective of socio-demographics and are well captured by life satisfaction and interpersonal trust.
Time trends
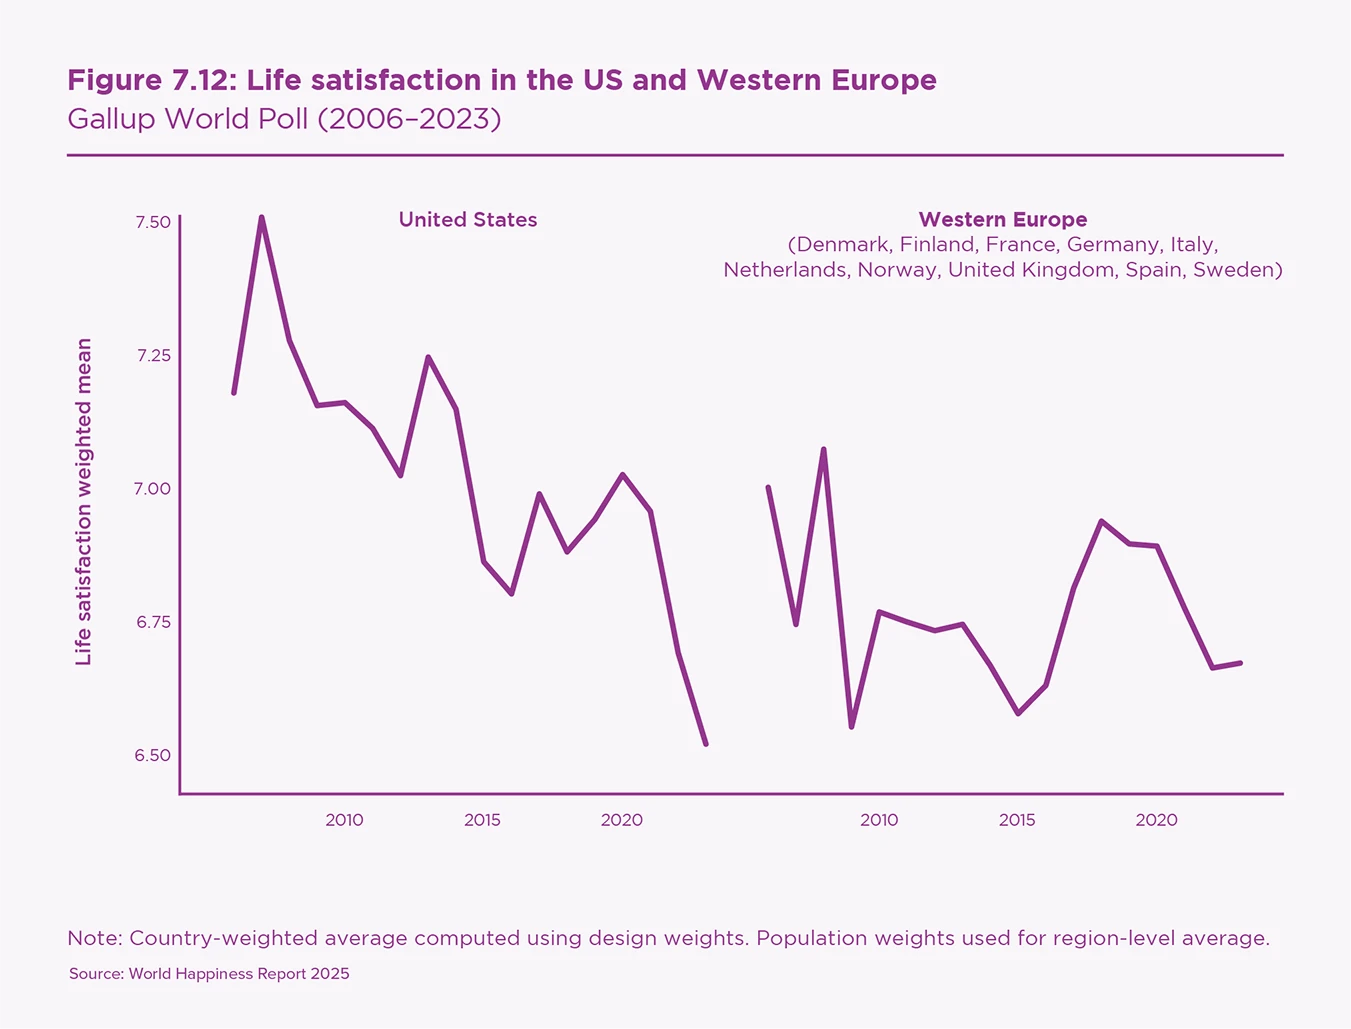
We started this chapter by noting the rising support for far-right and far-left parties and then sketching the patterns relating subjective attitudes and economic and cultural values with political votes. Therefore, we expect to observe parallel trends in the evolution of these variables over time. Figure 7.12 shows a sharp fall in life satisfaction in the US, already documented in World Happiness Report 2023. The trend is less clear in Western Europe where the initial level of life satisfaction is lower.
It is important to underline that this fall in life satisfaction is not driven by income. To illustrate this, each dot in Figure 7.13 plots life satisfaction and GDP per capita (adjusted for inflation) since 2006. The association between income and life satisfaction is usually found to be positive in the short run, but better represented by a flat trend in the long run.[20] But here, in the 2000s, the association is negative. The time trend in life satisfaction is clearly decreasing in the United States, although GDP per capita is rising over time. The picture is similar in European countries, especially since the 2020s, where GDP per capita is rising, but happiness is decreasing on average and in most European countries.
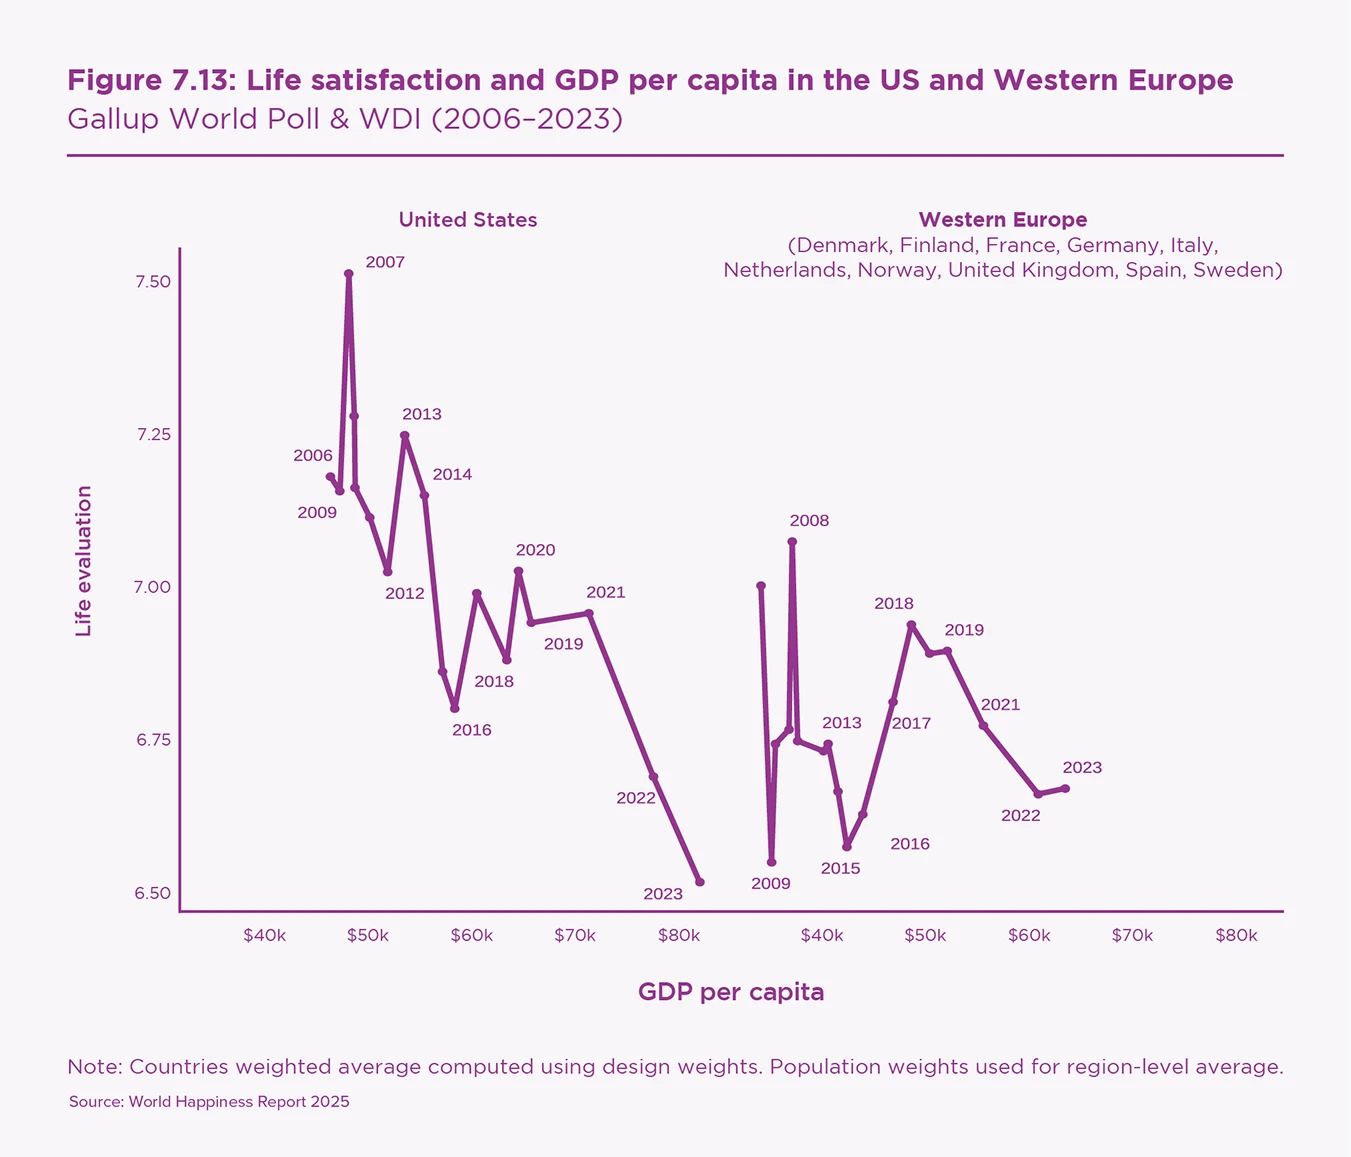
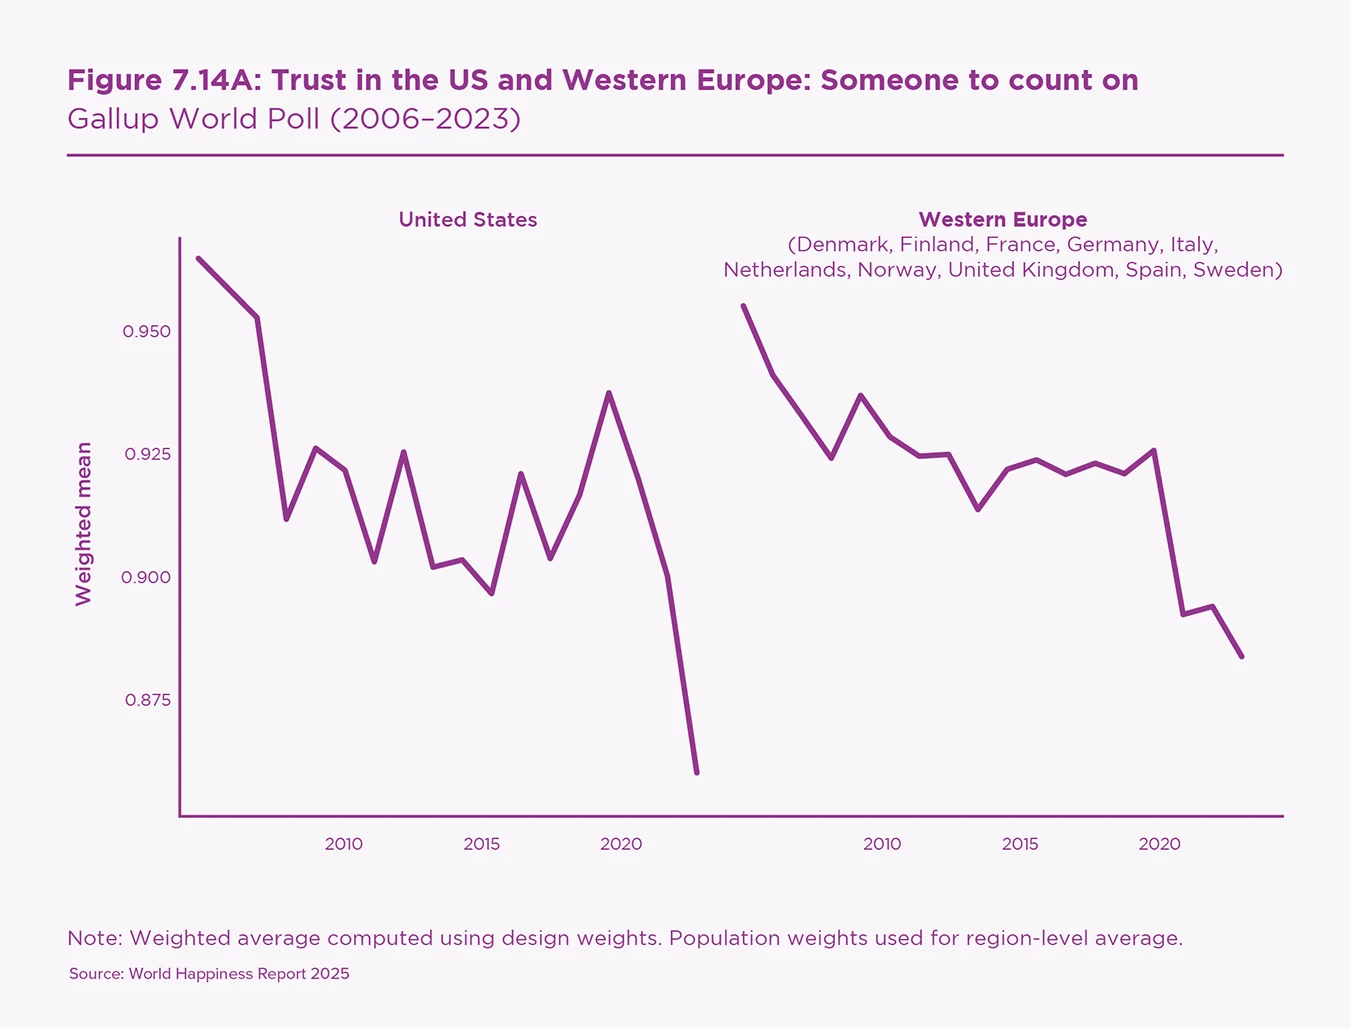
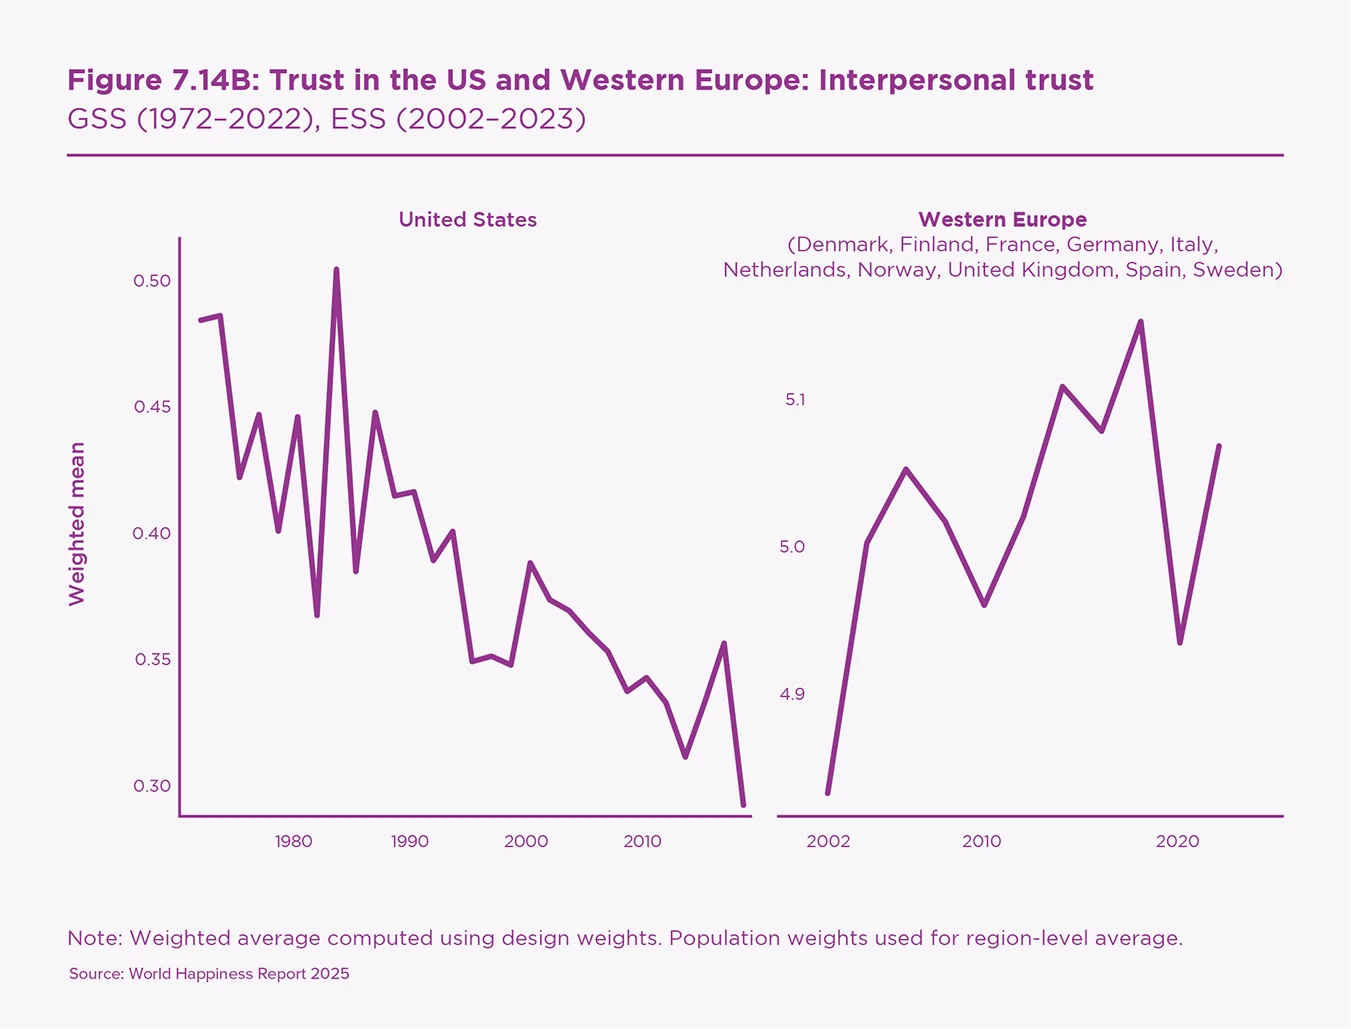
Figure 7.14A shows that social trust is also clearly decreasing in the US and Western Europe, with a drop of 10 percentage points in the two continents over the period. Even more strikingly, in Figure 7.14B we see that the percentage of people in the US who trust others has decreased by 20 percentage points since the early 1970s, from 50% to 30%. The evidence is more mixed in Europe, pointing to overall stability.
The sharp drop in social trust in the US is consistent with the fact that rising unhappiness has shifted voters almost exclusively towards the populist right (Donald Trump), and not towards the left (Bernie Sanders). The relative decline or stability in social trust in Europe is consistent with the fact that the decline in life satisfaction has split the unsatisfied electorate between the two opposite extremes of the political spectrum, depending on their level of social trust. Therefore, the next section investigates which groups of citizens have experienced the most significant variation in life satisfaction and social trust, in order to understand the evolution of anti-system voting behaviour.

Population sub-groups
The trends in attitudes, values, and voting behaviour that we have described are particularly pronounced among certain groups of the population. This sheds additional light on the underlying factors shaping the rise in anti-system votes.
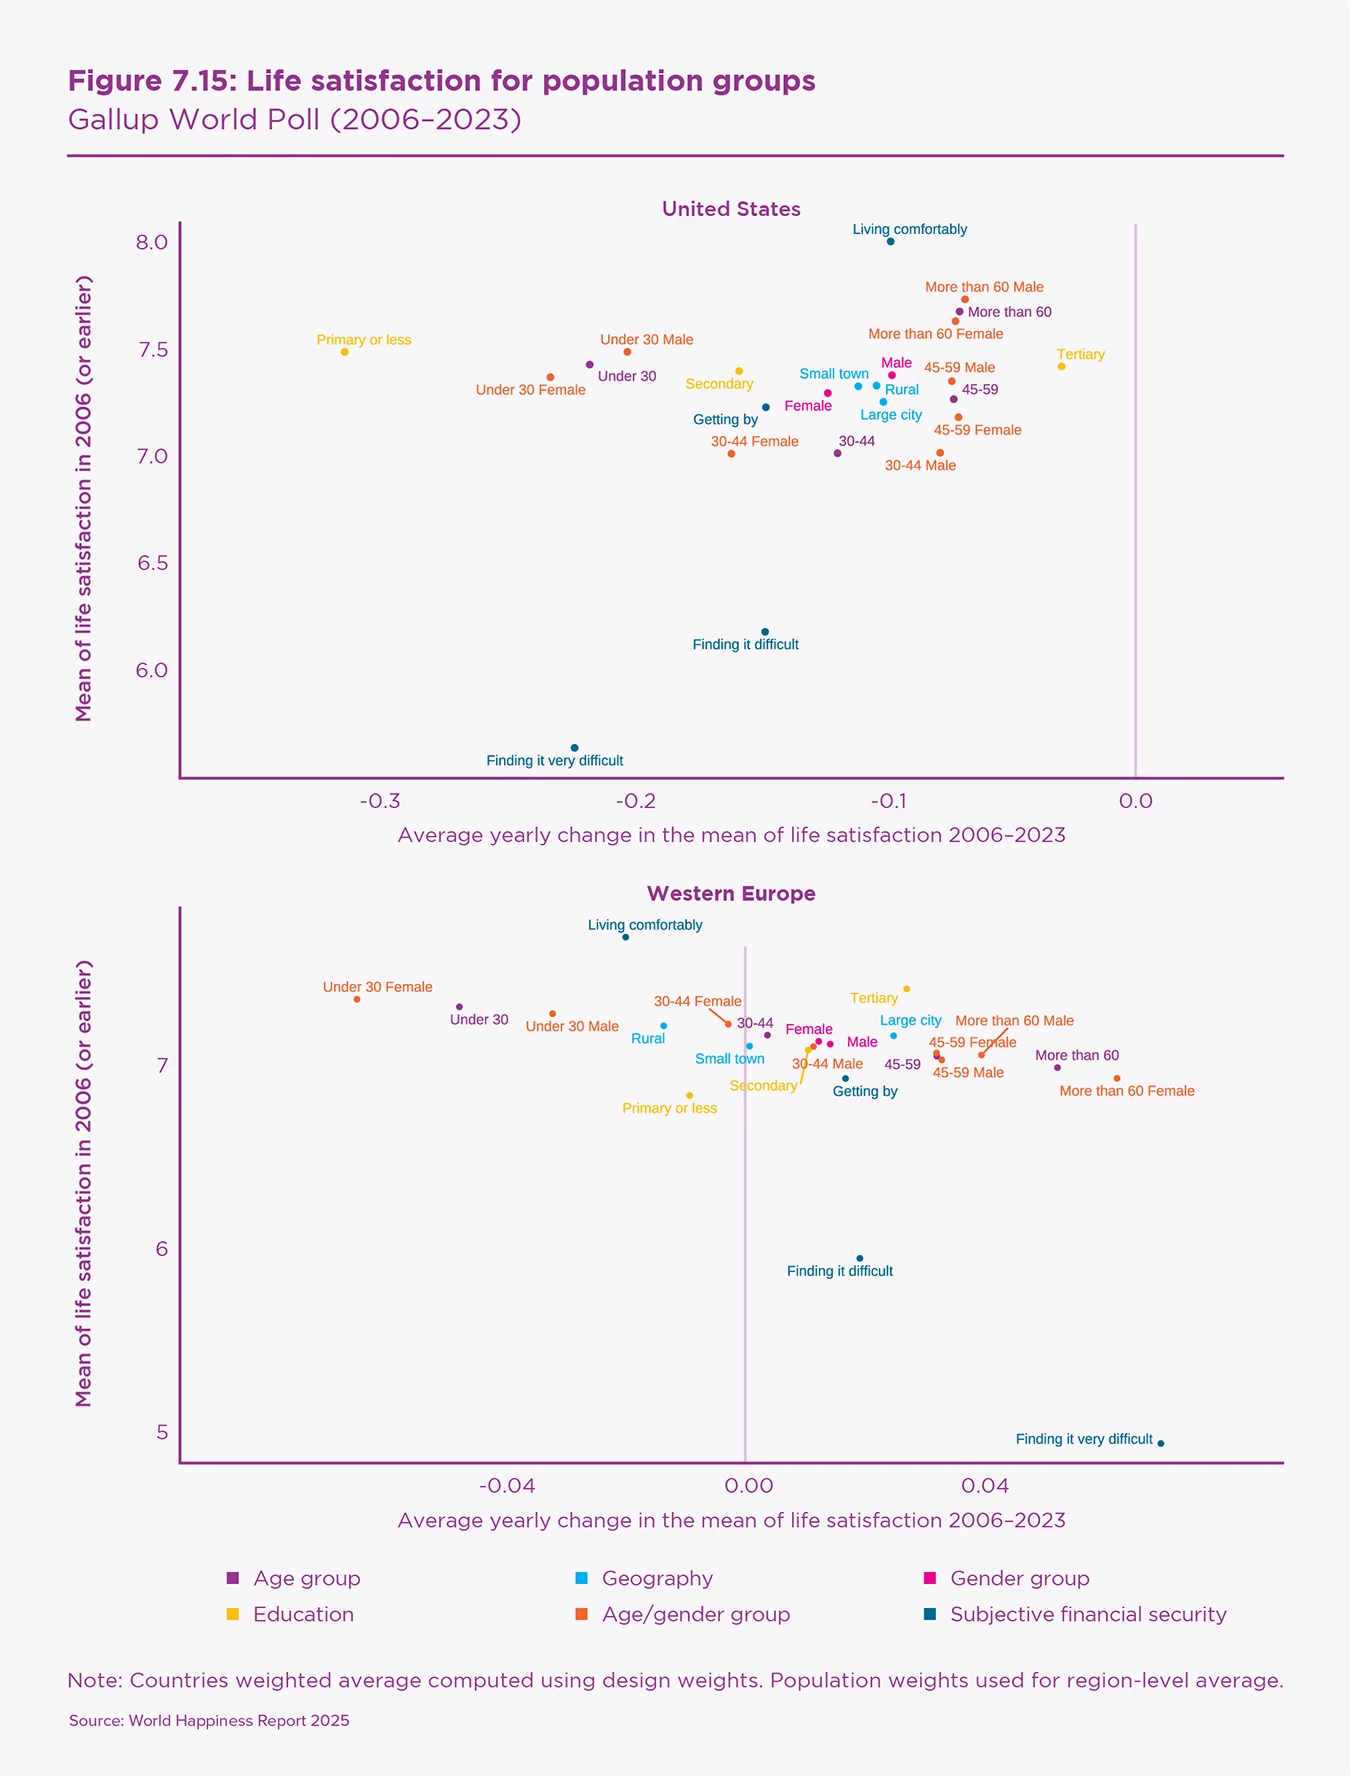
Figure 7.15 displays the average change in life satisfaction for different population groups based on age, gender, education, economic status, and geography. The groups with increasing life satisfaction stand to the right of the dotted vertical bar and the groups with decreasing satisfaction stand to the left. The vertical axis shows the initial level of life satisfaction measured in 2006. The downward trend in life satisfaction is particularly steep among young people under 30, especially women, both in Western Europe and the United States, as already underlined in World Happiness Report 2024.
In terms of social trust, Figure 7.16 shows that, in the US, the average yearly change is negative for all groups, especially for people aged 30–44.
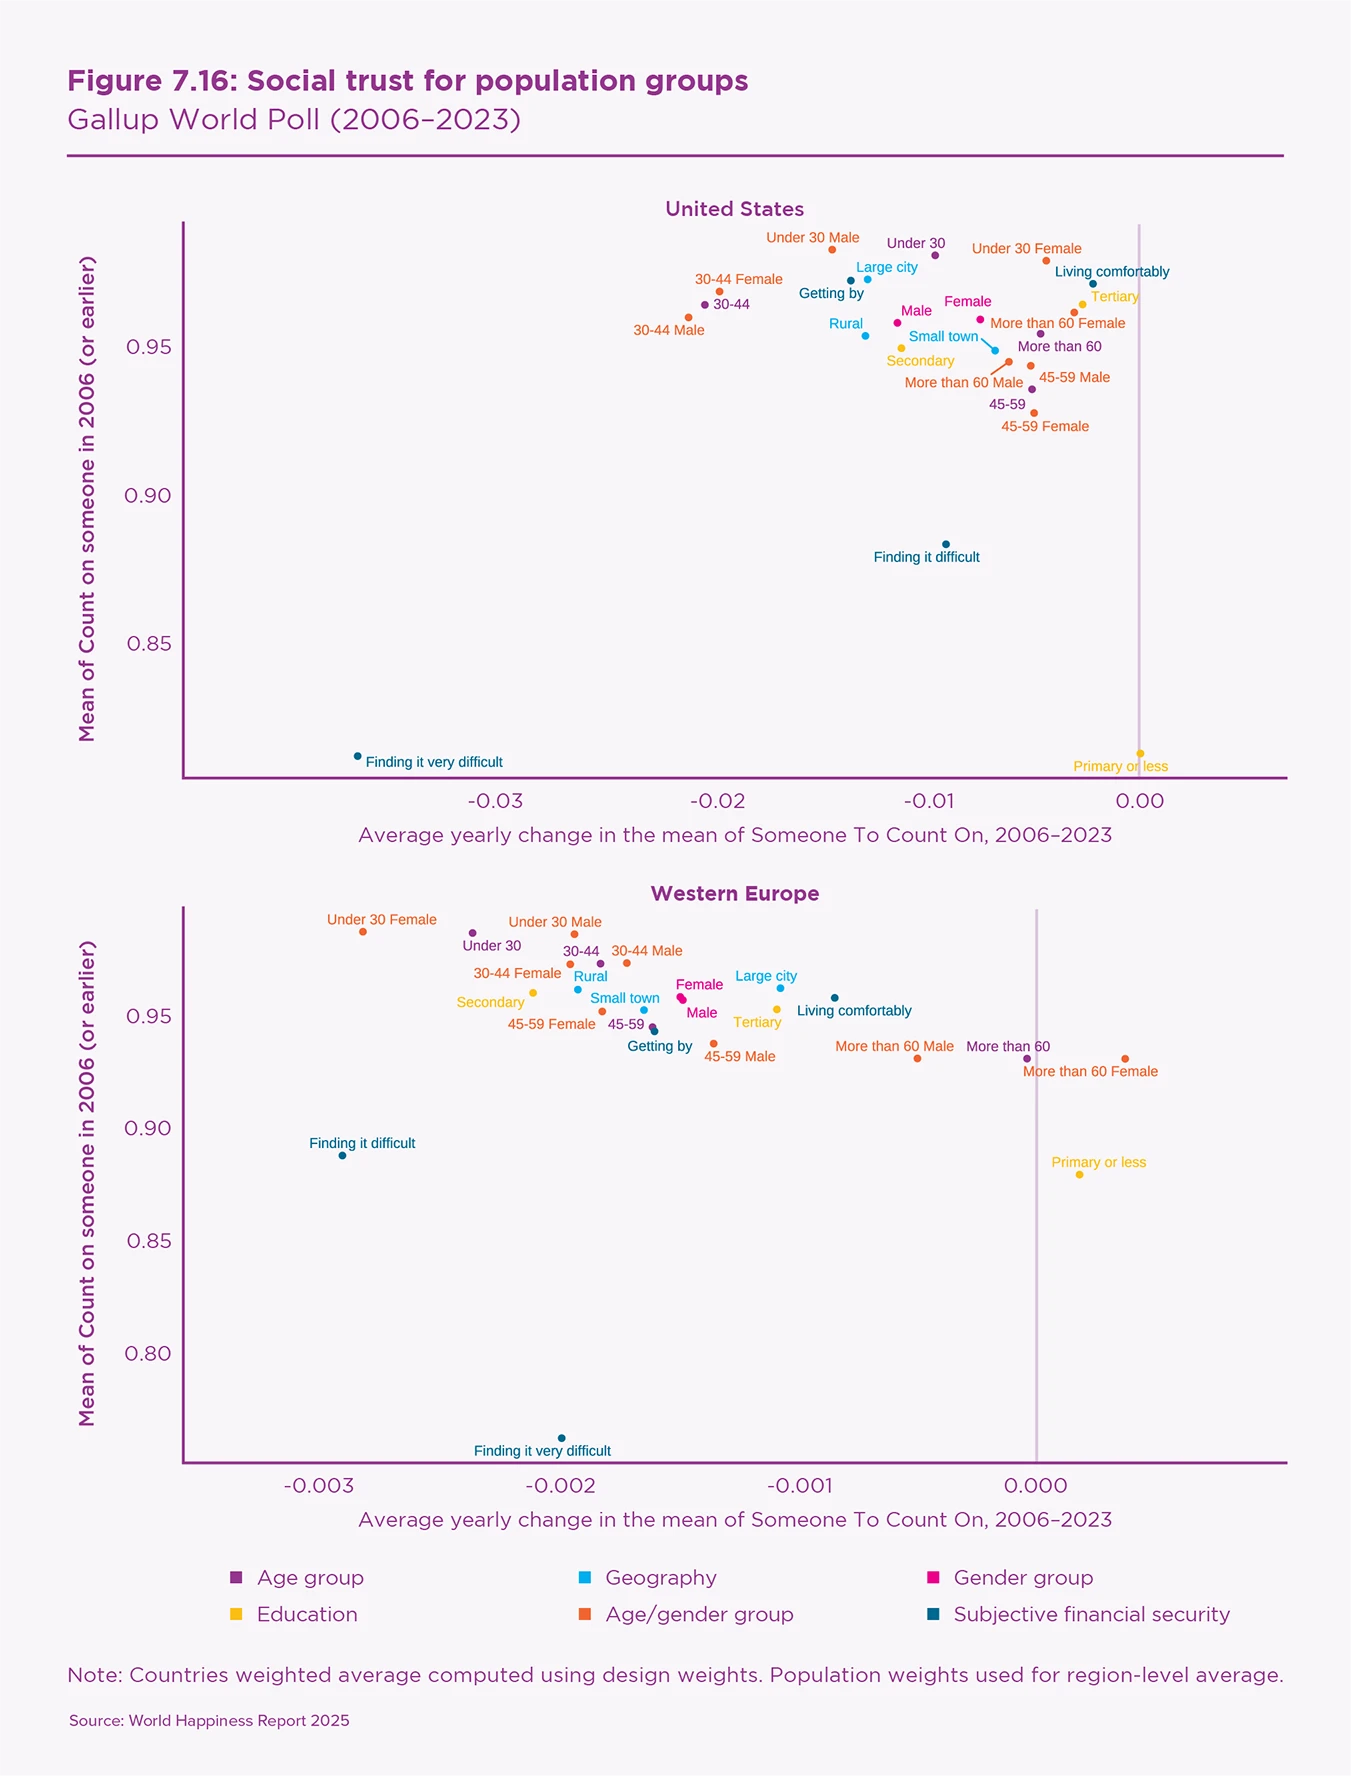
Figures 7.15 and 7.16 also illustrate the importance of financial difficulties. A very strong gradient opposes those who live comfortably on their income and those who find it difficult or very difficult. Education level also makes a difference. People with primary or secondary education endure a larger fall in life satisfaction than those with tertiary education. These are the groups that have shifted to anti-system votes.

Conclusion
In this chapter, we have documented a parallel fall in life satisfaction and social trust and its relationship with the rise in anti-system votes since the early 2000s. We propose a model of the relationships between three blocs of attitudes: (i) life satisfaction and social trust, (ii) cultural, political, and economic values, and (iii) voting behaviour. We show that low life satisfaction comes with anti-system attitudes while people’s level of social trust determines their orientation towards anti-system parties at the left or the right. In Europe, citizens with low life satisfaction and low social trust, the ‘anomics’, tend to vote for far-right parties. In the context of the US two-party system, they tend to abstain and withdraw from public life.
The fall in life satisfaction cannot be explained by economic growth, at least not by average national income, as GDP per capita has been on the rise in the US and Western Europe since the mid-2000s. Rather, it could be blamed on the feelings of financial insecurity and loneliness experienced by Americans and Europeans – two symptoms of a damaged social fabric. It is driven by almost all social categories, but in particular, by the rural, the less-educated, and, quite strikingly, by the younger generation. This low level of life satisfaction is a breeding ground for populism and the lack of social trust is behind the political success of the far right.
References
Alabrese, E., Becker, S. O., Fetzer, T., & Novy, D. (2018). Who voted for Brexit? Individual and regional data combined. European Journal of Political Economy, In press (available online August 2018).
Algan, Y., Cahuc, P., & Sangnier, M. (2016). Trust and the Welfare State: The Twin Peaks curve. The Economic Journal, 126(593), 861–883.
Algan, Y., Guriev, S., Papaioannou, E., & Passari, E. (2017). The European Trust Crisis and the Rise of Populism. Brookings Papers on Economic Activity, 309–382.
Algan, Y., Beasley, E., Cohen, D., & Foucault, M. (2018) The Rise of Populism and the Collapse of the Left-Right Paradigm: Lessons from the 2017 French Presidential Election. CEPR Discussion Paper No. DP13103.
Algan, Y., Beasley, E., Cohen, D. & Foucault, M. (2019). Les Origines du Populisme, Editions du Seuil
Algan, Y. & Renault, T. (2024). La France sous nos tweets. Cepremap working paper.
Autor, D., Dorn, D., Hanson, G., & Majlesi, K. (2020). Importing Political Polarization? The Electoral Consequences of Rising Trade Exposure. American Economic Review, 110(10), 3139–3183.
Art, D. (2011). Inside the radical right: The development of anti-immigrant parties in Europe. Cambridge University Press.
Bonomi, G, Gennaioli, N. & Tabellini, G. (2021). Identity, Beliefs and Political Conflicts, The Quarterly Journal of Economics
Colantone, I., & Stanig, P. (2018). Global Competition and Brexit. American Political Science Review, 112(2), 201–218.
Coleman, S. (1996). The Minnesota Income Tax Compliance Experiment State Tax Results. Minnesota Department of Revenue.
De Neve, J.-E., Dugan, A., Prati, A., & Kaats, M. (2025). Sharing Meals, Social Connections, and Happiness Around the World. World Happiness Report 2025.
Easterlin, R. A. (1974). Does economic growth improve the human lot? Some empirical evidence. In P. A. David & M. W. Reder (Eds.), Nations and Households in Economic Growth: Essays in Honor of Moses Abramowitz (pp. 89-125). New York: Academic Press, Inc.
Easterlin, R. A. (1995). Will Raising the Incomes of All Increase the Happiness of All? Journal of Economic Behavior and Organization, 27(1) 35-48.
Enke, B. (2020). Moral Values and Voting. Journal of Political Economy, 128(10), 3679–3729. https://doi.org/10.1086/708857
Fehr, E. & Gachter, S. (2000). Cooperation and punishment in public goods experiments. American Economic Review, 90(4), 980-994.
Funke, M., Schularick, M., & Trebesch, C. (2023). Populist Leaders and the Economy. American Economic Review, 113(12), 3249–3288.
Golder, M. (2016). Far right parties in Europe. Annual Review of Political Science, 19, 477-497.
Guriev, S., & Papaioannou, E. (2022). The political economy of populism. Journal of Economic Literature, 60(3), 753-832.
Inglehart, R., & Norris, P. (2017). Trump and the populist authoritarian parties: the silent revolution in reverse. Perspectives on Politics, 15(2), 443-453.
Helliwell, J. F., Layard, R., Sachs, J. D., De Neve, J.-E., Aknin, L. B., & Wang, S. (Eds.). (2024). World Happiness Report 2024. University of Oxford: Wellbeing Research Centre.
Huber, J. D. & Stanig, P. (2007). Why do the poor support right-wing parties? A cross-national analysis. Unpublished manuscript. Columbia University, New York.
Liberini, F., Redoano, M., & Proto, E. (2017a). Happy voters. Journal of Public Economics, 146, 41-57.
Liberini, F., Oswald, A. J., Proto, E., & Redoano, M. (2017b). Was Brexit caused by the unhappy and the old? IZA Institute of Labor Economics, Discussion Paper No. 11059. Retrieved from http://ftp.iza.org/dp11059.pdf
Mudde, C. (2007). Populist Radical Right Parties in Europe. Cambridge, UK: Cambridge University Press.
Mudde, C. (2016). Europe’s Populist Surge: A Long Time in the Making. Foreign Affairs, 95, 25.
Putnam, R. (2001). Bowling Alone. Simon & Schuster.
Ward, G. (2019). Happiness and Voting Behavior. World Happiness Report 2019.
Ward, G. (2020). Happiness and Voting: Evidence from Four Decades of Elections in Europe. American Journal of Political Science. 64(3), 504-518.
Ward G., De Neve, J.-E., Ungar, L. H., & Eichstaedt, J. C. (2020). (Un)happiness and voting in U.S. presidential elections. Journal of Personality and Social Psychology. 120(2), 370-383.
Ward, G., Schwartz, H. A., Giorgi, S., Menges, J. I., & Matz, S. C. (2024). The role of negative affect in shaping populist support: Converging field evidence from across the globe. American Psychologist.
Endnotes
Guriev and Papaioannou (2022). ↩︎
Algan et al. (2017); Autor et al. (2020); Colantone and Stanig (2018). ↩︎
Bonomi et al. (2021); Inglehart and Norris (2017). ↩︎
In this paper, we use the term “populist” to describe the extreme right, such as the AfD in Germany, the Ligua or Fratelli d’Italia in Italy, or the Rassemblement National in France. The extreme left is equally anti-system, but, as we document here, does not share the same nationalistic tendencies and prejudices against immigrants, and supports a different economic and social platform. ↩︎
Huber and Stanig (2007). ↩︎
Algan et al. (2018); Ward (2019, 2020); Ward et al. (2024). ↩︎
Art (2011); Golder (2016); Mudde (2007, 2016). ↩︎
Helliwell et al. (2024). ↩︎
De Neve et al. (2025); Putnam (2020). ↩︎
Alabrese et al. (2018); Liberini et al. (2017a,b); Ward (2019, 2020); Ward et al. (2024). ↩︎
Ward et al. (2020). ↩︎
Algan and Renault (2024); Ward et al. (2024). ↩︎
Enke (2020); Haidt (2017). ↩︎
Inglehart and Norris (2017). ↩︎
Algan et al. (2016); Coleman (1996); Fehr and Gachter (2000). ↩︎
Algan et al. (2019). ↩︎
See the online appendix for a detailed description of the data and variables. ↩︎
Algan et al. (2016); Coleman (1996); Fehr and Gachter (2000). ↩︎
See the online appendix for more details. ↩︎
Easterlin (1974, 1995). ↩︎