Supporting others: How prosocial behaviour reduces deaths of despair
Key insights
- Increasing prosocial behaviour – donating, volunteering, and helping strangers – is reliably connected to decreasing deaths of despair around the world. Regression results indicate that a ten percentage-point increase in the share of people engaging in prosocial behaviour is associated with approximately one fewer death per year per 100,000. For a country like the United Kingdom, with an adult population of approximately 55 million, that is equivalent to about 550 preventable deaths per year.
- On average, deaths of despair decreased around the world by nearly 5 deaths per 100,000 people over the period 2000–2019 in 59 middle- to high-income countries. This equates to approximately 2,750 people in a country like the UK. The largest declines occurred in northeastern European countries, such as Lithuania and Latvia, which tended to have very high initial levels.
- Deaths of despair declined in three quarters of the 59 considered countries, but are still high and rising in a few cases, such as the United States and Republic of Korea. Slovenia had the highest level in 2019, with more than 50 deaths of despair per 100,000.
- Deaths of despair are nearly four times higher among men than women, and more than double among those aged 60 and above compared to 15- to 29-year-olds. Three quarters of these deaths are due to suicide, followed by deaths due to alcohol and drug abuse.
- Investing in the conditions that support prosocial behaviour could help create societies where people are more supportive, cooperative, and trusting, and where deaths of despair are lower.
Introduction
Deaths of despair are preventable deaths due to suicide, alcohol abuse, and drug overdose. Together, they represent a form of ill-being akin to extreme unhappiness. The term was introduced to describe troubling trends in the United States,[1] while little was known about global patterns[2]. However, rising feelings of distress around the world suggested this trend was not confined to the US.[3] Indeed, our data show that Slovenia, not the US, had the highest rate of deaths of despair in 2019, although the US did experience the greatest increase over the period 2000 to 2019.
In this chapter, we document the levels of deaths of despair around the world using the latest available data, show how these levels have changed over time, and provide an initial analysis of the factors that explain the rise or fall of deaths of despair within countries over time. We focus particularly on prosocial behaviour – donating, volunteering, and helping strangers – as a factor that could reduce deaths of despair.
Previous research has documented the rise in premature mortality due to suicides, opioid poisonings, and alcohol-related liver disease, particularly in North America, Australia, and parts of Europe.[4] The increase in these deaths is typically linked to factors such as extreme distress,[5] feelings of hopelessness,[6] social and economic marginalisation,[7] loss of social ties and decline in social capital,[8] pharmaceutical marketing of prescription opioids[9], rising occupational injuries and pain,[10] and stress stemming from perceived status loss, especially among white populations.[11] These deaths are more common among disadvantaged groups, leading to inequalities in mortality based on education,[12] income,[13] area-level deprivation,[14] and economic insecurity.[15] In addition, evidence from studies on suicide and wellbeing suggests that deaths of despair should be less prevalent in countries where people engage more in prosocial behaviour.[16]
Our research shows that the previously documented trends in deaths of despair do not extend around the world. In the United States, deaths of despair rapidly rose for the reasons mentioned above, especially among middle-aged men due to increased drug abuse. Whereas in our sample of 59 countries, deaths of despair have declined on average from 2000 to 2019, due to declining suicide among older men. In any case, preventable deaths are concerning and it should be possible to reduce them further. Our regression results indicate that fostering prosocial behaviour should reduce deaths of despair.
In our sample of 59 countries, deaths of despair have declined on average from 2000 to 2019, due to declining suicide among older men.
Deaths of despair in 59 countries
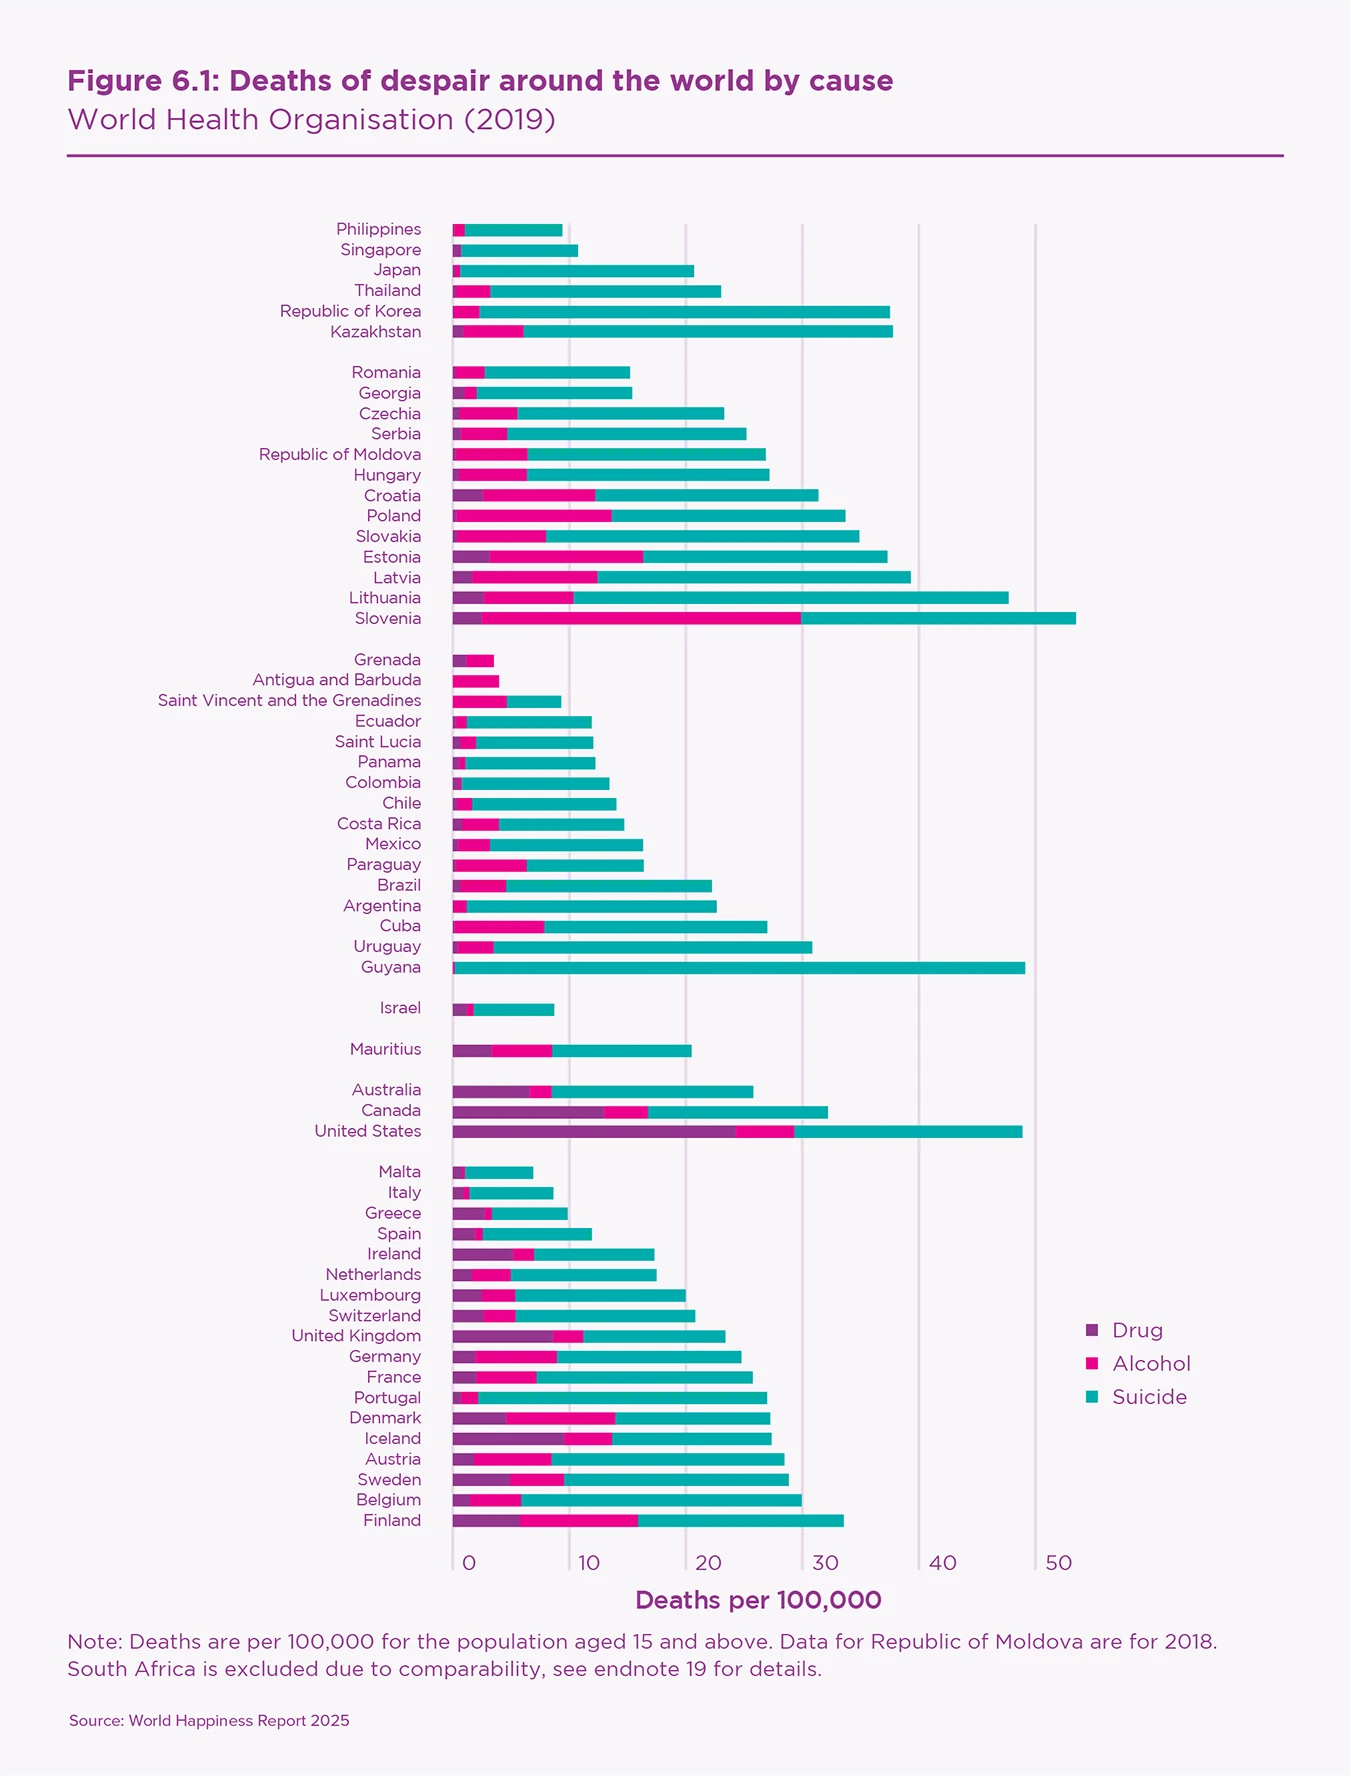
Prior to the COVID-19 pandemic, the average number of deaths of despair per year, in our sample of 59 countries, was 23 per 100,000 persons aged 15 and above.[17] In a country like the United Kingdom, this equates to approximately 12,500 preventable deaths each year.[18] Grenada had the fewest deaths of despair with 4 per 100,000, while Slovenia had the greatest at 53 per 100,000.[19]
Figure 6.1 shows the ranking of deaths of despair in 2019,[20] grouped by region and broken down into their three components. The highest rates are recorded in Slovenia, followed by Guyana, the United States, and Lithuania. Grenada, and Antigua and Barbuda have the lowest rates. Most Northern European countries (such as Finland) and Central and Eastern European countries (such as Slovenia and Lithuania) have scores above average. The fact that Nordic countries top the European ranking of deaths of despair, as well as the global ranking of subjective wellbeing (see Chapter 2), poses a puzzle that we will discuss later. In the United States, Canada, and Australia, deaths of despair are also above average, comparable to Central and Eastern European countries. Among the six Asian countries in our sample, the Republic of Korea and Kazakhstan stand out as the two cases with the highest scores, mainly due to high levels of suicides. Mediterranean and Latin American countries are well below the international average.
Our measure of deaths of despair includes deaths due to alcohol use disorder, drug use disorder, self-inflicted injuries, and ill-defined injuries/accidents from the WHO Mortality Database.[21] Self-inflicted and ill-defined injuries/accidents (of undetermined intent) are summed to obtain suicides, consistent with previous research[22] because ill-defined deaths could include suicide. Previous studies used different variants of deaths of despair, including slightly different causes of mortality depending on data source. Online Appendix A provides more details on how we define and operationalise deaths of despair.
While we used the best available data, caution should be exercised when interpreting differences in deaths across countries. Cultural and institutional differences can affect ‘cause of death’ reporting and limit the comparability of data. For more details on the quality of data and issues with the comparability of cause of death across countries please see Box 6.1.
Our sample is limited to 59 countries because many countries, especially low-income countries, do not provide the necessary data to meet the standards for international comparison.[23] We focus on the period 2000 to 2019 because it gives us the longest and broadest sample of countries possible. Fewer countries have data before 2000 and after 2019. We present mortality figures for populations aged 15 and older in order to match the surveyed populations used to obtain prosocial behaviour figures. Tables B1 to B3 in the online appendix provide sample details, listing the included countries and the reasons for excluding others.

Box 6.1: WHO mortality database and deaths of despair data quality
There are a few reasons why cross-country comparisons of deaths of despair pose an issue. These reasons include systematic differences in the process of assigning cause of death, the capacity for obtaining and storing such information, as well as legal or societal differences.
National statistics on mortality by cause are sourced from the WHO Mortality Database which collects and harmonises information from country civil registration and vital statistics systems. When a death occurs, it is registered at the local civil registry with information on the cause of death, which is typically filed by health professionals such as doctors or nurses. Health professionals document the injuries or diseases that led to the death of the person and list what they believe is the “underlying cause of death” on the death certificate. In some cases, the death registration process may be different, such as suicides and sudden deaths, when it is a coroner who determines and reports the cause of death. Subsequently, the cause of death is assigned an International Classification of Diseases (ICD) death code, registered in the national databases, and sent to the WHO by each country. National statistics offices, or the ministry of health or registrar-general’s office, are responsible for compiling the cause of death data for submission to WHO every year.
The WHO Mortality Database does not include death statistics for all countries. Some do not report their mortality data to the WHO and some send data that are not in standard ICD or do not have ICD codes at all. In other countries, such as China and India, the total deaths reported to the WHO represent less than 5% of the population of the country, hence their data is deemed unreliable and not made available on the WHO Mortality Database. In many countries, cause of death information is difficult to obtain because the system for recording such information is not functioning or non-existent. In addition, there may be a lack of medical certifiers to complete the death certificates.[24] As a result, many deaths may go uncounted or be recorded without listing a cause. When the WHO receives countries’ data, they assess their completeness and quality. They display the data on the portal if they are estimated to include at least 65% of all deaths occurring in a country, with the appropriate cause of death recorded.
The large variations in the systems and processes to define mortality causes imply there may be very different numbers of deaths that are registered with a specific cause. This creates a problem for cross-country comparisons of mortality by cause in general, and even more so for deaths of despair, and suicides in particular.
The person responsible for writing the cause of death on the death certificate may be different across countries. In some countries, the police are responsible, while in others a medical doctor, coroner, or judicial investigator takes on this role. Differences in doctors’ training, access to medical records, and autopsy requirements contribute to these discrepancies. The legal or judicial systems that decide causes of death also vary. For instance, in some countries suicide is illegal and is not listed as a classifiable cause of death, leading to underreporting or misclassification of suicides as accidents, violence, or deaths of “undetermined intent.”[25]
Data on suicides, even when reported, can be inaccurate due to social factors as well. In some countries, suicide might be taboo and highly stigmatised, so the families and friends of the person who committed suicide might decide to misreport or not disclose the mortality cause, causing underreporting of its incidence. In other societies, such as Northern Europe, there is less stigma attached to suicides, and alcohol and drug use.
Lastly, another layer of complexity with cross-country comparisons of deaths of despair is given by the differences in the ICD codes used to categorise deaths, as countries may adopt different versions at different times, complicating data harmonisation and comparison.
Although the WHO Mortality Database provides ICD-codes harmonised data per country, cross-country comparisons are still discouraged. As a result, we analyse variations of deaths of despair over time within countries, rather than focusing on cross-country comparisons.
On average, nearly 75% of deaths of despair are due to suicides (16.40 per 100,000), followed by alcohol abuse (4.33 per 100,000) and drug overdose (2.27 per 100,000) (see Table 6.1). Total deaths of despair represent 2.2% of all deaths – 23 out of 1,045 deaths per 100,00, per year, on average.[26]
Table 6.1 also shows that deaths of despair are fairly equally distributed across lower-middle (22.95), upper-middle (22.55), and high-income countries (23.37), with no accurate data available for low-income countries (and sufficient time coverage). It is worth emphasising that figures on deaths of despair in China and India are missing.
| Income groups | Countries | Mean | Std. dev. | Min | Max |
|---|---|---|---|---|---|
| Lower middle | 11 | 22.95 | 11.97 | 9.40 | 49.10 |
| Upper middle | 21 | 22.55 | 12.19 | 2.41 | 47.68 |
| High | 27 | 23.37 | 12.00 | 3.96 | 53.47 |
| Total | 59 | 23.00 | 11.86 | 2.41 | 53.47 |
| Income groups | Countries | DoD | Suicide | Alcohol | Drug |
| Lower middle | 11 | 22.95 | 19.33 | 3.22 | 0.40 |
| Upper middle | 21 | 22.55 | 16.48 | 5.05 | 1.02 |
| High | 27 | 23.37 | 15.14 | 4.22 | 4.01 |
| Total | 59 | 23.00 | 16.40 | 4.33 | 2.27 |
Note: Deaths are per 100,000 for the population aged 15 and above. Income groups are defined based on 2005 values of GNI per capita in US dollars and World Bank (2024a).
In Table 6.2, we break down the data by age and gender. Deaths of despair are nearly four times higher among men than among women. In the case of alcohol abuse, it is five times higher. Deaths of despair, independently from their cause, are more than double among men and women aged 60+ (30.45) compared to those aged 15 to 29 (13.45). However, mortality due to drug overdose is more frequent among working-age adults. The average mortality rate is 3.15 among people aged 30 to 59, and 1.47 among others.
| Full | Women | Men | |
|---|---|---|---|
| Despair | |||
| All Ages 15+ | 23.00 | 9.98 | 36.86 |
| 15–29 | 13.23 | 6.08 | 20.06 |
| 30–44 | 20.03 | 7.50 | 32.38 |
| 45–59 | 26.88 | 10.86 | 43.46 |
| 60+ | 30.45 | 13.73 | 51.87 |
| Suicide | |||
| All Ages 15+ | 16.40 | 7.29 | 26.10 |
| 15–29 | 11.20 | 4.96 | 17.18 |
| 30–44 | 14.23 | 5.13 | 23.21 |
| 45–59 | 17.88 | 7.41 | 28.77 |
| 60+ | 21.32 | 10.37 | 35.38 |
| Alcohol | |||
| All Ages 15+ | 4.33 | 1.45 | 7.41 |
| 15–29 | 0.20 | 0.05 | 0.33 |
| 30–44 | 2.18 | 0.73 | 3.58 |
| 45–59 | 6.32 | 1.93 | 10.84 |
| 60+ | 8.02 | 2.55 | 15.04 |
| Drug | |||
| All Ages 15+ | 2.27 | 1.24 | 3.35 |
| 15–29 | 1.83 | 1.07 | 2.55 |
| 30–44 | 3.63 | 1.63 | 5.59 |
| 45–59 | 2.67 | 1.51 | 3.85 |
| 60+ | 1.11 | 0.81 | 1.45 |
Note: Deaths are per 100,000 for the population aged 15 and above.
Since the year 2000, the number of deaths of despair has declined in nearly 75% of the considered countries (see Figure 6.2). The decline approaches -2 deaths per 100,000 persons per year in Lithuania, Latvia, and Estonia, followed by Kazakhstan, Finland, Switzerland, Luxembourg, and Denmark. The United States, on the other hand, has seen an average yearly increase of 1.3 deaths per 100,000. Hence, as previously documented, the United States is characterised by both high and increasing levels of deaths of despair. The Republic of Korea and Slovakia have the second and third highest yearly increase in deaths of despair, with average annual increases below 1. Among Western European countries, the yearly growth rates in the Netherlands, Portugal, Greece and the United Kingdom are positive, but very close to zero.
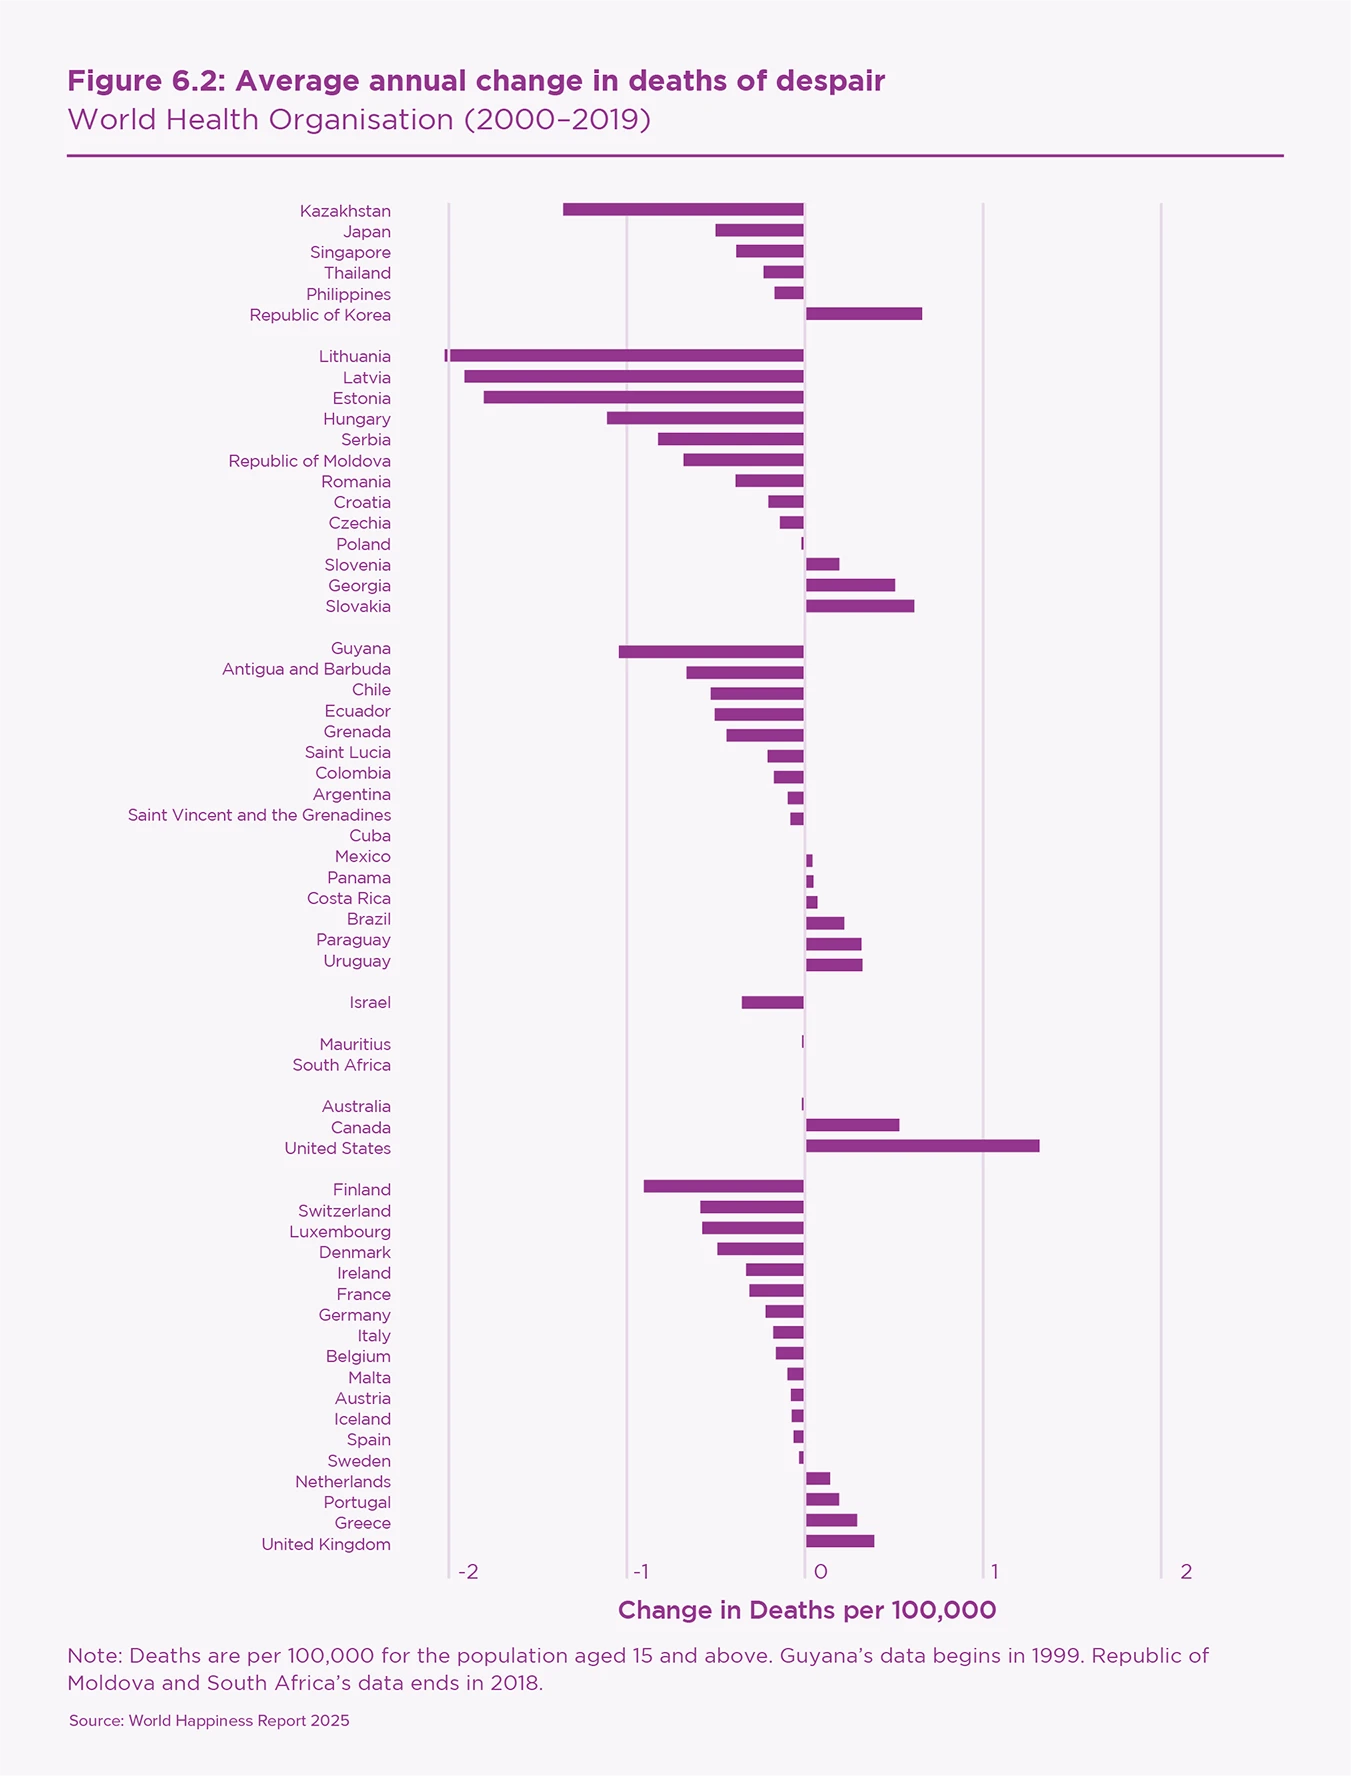
Table 6.3 indicates that the yearly decline of deaths of despair was -0.41 deaths per 100,000 in upper-middle-income countries, -0.28 in lower-middle-income countries, and nearly zero (-0.09) in high-income countries where only suicides declined, whereas both drug and alcohol abuse increased. These changes are driven largely by a general decline in suicide (-0.28), whereas drug overdoses are on the rise in all countries (0.05), especially among high-income countries (0.09). Hence, although the levels of deaths of despair appear unrelated to a country’s income (Table 6.1), the yearly changes indicate that deaths of despair are more concerning in high-income countries.
| Income groups | Countries | Mean | Std. dev. | ||
|---|---|---|---|---|---|
| Lower middle | 11 | -0.28 | 0.57 | ||
| Upper middle | 21 | -0.41 | 0.73 | ||
| High | 27 | -0.09 | 0.47 | ||
| Total | 59 | -0.24 | 0.60 | ||
| Income groups | Countries | DoD | Suicide | Alcohol | Drug |
| Lower middle | 11 | -0.28 | -0.33 | 0.04 | 0.01 |
| Upper middle | 21 | -0.41 | -0.38 | -0.04 | 0.01 |
| High | 27 | -0.09 | -0.19 | 0.02 | 0.09 |
| Total | 59 | -0.24 | -0.28 | 0.00 | 0.05 |
Note: Deaths are per 100,000 for the population aged 15 and above. Income groups are defined based on 2005 values of GNI per capita in US dollars and World Bank (2024a). Guyana’s data begins in 1999. Republic of Moldova and South Africa’s data ends in 2018.
Countries that had initially high levels of deaths of despair also tended to have large decreases over time. Among the 15 countries with the highest levels (Figure 6.1), nine experienced decreases (Figure 6.2), and at rates that were among the highest, e.g., the Baltic nations: Estonia, Latvia, and Lithuania. To assess whether this observation is statistically meaningful, we performed convergence tests of whether the initial level of deaths of despair influences its subsequent growth.[27]
Table 6.4 indicates that higher initial levels of deaths of despair generally correspond to negative changes over time (-0.025, significant at 1%). In other words, deaths of despair decreased more in countries where the incidence of deaths of despair was higher. This result is remarkably stable, both in magnitude and significance, for men and women and for people in various age groups. Investigating the causes of this relationship is beyond the scope of this analysis. However, it is possible that this happened because societies experiencing high mortality rates adopted formal and/or informal strategies to prevent deaths of despair.
| (1) Full | (2) 15–29 | (3) 30–44 | (4) 45–59 | (5) 60+ | |
|---|---|---|---|---|---|
| Initial DoD | -0.025*** | -0.028*** | -0.027*** | -0.033*** | -0.020*** |
| (0.003) | (0.002) | (0.003) | (0.002) | (0.005) | |
| Observations | 59 | 59 | 59 | 59 | 59 |
| R-Squared | 0.559 | 0.602 | 0.537 | 0.719 | 0.271 |
| Initial DoD among women | -0.024*** | -0.022*** | -0.023*** | -0.033*** | -0.025*** |
| (0.003) | (0.003) | (0.005) | (0.004) | (0.003) | |
| Observations | 59 | 59 | 59 | 59 | 59 |
| R-Squared | 0.381 | 0.232 | 0.274 | 0.526 | 0.372 |
| Initial DoD among men | -0.026*** | -0.032*** | -0.028*** | -0.034*** | -0.018*** |
| (0.003) | (0.002) | (0.004) | (0.002) | (0.005) | |
| Observations | 59 | 59 | 59 | 59 | 59 |
| R-Squared | 0.614 | 0.693 | 0.575 | 0.766 | 0.270 |
Note: Standard errors in parentheses (clustered by country); * p<0.10, ** p<0.05, *** p<.01
More generally, deaths of despair declined among both men and women independently of their age (see Table B4 in the online appendix). This was mainly due to decreasing suicides across age groups. Mortality due to alcohol abuse did not change much on average – it diminished among the working-age population but increased for those aged 60+. Among the three causes of mortality composing deaths of despair, only drug abuse shows positive growth rates on average (0.05). This trend concerns both men and women, especially in the age group 30 to 59.
Three notable patterns emerged among the countries that experienced increasing deaths of despair. The majority witnessed increasing deaths among older men due to alcohol abuse. In the US, Canada, and the UK, deaths of despair increased among men aged 30 to 59 primarily due to rising drug abuse. In the Republic of Korea, deaths of despair increased largely among men aged 60+ due to increasing suicide. These distinct patterns indicate that the mechanisms behind the rise in deaths of despair in the United States do not apply generally.
In sum, the available evidence from 59 countries around the world shows that deaths of despair have declined since 2000 in nearly 75% of countries. Countries like Lithuania, Latvia, and Estonia have seen the largest decreases, while deaths of despair increased in the United States, Republic of Korea, and Slovakia. Suicides are the most prevalent cause of despair-related mortality. On average, deaths of despair are nearly four times more prevalent among men than women and twice as prevalent among those aged 60+ compared to 15- to 29-year-olds. The only exception is drug overdose, which is more frequent for men and women of working age than for others.
The level of deaths of despair appears unrelated to the income level of a country. However, this is not the case for the changes over time. On average, deaths of despair declined faster in poorer countries than in rich ones. The number of suicides declined at a rate that more than offset the increases in drug- and alcohol-related deaths in lower-middle and upper-middle-income countries, but the suicide decline is lower in high-income countries. In the latter case, the average annual decrease of 0.19 deaths per 100,000 persons was almost offset by the increase in drug- and alcohol-related deaths.
Why do deaths of despair rise in some countries and fall in others? Differences in how prosocial behaviour evolved in different countries may offer an explanation. In the next section, we describe the reasons why prosocial behaviour could contribute to less deaths of despair.

The case for prosocial behaviour
Prosocial behaviour – sometimes called acts of kindness or altruism – includes behaviours that are done for the benefit of others. It is a behavioural measure of social capital which includes trust, behaviours, norms and shared values enabling a society to cooperate to achieve common goals. For both prosocial behaviour and social capital, there are numerous studies from multiple disciplines that document their beneficial impacts on individuals and society.
Prosocial behaviour should contribute to limiting deaths of despair for numerous reasons. People who engage in prosocial behaviour are healthier[28] and happier,[29] and they experience a greater sense of purpose and meaning in life[30] as well as improved psychological flourishing.[31] Each of these aspects should reduce the risk of deaths of despair. Prosocial behaviour also strengthens and expands individuals’ social networks, thereby increasing access to social support and information, which improves coping strategies that mitigate stress perception and physiological responses.[32] Importantly, prosocial behaviour may reduce deaths of despair by buffering individuals against the harmful effects of stressors and life challenges. In times of uncertainty and distress, these social networks provide practical assistance, emotional support, and advice which boost wellbeing[33] and reduce the likelihood of resorting to maladaptive coping mechanisms, such as substance abuse.[34] Finally, prosocial behaviour fosters self-esteem, which serves as a protective factor against life challenges.[35]
Social relationships foster emotional support, provide a sense of belonging, and promote meaning self-esteem and purpose in life which, in turn, support mental wellbeing and reduce the likelihood of engaging in harmful behaviours.
The benefits of prosocial behaviour extend beyond the direct effects on those engaging in them. Prosocial behaviour contributes to social capital by fostering trust in others, shared values and sense of responsibility, and cooperative norms both within civic networks and across diverse groups.[36] See Chapter 2 for additional details.
Social capital, more broadly, also affects health and wellbeing outcomes directly and indirectly, both through individual-level psychosocial mechanisms (e.g., emotional support, stress buffering, and behaviour modulation)[37] and community-level social cohesion (e.g., collective efficacy and social norms).
Social capital can directly affect individual health and wellbeing via cognitive, emotional, behavioural, and biological pathways.[38] Indeed, social relationships foster emotional support, provide a sense of belonging, and promote meaning, self-esteem and purpose in life[39] which, in turn, support mental wellbeing and reduce the likelihood of engaging in harmful behaviours.[40] In fact, the influence of social capital extends beyond individual psychosocial support as it reinforces positive community outcomes. Social norms within communities affect behavioural mechanisms by fostering accountability, encouraging health-promoting habits, and discouraging risky or harmful behaviours and the adoption of maladaptive coping mechanisms, such as substance abuse, and excessive alcohol consumption.[41] For example, previous research demonstrated that individuals embedded in strong social networks are more likely to seek help for mental health issues, which, in turn, lowers the chances of harmful behaviour.[42]
At the community level, social capital fosters life expectancy, longevity, and public health, and reduces all-cause mortality.[43] Community social capital is linked to lower death rates, including from heart disease,[44] and to lower mortality from cancer, cardiovascular disease, and suicide.[45] Furthermore, collective efficacy, i.e., perception of mutual trust and willingness to help each other, has been associated with positive societal outcomes including reduced rates of assaults, homicide, premature mortality, and asthma.[46]
Changes in prosocial behaviour
In 2019, on average, 31.1% of respondents engaged in prosocial behaviour, with 45.3% stating that they helped a stranger, 29.9% donated money, and 18.2% volunteered in groups or associations (see Table 6.5). These data are sourced from the Gallup World Poll (GWP) and refer to the population aged 15 and over. Our measure of prosocial behaviour is the average of the shares of respondents answering “yes” to each of the three components: donating money, volunteering, and helping strangers.[47] Our sample includes 50 countries and covers the period 2005–06 to 2019 when data on prosocial behaviour and deaths of despair are available. See Tables B1–B3 in the online appendix for details.
| Income groups | Countries | Mean | Std. dev. | Min | Max |
|---|---|---|---|---|---|
| Lower middle | 10 | 31.41 | 5.24 | 25.02 | 40.39 |
| Upper middle | 16 | 23.91 | 6.67 | 11.86 | 33.93 |
| High | 24 | 35.74 | 9.87 | 13.19 | 53.47 |
| Total | 50 | 31.09 | 9.58 | 11.86 | 53.47 |
| Income groups | Countries | PSB | Donation | Volunteer | Helped |
| Lower middle | 10 | 31.41 | 24.10 | 17.79 | 52.43 |
| Upper middle | 16 | 23.91 | 19.21 | 12.23 | 40.40 |
| High | 24 | 35.74 | 39.38 | 22.24 | 45.58 |
| Total | 50 | 31.09 | 29.87 | 18.15 | 45.29 |
Note: Income groups are defined based on 2005 values of GNI per capita in US dollars and World Bank (2024a). Countries using 2018: Republic of Moldova and South Africa.
Prosocial behaviour is more frequent in high-income countries where 35.7% of the population reported that they engaged in prosocial behaviour, mainly helping others (45.6%) or donating money (39.4%). Helping others is the main form of prosocial behaviour in lower-middle-income countries where more than 50% reported helping others.
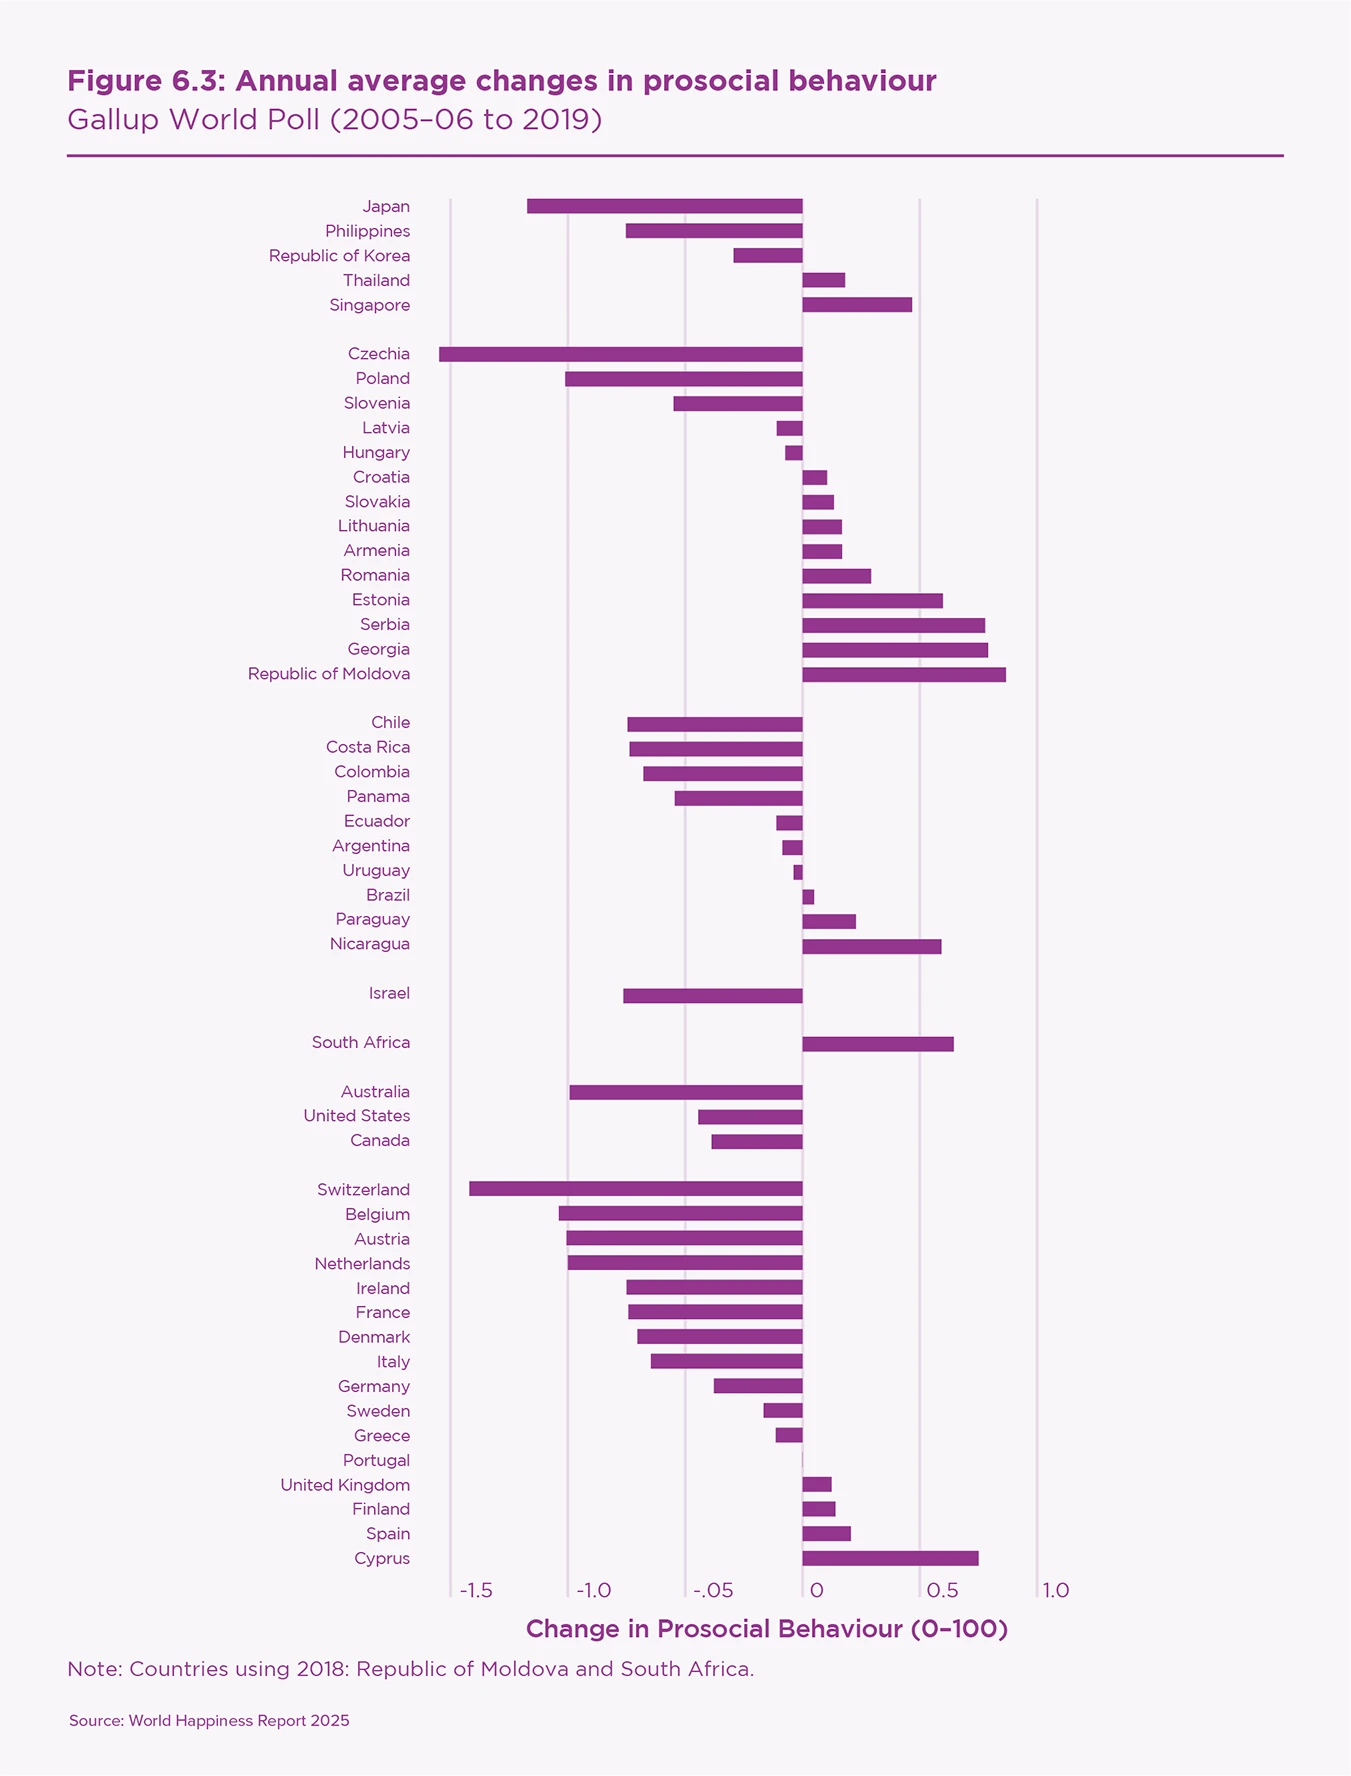
Over the period 2005–6 to 2019, engagement in prosocial behaviour decreased in most countries. We exclude the years after 2019, which are marked by rising prosocial behaviours (see Chapter 2) due to the limited availability of mortality data and because the pandemic might have affected prosocial behaviours and deaths of despair in exceptional ways. Figure 6.3 presents the average yearly changes in prosocial behaviour by country and world region. Most changes are below 1 percentage point per year in absolute value. The countries where prosocial behaviour decreased at a faster rate are Czechia, Switzerland, Belgium, and Japan. Prosocial behaviour decreased in most Western European countries, in some Latin American countries, in Japan, the Philippines, and the Republic of Korea, as well as in North America and Australia.
The average change is -0.23 percentage points per year (see Table 6.6). However, the decrease was steeper in high-income countries, where engagement decreased by -0.45 percentage points per year, compared to upper-middle-income countries, where the rate of decrease was -0.14. In both cases, the decrease was prevalently associated with a decrease in donating money which, in high-income countries, proceeded at a rate of -0.99%, followed by decreasing engagement in volunteering activities and helping others. This general decrease in prosocial behaviour is consistent with findings from earlier studies that documented a long-term decrease of social capital, prevalently in industrialised countries.[48]
| Income groups | Countries | Mean | Std. dev. | Min | Max |
|---|---|---|---|---|---|
| Lower middle | 10 | 0.13 | 0.55 | -0.75 | 0.87 |
| Upper middle | 16 | -0.14 | 0.64 | -1.55 | 0.78 |
| High | 24 | -0.45 | 0.55 | -1.42 | 0.75 |
| Total | 50 | -0.23 | 0.61 | -1.55 | 0.87 |
| Income groups | Countries | PSB | Donation | Volunteer | Helped |
| Lower middle | 10 | 0.13 | -0.01 | -0.15 | 0.56 |
| Upper middle | 16 | -0.14 | -0.30 | -0.14 | -0.02 |
| High | 24 | -0.45 | -0.99 | -0.27 | -0.11 |
| Total | 50 | -0.23 | -0.58 | -0.21 | 0.05 |
Note: Income groups are defined based on 2005 values of GNI per capita in US dollars and World Bank (2024a). Countries using 2018: Republic of Moldova and South Africa.
Prosocial behaviour increased by 0.13 percentage points per year in lower-middle-income countries. However, this increase masks two contrasting trends: on one hand, an increase in the share of people helping others (0.56); on the other hand, a decrease in volunteering (-0.15).
The decrease in prosocial behaviour is about two times larger for women than for men, but this difference occurs to varying degrees across age groups and behaviours (see Table B5 in the online appendix). The most striking gender difference concerns people helping others. The modest increase in the share of people helping others (0.05) is driven entirely by men. Among women, helping others declined slightly on average, especially among women aged 60+.
In sum, engagement in prosocial behaviour decreased in 30 out of 50 countries over the period 2005–06 to 2019. This decrease was observed for both men and women of all ages and is the result of a general decrease in donations and volunteering, especially among upper-middle and high-income countries. Do these changes help us understand how deaths of despair have changed over time? In particular, does prosocial behaviour buffer against despair leading to death?
Evidence from three countries (the United States, Republic of Korea, and Finland) provides a starting point to address these questions. The US and Korea stand out for their high and rapidly increasing deaths of despair, while Finland is notable for high but decreasing deaths of despair. Indeed, the pace of increasing deaths of despair in the US and Korea is approximately the opposite of the decrease in Finland (see Figure 6.2). One potential explanation for this contrast is differing prosocial behaviour trends. In both the US and Korea, prosocial behaviour declined over time, whereas in Finland, it increased (see Figure 6.3). This pattern strengthens the hypothesis that prosocial behaviour plays a role in reducing deaths of despair, which is the subject of the next section.

Explaining deaths of despair over time: the role of prosocial behaviour
In our sample of 50 countries, regression analysis confirms that increasing prosocial behaviour correlates with decreasing deaths of despair over time. Donations are the most important component of prosocial behaviour and they have a larger and more precisely estimated impact on men compared to women, and on older compared to younger people. The regression analysis allows us to account for a host of relevant control variables as alternative explanations, such as religiosity and poverty. Prosocial behaviour maintains a similar relationship in all instances.
Estimation technique and control variables
We estimate the relationship between prosocial behaviour and deaths of despair using a standard regression framework which simultaneously considers the influence of multiple variables including prosocial behaviour. This approach allows us to isolate the relationship between prosocial behaviour and deaths of despair from the influence of multiple explanatory factors. For instance, deaths of despair could be influenced by economic, demographic, governmental, and societal characteristics. To this end, we consider as many variables as possible that might confound the relationship. We begin with the full set of variables with adequate data and then reduce the set using a standard variable selection technique.[49]
We considered the following economic factors: GDP per capita, GDP per capita growth rate, inflation rate, unemployment rate, and labour force participation rate (separately defined by gender). During periods of recessions, with declining purchasing power and rising unemployment, people experience more financial pressure and suicides tend to rise. According to Galbraith (2009), during the early years of the Great Depression (1929-1932), suicides increased from 17.0 to 21.3 per 100,000 in the United States. The labour force participation rate is the population share that is either working or seeking work. Decreases for men correspond, in part, with people giving up on seeking work due to factors such as bad health,[50] discouragement, and desperation.
We included the population age structure, measured using population shares for ages 30–44, 45–59, 60–64, and 65+[51]; the female population share; divorce rate; and degree of urbanisation. The population structure accounts for the varying age and gender compositions of countries and the varying degrees to which they engage in prosocial behaviour or die from deaths of despair. For instance, we observe that those aged 60–64 are much more likely to engage in prosocial behaviour, especially donating, than those aged 65+, which is why we distinguish them in the analysis.[52] The female population share, divorce rate, and degree of urbanisation are included as deaths of despair are greater among men (see Table 6.2), in communities with greater divorce rates,[53] and in rural areas.[54]
We also considered religious importance, quality of governance, health expenditures, and the three variables from the World Happiness Report that are used to explain differences in life evaluations around the world, specifically: support, freedom, and perceptions of corruption. Religiosity is an important control variable because, in many cases, religions forbid suicides and discourage the use of drugs. Religiosity is also often associated with volunteering, donating money, and a high propensity to help strangers. Quality of governance could affect the resources available and opportunities for societal improvement. Religiosity and quality of governance have also previously been found to be associated with suicide.[55] Health expenditures capture the quality of health care available to individuals. Feelings of support, having someone to count on, should alleviate feelings of despair; freedom could help one climb out of a bad place. Likewise, a lack of freedom corresponds to a lack of agency and despair. Perceived corruption operates somewhat similarly to freedom and the opposite of quality of governance. If the system is perceived to be corrupt, then individuals may believe they have less ability to affect their community and own lives.
Lastly, we included indicator variables for each country and year, so-called country and year fixed effects. Country fixed effects account for all fixed characteristics of a country including, for instance, latitude, which is predictive of climate and suicide[56]. When including country fixed effects, the estimated relations correspond to changes within countries over time, not differences across countries. Year fixed effects account for any common trends over time that exist across countries. See Online Appendix C for a list of data sources.
Increasing prosocial behaviour is associated with decreasing deaths of despair
The results of rigorous analyses – in which we isolate the relation between changing prosocial behaviour and deaths of despair from fixed country characteristics and the contemporaneous effects of numerous control variables – make us confident that prosocial behaviour does indeed contribute to decreasing deaths of despair. Our results are presented in Table 6.7.[57] The negative coefficient means that when prosocial behaviour increases within a country by one percentage point, we can expect a decrease in deaths of despair in the same country by 0.096 deaths per 100,000. In the case of the United States, with a population aged 15+ of nearly 270 million, this amounts to about 260 persons for each percentage point.
Columns 2 to 4 refine the analysis by checking how each of the three prosocial behaviour components explains deaths of despair. Donating money, volunteering, and helping a stranger are all associated with lower levels of deaths of despair, but only donating money is statistically different from zero. This could be because donating money is the only component of prosocial behaviour that contributes to decreasing deaths of despair, or because the data do not provide enough statistical power to identify significant effects for all three variables. Either way, considering the beneficial role played by prosocial behaviour in general, and by donating money in particular, decreasing engagement observed in many high-income countries until 2019 is a cause of concern.
| (1) | (2) | (3) | (4) | ||
|---|---|---|---|---|---|
| Prosocial | -0.096* | ||||
| (0.050) | |||||
| Donations | -0.093** | ||||
| (0.041) | |||||
| Volunteering | -0.040 | ||||
| (0.048) | |||||
| Helped Stranger | -0.033 | ||||
| (0.029) | |||||
| Labor Force Part. Male | -0.727*** | -0.680*** | -0.732*** | -0.744*** | |
| -0.222 | -0.21 | -0.226 | -0.229 | ||
| Inflation Rate | 0.078 | 0.077 | 0.083 | 0.076 | |
| (0.067) | (0.066) | (0.066) | (0.067) | ||
| Pop. Share 65+ | -1.773*** | -1.792*** | -1.724*** | -1.734*** | |
| (0.631) | (0.625) | (0.629) | (0.625) | ||
| Pop. Share 60-64 | -0.944 | -0.831 | -1.019 | -0.988 | |
| (0.925) | (0.894) | (0.918) | (0.911) | ||
| Support | -0.153* | -0.148* | -0.163* | -0.155* | |
| (0.078) | (0.076) | (0.083) | (0.081) | ||
| Corruption | 0.130** | 0.125** | 0.125** | 0.129** | |
| (0.050) | (0.049) | (0.050) | (0.051) | ||
| Constant | 103.316*** | 99.881*** | 102.330*** | 102.563*** | |
| (17.267) | (15.937) | (17.334) | (17.107) | ||
| Observations | 620 | 620 | 620 | 620 | |
| # of Countries | 50 | 50 | 50 | 50 | |
| R-Squared | 0.291 | 0.300 | 0.283 | 0.284 |
Note: Regressions of deaths of despair in levels on indicated variables and fixed effects for year and country. Standard errors in parentheses (clustered by country); * p<0.10, ** p<0.05, *** p<0.01
The variable selection process, discussed in footnote 48, reduced our set of explanatory variables (including prosocial behaviour) from the 20 discussed above to the 7 (excluding fixed effects) presented in Table 6.7. Perhaps surprisingly, variables such as religiosity, GDP, and unemployment were not among the most important variables. This may be because country fixed effects account for all country characteristics that do not change over time, and even some factors that do not vary much or frequently. Thus, the impact of religiosity on deaths of despair is accounted for in our model, to the extent that religiosity remains stable. GDP and unemployment vary over time more than religiosity but also vary along with the other variables, especially the economic ones that were retained, i.e., inflation and labour force participation. The remaining variables, together with the fixed effects, account for the influences of those that were dropped.[58] In any case, the analysis is not intended to uncover the causal impacts of the control variables (e.g., inflation and support) and, for this reason, we do not recommend interpreting them causally.
In addition to the 20 previously mentioned variables, we tested five more variables that were left out of the previous analysis because they have reduced data coverage, specifically: the poverty rate, income inequality, public social expenditures, population share living alone, and the population share with at least secondary education (separately by gender). The poverty rate – measured as the population share that earns less than $3.65 a day (adjusted for purchasing power) – is the population share considered to earn too little to meet basic material needs in lower-middle-income countries. Income inequality – measured using the Gini coefficient – is often connected with a sense of unfairness and distrust, which in turn reduces one’s sense of control over their life. Public social expenditures represent the social safety net, e.g., expenditures on health, unemployment benefits, and child and elderly care. The population share living alone reflects one form of social isolation, which could be related to loneliness and despair (see Chapter 4). The population share with at least upper-secondary education could be important as deaths of despair tend to be greater among less educated groups in the United States.[59] Tables B7 and B8 in the online appendix show respectively the results of regressions with the full set of control variables and with the additional five ones just described. Across nearly all of the regressions, prosocial behaviour maintains a statistically significant and negative relation with a broadly similar magnitude.
Additional analysis reveals differences between the average relationship for the full population and for population subgroups. Columns 1–5 in Table 6.8 summarise the results of the same model presented in column 1 of Table 6.7 but this time for men and women of various age groups. As in the previous results, greater prosocial behaviour is associated with fewer deaths of despair, but the relation is only statistically significant for men in later stages of life. In these cases, the coefficient magnitudes are larger than for the full population. For instance, increasing prosocial behaviour by 1 percentage point would reduce deaths of despair among people aged 60+ by 0.21 people per 100,000 (compared with 0.096 for the full population); and the relation for men is more than three times larger than for women. We also replicate the analysis using donations, from column 2 of Table 6.7. The results, presented in columns 6–10 of Table 6.8, indicate donations are likewise negatively related to deaths of despair, and statistically significant for both men and women in older ages.
| Full | 15-29 | 30-44 | 45-59 | 60+ | Full | 15-29 | 30-44 | 45-59 | 60+ | |
|---|---|---|---|---|---|---|---|---|---|---|
| Prosocial | -0.096* | -0.025 | -0.066 | -0.175** | -0.208** | |||||
| (0.050) | (0.038) | (0.054) | (0.081) | (0.103) | ||||||
| Donations | -0.093** | -0.044 | -0.064 | -0.164** | -0.178*** | |||||
| (0.041) | (0.034) | (0.043) | (0.074) | (0.062) | ||||||
| R-Squared | 0.291 | 0.196 | 0.266 | 0.384 | 0.189 | 0.300 | 0.202 | 0.270 | 0.392 | 0.196 |
| Women | Full | 15-29 | 30-44 | 45-59 | 60+ | Full | 15-29 | 30-44 | 45-59 | 60+ |
| Prosocial | -0.032 | -0.004 | -0.008 | -0.043 | -0.101 | |||||
| (0.026) | (0.017) | (0.023) | (0.033) | (0.082) | ||||||
| Donations | -0.034* | -0.008 | -0.012 | -0.056* | -0.095* | |||||
| (0.017) | (0.012) | (0.017) | (0.033) | (0.051) | ||||||
| R-Squared | 0.239 | 0.092 | 0.163 | 0.322 | 0.200 | 0.244 | 0.092 | 0.164 | 0.330 | 0.205 |
| Men | Full | 15-29 | 30-44 | 45-59 | 60+ | Full | 15-29 | 30-44 | 45-59 | 60+ |
| Prosocial | -0.165* | -0.044 | -0.125 | -0.321** | -0.330** | |||||
| (0.085) | (0.065) | (0.094) | (0.142) | (0.145) | ||||||
| Donations | -0.161** | -0.079 | -0.123 | -0.290** | -0.286*** | |||||
| (0.074) | (0.063) | (0.077) | (0.128) | (0.086) | ||||||
| R-Squared | 0.289 | 0.207 | 0.278 | 0.377 | 0.185 | 0.298 | 0.214 | 0.283 | 0.385 | 0.194 |
| Observations | 620 | 620 | 620 | 620 | 620 | 620 | 620 | 620 | 620 | 620 |
| # of Countries | 50 | 50 | 50 | 50 | 50 | 50 | 50 | 50 | 50 | 50 |
Note: Fixed effect regressions of deaths of despair on prosocial behaviour and: male labour force participation rate, inflation rate, population share 60-64, and population share 65+, social support, perceptions of corruption, and fixed effects for year and country. Time series sample, 620 observations for 50 countries. Standard errors in parentheses (clustered by country); *p<0.10 **p<0.05 ***p<0.01
Social capital and deaths of despair
In this section, we complement the previous analysis using social trust and group membership.[60] These are two widely used measures of social capital and we expect that their increase should be associated with lower deaths of despair within countries for the reasons discussed earlier.[61] Stated briefly, societies with higher trust in others or more participation in groups and associations should be more cohesive than others and therefore better equipped to look after those who fall behind. Group membership also provides a sense of belonging and community to those who participate in it, and in many cases, a service to the broader society.
Trust and group membership data come from the integrated World Values Survey and European Values Study dataset, which allows us to consider a longer time period. We include all the countries with at least three waves of observations between waves 2 and 7 (1991–2019) and the necessary mortality data. Table B6 in the online appendix provides summary statistics.
We use the same analytical technique as the previous section and the same reduced set of control variables as presented in Table 6.7. However, we exclude the controls sourced from the Gallup World Poll (social support and perceptions of corruption) which are unavailable before 2005.
The results are broadly consistent with the previous ones. Both trust and membership are negatively related to deaths of despair, although the coefficients are not statistically different from zero (see Tables 6.9 and 6.10). This could be because there are fewer observations and countries, which reduces estimation precision. Indeed, the estimates are fairly similar across social capital measures. An increase in prosocial behaviour is associated with 0.096 fewer deaths per 100,000 (Table 6.7), while increases in trust and membership are associated with 0.095 (Table 6.9) and 0.074 (Table 6.10) fewer deaths per 100,000.
While no statistically significant relationships are observed in the full population, distinct patterns emerge within specific gender and age groups. For social trust, the magnitudes are larger for men compared to women and for the upper-middle-aged compared to other age groups. Indeed, for upper-middle-aged individuals, increasing social trust is significantly associated with a decrease in deaths of despair for both men and women. An increase in membership correlates with fewer deaths of despair in the full sample of women on average. For men, an increase in membership is significantly linked to a reduction in deaths of despair within the youngest age group.
| (1) All ages | (2) 15–29 | (3) 30–44 | (4) 45–59 | (5) 60+ | |
|---|---|---|---|---|---|
| Female & Male | |||||
| Social trust | -0.095 | -0.025 | -0.104 | -0.316* | 0.019 |
| (0.114) | (0.103) | (0.135) | (0.160) | (0.202) | |
| R-squared | 0.205 | 0.144 | 0.321 | 0.313 | 0.090 |
| Female | |||||
| Social trust | -0.071 | -0.033 | -0.055 | -0.148* | -0.077 |
| (0.053) | (0.050) | (0.050) | (0.078) | (0.152) | |
| R-squared | 0.181 | 0.053 | 0.230 | 0.255 | 0.127 |
| Male | |||||
| Social trust | -0.142 | -0.029 | -0.175 | -0.520* | 0.085 |
| (0.194) | (0.183) | (0.235) | (0.280) | (0.299) | |
| R-squared | 0.225 | 0.183 | 0.339 | 0.318 | 0.110 |
| Observations | 154 | 154 | 154 | 154 | 154 |
| # of countries | 40 | 40 | 40 | 40 | 40 |
Note: Fixed effects regressions of deaths of despair on population share 60–64, population share 65+, male labour force participation, inflation rate, and wave dummies. Standard errors in parentheses (clustered by country); * p<0.10, ** p<0.05, *** p<0.01
| (1) All ages | (2) 15–29 | (3) 30–44 | (4) 45–59 | (5) Aged 60+ | |
|---|---|---|---|---|---|
| Female & Male | |||||
| Any membership | -0.074 | -0.064 | -0.088 | -0.074 | -0.097 |
| (0.058) | (0.040) | (0.058) | (0.083) | (0.104) | |
| R-squared | 0.213 | 0.163 | 0.329 | 0.296 | 0.099 |
| Female | |||||
| Any membership | -0.053* | -0.015 | -0.032 | -0.052 | -0.125 |
| (0.030) | (0.018) | (0.025) | (0.037) | (0.089) | |
| R-squared | 0.194 | 0.052 | 0.232 | 0.247 | 0.150 |
| Male | |||||
| Any membership | -0.097 | -0.115* | -0.152 | -0.108 | -0.058 |
| (0.096) | (0.068) | (0.097) | (0.143) | (0.135) | |
| R-squared | 0.229 | 0.204 | 0.348 | 0.300 | 0.111 |
| Observations | 154 | 154 | 154 | 154 | 154 |
| # of countries | 40 | 40 | 40 | 40 | 40 |
Note: Fixed effects regressions of deaths of despair on population share 60–64, population share 65+, male labour force participation, inflation rate, and wave dummies. Standard errors in parentheses (clustered by country); * p<0.10, ** p<0.05, *** p<0.01
How do deaths of despair relate to (un)happiness?
Although Northern European countries typically top the rankings in life evaluations, many of them (e.g., Finland) also experience relatively high rates of deaths of despair (see Figure 6.1). This seeming contradiction has been referred to as a puzzle in the past[62] and requires an explanation. In this section, we find that such countries are exceptions and we discuss the differences between deaths of despair and life evaluations that could give rise to these exceptional cases.
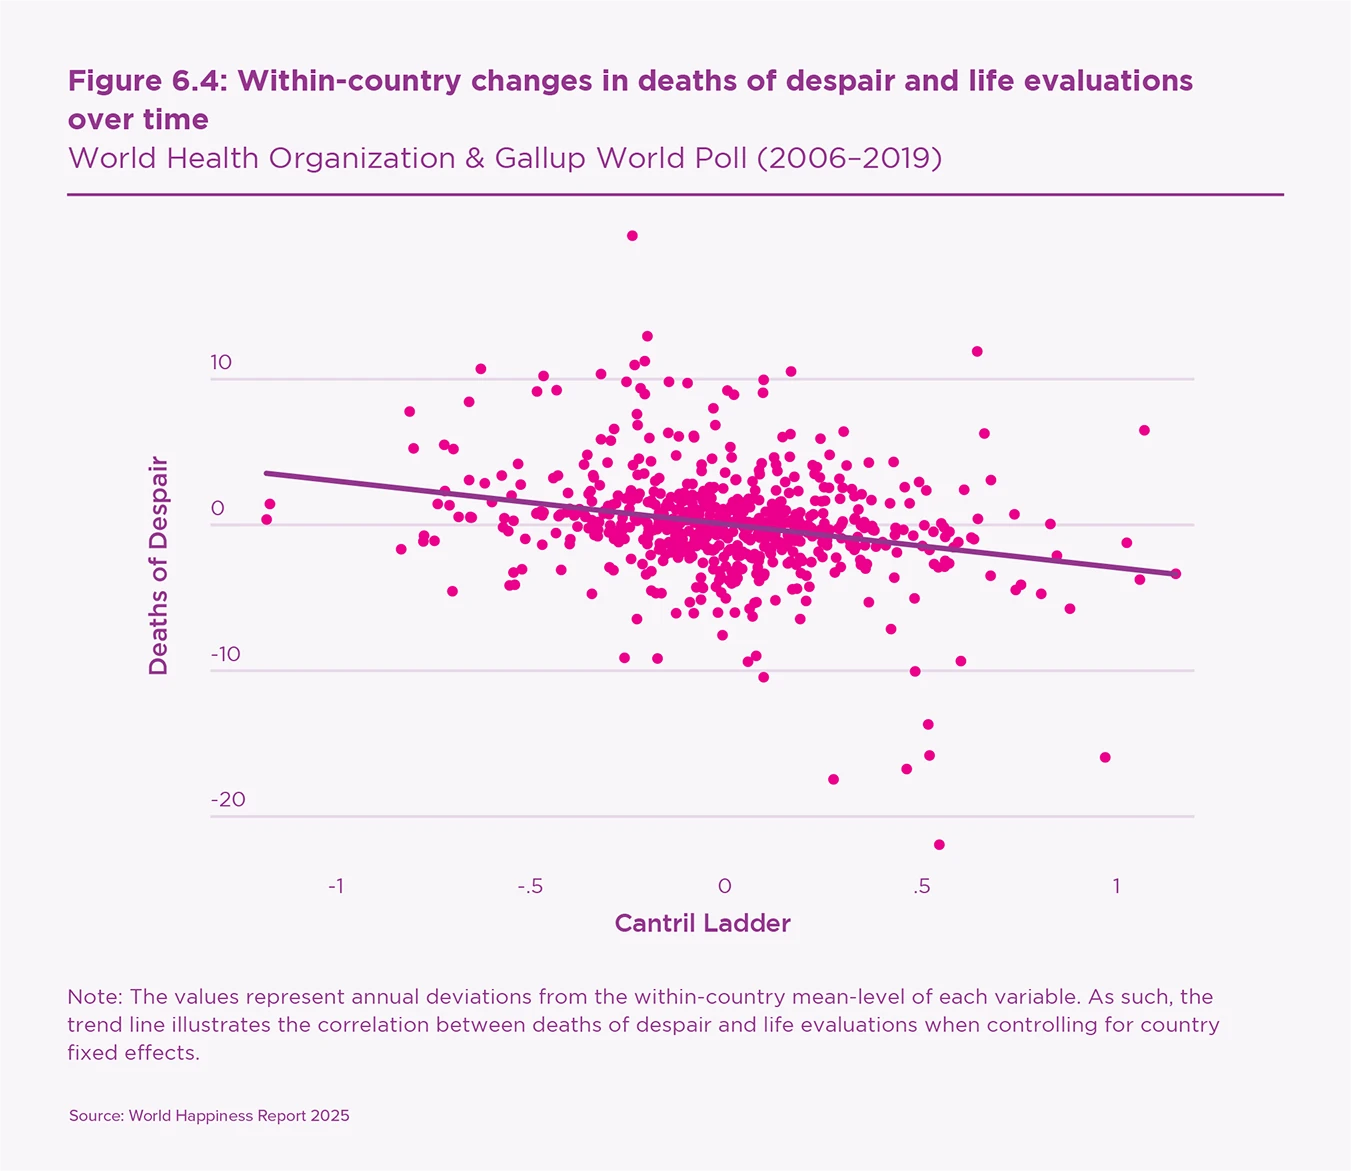
Figure 6.4 presents the relationship between annual, within-country changes in life evaluations and deaths of despair over time. The trend line illustrates increasing life evaluations are associated with decreasing deaths of despair. Generally, high life evaluations do not go with high deaths of despair. At the same time, the dispersion in dots indicates that the variables are not simply the opposite of each other. In fact, changing life evaluations explain less than 10% of changing deaths of despair. This inexact match is what empirically allows for countries like Finland to be high on both.
Although conceptually related, deaths of despair are distinct from life evaluations. Deaths of despair, as suggested by the name, result from negative feelings of despair, whereas life evaluations represent a cognitive evaluation of how one feels about their life. Negative feelings and cognitive evaluations correlate but are not simply the opposite of each other.[63] Furthermore, despair is more forward-looking than current negative feelings. Consequently, it is even less related to life evaluations conceptually than many other negative feelings.
We use the same technique presented in the previous section to analyse the empirical relation between deaths of despair and life evaluations. The presence of distinct patterns in their associations with our explanatory variables will help us pinpoint where deaths of despair and life evaluations differ. For this purpose, we expand the list of explanatory variables from the model presented in Table 6.7 by adding back GDP per capita and satisfaction with freedom, which were dropped in our variable selection process for deaths of despair, but are important in the World Happiness Report for life evaluations. We first assess prosocial behaviour as an explanatory variable and then one of its components, donations, because the World Happiness Report typically explains life evaluations using, among others, donations (labelled as generosity).
While it is possible for countries to have high deaths of despair and high life evaluations, these are exceptions.
To allow comparison across variables, we report the results in Table 6.11 using standardised variables, each adjusted to a common scale in line with standard practice. This is why the coefficient of prosocial behaviour in the first column of Table 6.11 is different from the coefficient in Table 6.7. The two coefficients are from the same model, except that the one in Table 6.11 comes from a standardised variable. Table 6.11 shows that, in standardised terms, donations have equivalent relations with both deaths of despair and life evaluations.[64]
The first thing to note is that the variables explain life evaluations better than deaths of despair. The R-squared, a measure of how well the model fits the data, is 0.40 for the Cantril Ladder and 0.29 for deaths of despair (see the bottom of columns 1 and 2).
The results also reveal deaths of despair are more sensitive to prosocial behaviour and the population structure, especially the population share aged 65+. Life evaluations are more sensitive to GDP per capita, freedom, and social support. In common, they have the male labour force participation rate (although of somewhat different magnitudes) and perceptions of corruption. The inflation rate and population share aged 60–64 are not statistically significant for either outcome.
In sum, while it is possible for countries to have high deaths of despair and high life evaluations, these are exceptions. Conceptually, deaths of despair are related to life evaluations, but also quite distinct. The former is a behaviour connected to hopelessness, while life evaluations are cognitive evaluations of one’s current life as a whole. Empirically, their determinants are similar but not the same. In any case, increasing prosocial behaviours, specifically donations, improves both outcomes, reducing deaths of despair and increasing life evaluations.
| (1) DoD | (2) Cantril Ladder | (3) DoD | (3) Cantril Ladder | |
|---|---|---|---|---|
| Prosocial | -0.076** | 0.038 | ||
| (0.048) | (0.369) | |||
| Donations | -0.129** | 0.122** | ||
| (0.019) | (0.017) | |||
| Labor Force Part. Male | -0.340*** | 0.242** | -0.317*** | 0.220* |
| (0.003) | (0.042) | (0.003) | (0.063) | |
| Inflation Rate | 0.032 | -0.016 | 0.031 | -0.015 |
| (0.235) | (0.559) | (0.235) | (0.571) | |
| Pop. Share 60-64 | -0.091 | -0.091 | -0.079 | -0.105 |
| (0.344) | (0.229) | (0.392) | (0.167) | |
| Pop. Share 65+ | -0.714*** | -0.014 | -0.723*** | 0.004 |
| (0.006) | (0.954) | (0.005) | (0.989) | |
| Support | -0.071* | 0.213*** | -0.067* | 0.210*** |
| (0.088) | (0.007) | (0.091) | (0.005) | |
| Corruption | 0.202*** | -0.186** | 0.194** | -0.184** |
| (0.009) | (0.015) | (0.011) | (0.011) | |
| ln(GDP pc) | -0.050 | 0.938*** | -0.046 | 0.953*** |
| (0.831) | (0.004) | (0.843) | (0.003) | |
| Freedom | -0.031 | 0.124** | -0.035 | 0.118** |
| (0.488) | (0.020) | (0.442) | (0.023) | |
| Observations | 620 | 620 | 620 | 620 |
| # of Countries | 50 | 50 | 50 | 50 |
| R-Squared | 0.293 | 0.400 | 0.302 | 0.409 |
Note: Regressions of deaths of despair and Cantril Ladder in levels on indicated variables and fixed effects for year and country. Standard errors in parentheses (clustered by country); * p<0.10, ** p<0.05, *** p<0.01

Conclusion
Deaths of despair – due to suicide, alcohol abuse, and drug overdose – generally declined from 2000 to 2019 in our sample of 59 countries, based on data from the World Health Organization. However, the number is still high and has risen in some cases, notably in the United States and Republic of Korea. On average, 23 per 100,000 people died from deaths of despair in 2019. One factor that can contribute to reducing deaths of despair is prosocial behaviour. Our analysis indicates that a ten percentage-point increase in the share of people engaging in prosocial behaviour is associated with approximately 1 fewer death per 100,000 people per year. For a country like the United Kingdom, which has a 15-and-older population of approximately 55 million, that is equivalent to about 550 people per year.[65]
Deaths of despair are not equally distributed across and within countries. In our sample, deaths in 2019 were fewest in Grenada and greatest in Slovenia. However, differences in cultural and institutional characteristics call for caution when comparing deaths of despair across countries. Within countries, deaths of despair were nearly four times higher among men than women; more than double among those aged 60+ compared to 15- to 29-year-olds; and were primarily due to suicide, which accounted for three out of every four deaths.
Prosocial behaviour generally decreased between 2006 and 2019. According to Gallup World Poll data, volunteering and donating money decreased, especially in high-income countries. Only the share of people helping others showed signs of growth, but this was limited to lower-middle-income countries. The general decrease in prosocial behaviours concerned men and women of all age groups in a similar manner. However, as shown in Chapter 2, there are signs of increasing prosocial behaviours since 2019, after the period of our analysis. Since data on deaths of despair end in 2019, we do not know whether these increases are associated with declining deaths of despair.
We extended the regression analysis to two other common measures of social capital: social trust and group participation. Sourced from the integrated European Values Study and World Values Survey dataset, these variables are available for a longer period of time, but for a smaller sample of countries compared to our analysis of prosocial behaviours. Results indicate similar negative within-country correlations between the two measures of social capital and deaths of despair but, in general, they were not statistically significant.
There are two aspects of our analysis worth emphasising. The first is that the technique we used evaluates the association between variables by matching their within-country changes over time. This limits concerns of international comparability which are a major problem in the analysis of mortality by cause. The second aspect is that the negative relationship between prosocial behaviour and deaths of despair holds after considering the contemporaneous changes of other variables, such as economic growth, unemployment rate, labour force participation, religiosity, and the share of elderly people, among others. This evidence is consistent with the hypothesis that prosocial behaviour constitutes an informal safety net whose benefits go beyond the donors and recipients,[66] and provides a buffer against adversities.[67]
We also investigated how a country could have both high deaths of despair and high life evaluations. First, deaths of despair and life evaluations reflect two related but distinct concepts. Second, our empirical results indicate that different factors contribute to each variable. Deaths of despair are more sensitive to the population structure, while life evaluations are more sensitive to GDP per capita, freedom, and social support. However, both variables are related to components of prosocial behaviour. In particular, a rise in donations similarly increases life evaluations as it decreases deaths of despair.
Although much of the previous research on deaths of despair has focussed on the United States, the trends documented in this chapter illustrate that the US is not representative of global trends. In the US and, to a lesser extent, Canada and the United Kingdom, deaths of despair rapidly increased from 2000 to 2019, especially among men aged 30 to 59, due to increasing drug abuse. However, most countries experienced decreasing deaths of despair over this period. Even among the countries that did experience rising deaths of despair, the pattern generally differed from the US. In these countries, the rise was due largely to increasing alcohol abuse among men aged 45+. The Republic of Korea exhibited yet another trend, experiencing a rise in suicides among older men aged 60+. The existence of such unique trends motivates additional research on deaths of despair around the world.
It is well established that prosocial behaviour contributes to individual wellbeing and to societies in which people are more supportive, cooperative, and trusting. This chapter further demonstrates that increasing prosocial behaviour is reliably connected to decreasing deaths of despair. Societies could benefit from investing in the conditions supporting prosocial behaviour.
References
Aknin, L. B., Dunn, E. W., & Norton, M. I. (2012). Happiness runs in a circular motion: Evidence for a positive feedback loop between prosocial spending and happiness. Journal of Happiness Studies, 13, 347-355.
Allik, M., Brown, D., Dundas, R., & Leyland, A.H. (2020). Deaths of despair: cause-specific mortality and socioeconomic inequalities in cause-specific mortality among young men in Scotland. International Journal for Equity in Health, 19, 215
Azevedo, J.P. (2011) “wbopendata: Stata module to access World Bank databases,” Statistical Software Components S457234, Boston College Department of Economics. http://ideas.repec.org/c/boc/bocode/s457234.html
Bartolini, S., Bilancini, E., & Pugno, M. (2013). Did the decline in social connections depress Americans’ happiness?. Social Indicators Research, 110, 1033-1059.
Berkman, L. F., Glass, T., Brissette, I., & Seeman, T. E. (2000). From social integration to health: Durkheim in the new millennium. Social Science & Medicine, 51(6), 843–857.
Berkman, L. F. (1995). The role of social relations in health promotion. Psychosomatic Medicine, 57(3), 245-254.
Blanchflower, D. G., & Oswald, A. J. (2020). Trends in extreme distress in the United States, 1993–2019. American Journal of Public Health, 110(10), 1538-1544.
Camacho, C., Webb, R. T., Bower, P., & Munford, L. (2024). Risk factors for deaths of despair in England: An ecological study of local authority mortality data. Social Science & Medicine, 342, 116560.
Case, A., & Deaton, A. (2015). Rising morbidity and mortality in midlife among white non-Hispanic Americans in the 21st century. Proceedings of the National Academy of Sciences of the United States of America, 112(49), 15078–15083.
Case, A., & Deaton, A. (2017). Mortality and morbidity in the 21st century. Brookings Papers on Economic Activity 2017(1), 397–476.
Case, A., & Deaton, A. (2020a). Deaths of Despair and the Future of Capitalism. Princeton University Press.
Case, A., & Deaton, A. (2020b). The epidemic of despair: Will America’s mortality crisis spread to the rest of the world?. Foreign Affairs, 99(2), 92–102.
Case, A., & Deaton, A. (2022). The great divide: education, despair, and death. Annual Review of Economics, 14(1), 1-21.
Chuang, Y. C., Huang, Y. L., Tseng, K. C., Yen, C. H., & Yang, L. H. (2015). Social capital and health-protective behavior intentions in an influenza pandemic. PloS one, 10(4), e0122970.
Cohen, S., & Wills, T. A. (1985). Stress, social support, and the buffering hypothesis. Psychological Bulletin, 98(2), 310.
Cohen, S. (2004). Social Relationships and Health. American Psychologist, 59(8), 676-684.
Cohen, D. A., Inagami, S., & Finch, B. (2008). The built environment and collective efficacy. Health & Place, 14(2), 198-208.
Costa, D., & Kahn, M. E. (2001). Understanding the decline in social capital, 1952-1998. NBER Working Papers 8295
Curry, O. S., Rowland, L. A., Van Lissa, C. J., Zlotowitz, S., McAlaney, J., & Whitehouse, H. (2018). Happy to help? A systematic review and meta-analysis of the effects of performing acts of kindness on the well-being of the actor. Journal of Experimental Social Psychology, 76, 320-329.
Daly, M., & Macchia, L. (2023). Global trends in emotional distress. Proceedings of the National Academy of Sciences, 120(14), e2216207120.
Diez Roux, A. V. (2017). Despair as a cause of death: more complex than it first appears. American Journal of Public Health, 107, 1566–1567.
Dunn, E. W., Aknin, L. B., & Norton, M. I. (2008). Spending money on others promotes happiness. Science, 319(5870), 1687–1688.
EVS (2021). EVS Trend File 1981–2017. GESIS Data Archive, Cologne. [ZA7503 Data file Version 3.0.0]. https://doi.org/10.4232/1.14021.
Frey, B. S., & Meier, S. (2004). Social comparisons and pro-social behavior: Testing “conditional cooperation” in a field experiment. American Economic Review, 94(5), 1717-1722.
Friedman, S.R., Krawczyk, N., Perlman, D.C., Mateu-Gelabert, P., Ompad, D.C., Hamilton, L., Nikolopoulos, G., Guarino, H., & Cerd´a, M., (2020). The opioid/overdose crisis as a dialectics of pain, despair, and one-sided struggle. Frontiers in Public Health, 8, 540423.
Galbraith, J. K. (2009). The Great Crash 1929. Houghton Mifflin Harcourt.
Gallup (2024). Gallup World Poll. Version 031524, Washington DC: Gallup.
Graham, C., & Pinto, S. (2019). Unequal hopes and lives in the USA: Optimism, race, place, and premature mortality. Journal of Population Economics, 32(2), 665-733.
Graham, C., & Pinto, S. (2021). The geography of desperation in America: Labor force participation, mobility, place, and well-being. Social Science & Medicine, 270, 113612.
Haerpfer, C., Inglehart, R., Moreno, A., Welzel, C., Kizilova, K., Diez-Medrano, J., Lagos, M., Norris, P., Ponarin, E., & Puranen, B., et al. (Eds.). (2022). World Values Survey Trend File (1981-2022) Cross-National Data-Set. Madrid, Spain & Vienna, Austria: JD Systems Institute & WVSA Secretariat. [Data File Version 2.0.0]. https://doi.org/10.14281/18241.27
Helliwell, J. F. (2006). Well‐being, social capital and public policy: what’s new?. The Economic Journal, 116(510), C34-C45.
Helliwell, J. F. (2007). Well-being and social capital: Does suicide pose a puzzle?. Social indicators Research, 81, 455-496.
Helliwell, J. F., & Huang, H. (2008). How’s your government? International evidence linking good government and well-being. British Journal of Political Science, 38(4), 595-619.
Helliwell, J. F., Huang, H., & Wang, S. (2014). Social capital and well-being in times of crisis. Journal of Happiness Studies, 15, 145-162.
Helliwell, J. F., & Putnam, R. D. (2004). The social context of well–being. Philosophical Transactions of the Royal Society of London. Series B: Biological Sciences, 359(1449), 1435-1446.
Helliwell, J. F., & Wang, S. (2011). Trust and wellbeing. International Journal of Wellbeing, 1(1), 42–78.
House, J. S., Landis, K. R., & Umberson, D. (1988). Social relationships and health. Science, 241(4865), 540-545.
Holt-Lunstad, J., Smith, T. B., & Layton, J. B. (2010). Social relationships and mortality risk: a meta-analytic review. PLoS medicine, 7(7), e1000316.
Hui, B. P., Ng, J. C., Berzaghi, E., Cunningham-Amos, L. A., & Kogan, A. (2020). Rewards of kindness? A meta-analysis of the link between prosociality and well-being. Psychological Bulletin, 146(12), 1084.
ILO (2014). Table B.16. Public social protection expenditure, 1995 to latest available year (percentage of GDP). Available at http://www.social-protection.org/gimi/gess/RessourceDownload.action?ressource.ressourceId=54614.
ILO (2024). Annex 6 General government actual expenditure on social protection including and excluding health care, latest available year (percentage of GDP). In World Social Protection Report 2024–26: Universal social protection for climate action and a just transition, ILO Geneva. Accessed October 2024. https://doi.org/10.54394/ZMDK5543
IMF (2024). Government Finance Statistics (GFS), Expenditure by Function of Government, updated June 27, 2020. Accessed: June 2024. Available at https://data.imf.org/?sk=388dfa60-1d26-4ade-b505-a05a558d9a42\&sid=1479329334655
Islam, M. K., Gerdtham, U. G., Gullberg, B., Lindström, M., & Merlo, J. (2008). Social capital externalities and mortality in Sweden. Economics & Human Biology, 6(1), 19-42.
Karanges, E.A., Blanch, B., Buckley, N.A., Pearson, S.A., (2016). Twenty-five years of prescription opioid use in Australia: a whole-of-population analysis using pharmaceutical claims. British Journal of Clinical Pharmacology, 82, 255–267.
Kapteyn, A., Lee, J., Tassot, C., Vonkova, H., & Zamarro, G. (2015). Dimensions of subjective well-being. Social Indicators Research, 123, 625-660.
Kawachi, I., & Berkman, L. F. (2001). Social ties and mental health. Journal of Urban Health: Bulletin of the New York Academy of Medicine, 78, 458–467.
Kawachi, I., Subramanian, S. V., & Kim, D. (2008). Social capital and health: A decade of progress and beyond. In I. Kawachi, S. Subramanian, & D. Kim (Eds.), Social Capital and Health (pp. 1-26). Springer New York.
Kennedy, B. P., Kawachi, I., & Brainerd, E. (1998). The role of social capital in the Russian mortality crisis. World Development, 26(11), 2029-2043.
Kim, D., Baum, C. F., Ganz, M. L., Subramanian, S. V., & Kawachi, I. (2011). The contextual effects of social capital on health: a cross-national instrumental variable analysis. Social Science & Medicine, 73(12), 1689-1697.
Knapp, E.A., Bilal, U., Dean, L.T., Lazo, M., Celentano, D.D., (2019). Economic insecurity and deaths of despair in US counties. American Journal of Epidemiology, 188, 2131–2139.
Kumar, S., Calvo, R., Avendano, M., Sivaramakrishnan, K., & Berkman, L. F. (2012). Social support, volunteering and health around the world: Cross-national evidence from 139 countries. Social Science & Medicine, 74(5), 696-706.
Lochner, K. A., Kawachi, I., Brennan, R. T., & Buka, S. L. (2003). Social capital and neighborhood mortality rates in Chicago. Social Science & Medicine, 56(8), 1797-1805.
Lynch, J., Due, P., Muntaner, C., & Smith, G. D. (2000). Social capital—Is it a good investment strategy for public health?. Journal of Epidemiology & Community Health, 54(6), 404-408.
Mikkelsen, L., Phillips, D. E., AbouZahr, C., Setel, P. W., De Savigny, D., Lozano, R., & Lopez, A. D. (2015). A global assessment of civil registration and vital statistics systems: monitoring data quality and progress. The Lancet, 386(10001), 1395-1406.
Musick, M. A., & Wilson, J. (2003). Volunteering and depression: The role of psychological and social resources in different age groups. Social Science & Medicine, 56(2), 259-269.
Nelson, S. K., Layous, K., Cole, S. W., & Lyubomirsky, S. (2016). Do unto others or treat yourself? The effects of prosocial and self-focused behavior on psychological flourishing. Emotion, 16(6), 850–861.
Nyqvist, F., Pape, B., Pellfolk, T., Forsman, A. K., & Wahlbeck, K. (2014). Structural and cognitive aspects of social capital and all-cause mortality: a meta-analysis of cohort studies. Social Indicators Research, 116, 545-566.
O’Connor, K. J., & Graham, C. (2019). Longer, more optimistic, lives: Historic optimism and life expectancy in the United States. Journal of Economic Behavior & Organization, 168, 374-392.
OECD (2024). Social Expenditure - Aggregated data. OECD, Accessed May 2024. Available at https://stats.oecd.org/Index.aspx?DataSetCode=SOCX\_AGG\#.
OECD (2013). OECD Guidelines on Measuring Subjective Well-being, OECD Publishing. http://dx.doi.org/10.1787/9789264191655-en.
Peacock, A., Leung, J., Larney, S., Colledge, S., Hickman, M., Rehm, J., Giovino, G.A., West, R., Hall, W., et al., (2018). Global statistics on alcohol, tobacco and illicit drug use: 2017 status report. Addiction, 113, 1905–1926.
Pescosolido, B. A. (1992). Beyond rational choice: The social dynamics of how people seek help. American Journal of Sociology, 97(4), 1096-1138.
Putnam, R. D. (2000). Bowling alone: The collapse and revival of American community. Simon Schuster.
Raposa, E. B., Laws, H. B., & Ansell, E. B. (2016). Prosocial behavior mitigates the negative effects of stress in everyday life. Clinical Psychological Science, 4(4), 691-698.
Rowland, L., & Curry, O. S. (2019). A range of kindness activities boost happiness. The Journal of Social Psychology, 159(3), 340-343.
Roxburgh, A., Hall, W.D., Dobbins, T., Gisev, N., Burns, L., Pearson, S., Degenhardt, L., (2017). Trends in heroin and pharmaceutical opioid overdose deaths in Australia. Drug and Alcohol Dependence. 179, 291–298.
Rönnerstrand, B. (2014). Social capital and immunization against the 2009 A (H1N1) pandemic in the American States. Public Health, 128(8), 709-715.
Sarracino, F., & Mikucka, M. (2017). Social capital in Europe from 1990 to 2012: Trends and convergence. Social Indicators Research, 131(1), 407-432.
Shang, J., & Croson, R. (2009). A field experiment in charitable contribution: The impact of social information on the voluntary provision of public goods. The Economic Journal, 119(540), 1422-1439.
Shirzad, M., Yenokyan, G., Marcell, A. V., & Kaufman, M. R. (2024). Deaths of despair-associated mortality rates globally: a 2000–2019 sex-specific disparities analysis. Public Health, 236, 35-42.
Siddiqi, A., Sod-Erdene, O., Hamilton, D., Cottom, T.M., & Darity, W., (2019). Growing sense of social status threat and concomitant deaths of despair among whites. SSM - Population Health, 9, 100449.
Sin, N. L., Klaiber, P., Wen, J. H., & DeLongis, A. (2021). Helping amid the pandemic: Daily affective and social implications of COVID-19-related prosocial activities. The Gerontologist, 61(1), 59-70.
Snowdon, J., & Choi, N. G. (2020). Undercounting of Suicides: Where Suicide Data Lie Hidden. Global Public Health, 15(12), 1894–1901.
Solt, F. (2019). The Standardized World Income Inequality Database, Versions 8-9, https://doi.org/10.7910/DVN/LM4OWF, Harvard Dataverse, V11. swiid9_6_summary.csv
Thoits, P. A. (1985). Social support and psychological well-being: Theoretical possibilities. In I.G. Sarason, I.G. & B.R. Sarason (Eds.), Social support: Theory, research and applications (pp. 51–72). Springer Netherlands.
Thoits, P. A. (1986). Social support as coping assistance. Journal of Consulting and Clinical Psychology, 54, 416– 423.
Thoits, P. A. (2011a). Mechanisms Linking Social Ties and Support to Physical and Mental Health. Journal of Health and Social Behavior, 52(2), 145-161.
Thoits, P. A. (2011b). Perceived Social Support and the Voluntary, Mixed, or Pressured Use of Mental Health Services. Society and Mental Health, 1(1), 4-19.
Thoits, P. A., & Hewitt, L. N. (2001). Volunteer work and well-being. Journal of Health and Social Behavior, 42(2), 115–131.
Umberson, D., Crosnoe, R., & Reczek, C. (2010). Social relationships and health behavior across the life course. Annual Review of Sociology, 36(1), 139-157.
WHO (2020) WHO methods and data sources for country-level causes of death 2000-2019, Global Health Estimates Technical Paper WHO/DDI/DNA/GHE/2020.2, WHO, Geneva.
WHO (2024a) WHO Mortality Database: Interactive platform visualizing mortality data, Deaths by sex and age group for a selected country or area and year, World Health Organization, Accessed: 10 April 2024: Alcohol Use Disorders; All Causes; Drug Use Disorders; Self-Inflicted Injuries, and Accessed: 20 August 2024: Ill-Defined Injuries.
WHO (2024b) WHO Mortality Database: Interactive platform visualizing mortality data, Data usability: completeness and proportion of ill-defined or non-specific causes, World Health Organization, Accessed: 25 September 2024.
World Bank (2024a) World Bank Country and Lending Groups, Accessed 30 July 2024, https://datahelpdesk.worldbank.org/knowledgebase/articles/906519-world-bank-country-and-lending-groups.
World Bank (2024b) World Development Indicators, World Bank, Accessed: 27 November 2024, using Azevedo, J.P. (2011).
World Bank (2024c) Worldwide Governance Indicators 2024 Update, World Bank, Accessed 30 October 2024. https://www.worldbank.org/en/publication/worldwide-governance-indicators.
Zeglin, R. J., Niemela, D. R. M., & Baynard, C. W., (2019). Deaths of despair in Florida: assessing the role of social determinants of health. Health Education & Behaviour, 46, 329–339.
Endnotes
Case and Deaton (2015, 2017) ↩︎
While preparing this chapter, a new article came out documenting global trends of deaths of despair. Shirzad et al. (2024) obtain some similar results describing the trends, but their aim and analyses differ. ↩︎
Daly and Macchia (2023) ↩︎
Allik et al. (2020); Karanges et al. (2016); Peacock et al. (2018); Roxburgh et al. (2017) ↩︎
Blanchflower and Oswald (2020) ↩︎
Graham and Pinto (2019, 2021); O’Connor & Graham (2019) ↩︎
Case and Deaton (2017) ↩︎
Case and Deaton (2020a) ↩︎
Friedman et al. (2020) ↩︎
Friedman et al. (2020) ↩︎
Diez Roux (2017); Siddiqi et al. (2019) ↩︎
Case and Deaton (2017) ↩︎
Zeglin et al. (2019) ↩︎
Allik et al. (2020); Brown et al. (2019) ↩︎
Knapp et al. (2019) ↩︎
Helliwell (2006, 2007) ↩︎
We present rates of deaths of despair as the number of deaths per 100,000 for the population aged 15 and above because this allows us to compare countries of different population sizes. Throughout the chapter, we will use this normalisation. Any reference to the number of deaths of despair is per 100,000. ↩︎
23 ÷ 100,000 x 55,000,000≅12,500. The population aged 15 and above in the UK is approximately 55 million. ↩︎
South Africa had fewer deaths of despair than Grenada. However, the level of deaths of despair in South Africa were not very comparable, because we had to adjust the figures for South Africa. Our measure of suicides generally includes deaths due to undetermined intent, in accordance with the literature as described in Online Appendix A. However, due to a break in the series for South Africa, we dropped deaths due to undetermined intent for South Africa, which mechanically reduces their levels of deaths. This adjustment should not greatly affect the changes in deaths of despair over time for South Africa, and has thus been left in the rest of the sample. ↩︎
Data are from the year 2019 for most countries. However, Republic of Moldova uses the most recent available year, 2018. We focus on the pre-COVID-19 period due to data availability and because the pandemic might have affected prosocial behaviours and deaths of despair in exceptional ways. ↩︎
The WHO Mortality Database includes annual mortality statistics by sex, age, and harmonised causes of death. Only countries that record at least 65% of deaths with a specific cause, classified according to International Classification of Diseases (ICD) were included by the WHO. The alternative WHO Health Inequality Data Repository (https://whoequity.shinyapps.io/heat/) includes similar cause of death data by sex, in five year intervals from 2001 to 2021, and with more countries than the WHO Mortality Database. We use the WHO Mortality Database for two reasons. First, the statistics from both databases stem from the same source, i.e., the WHO Global Health Estimates. However, the WHO Mortality Database only retains the countries with reliable data (WHO 2020). Second, the WHO Health Inequality Data Repository does not disaggregate by age nor include annual data. ↩︎
For instance, Camacho et al. (2024). ↩︎
See footnote 21. ↩︎
Mikkelsen et al. (2015) ↩︎
Snowdon and Choi (2020) ↩︎
1,045 deaths per 100,000 is the average value of deaths from all causes across countries in 2019, using the same sample of countries and data from WHO Mortality Database on all cause mortality. ↩︎
In economics, convergence refers to the observation that countries with low initial Gross Domestic Product (GDP) exhibit faster rates of GDP growth. This concept has been recently extended to changes of social capital over time (Sarracino and Mikucka, 2017). ↩︎
Kumar et al. (2012) ↩︎
Aknin et al. (2012); Dunn et al. (2008); Curry et al. (2018); Rowland and Curry (2019); Hui et al. (2020). ↩︎
Thoits and Hewitt (2001); Musick and Wilson (2003) ↩︎
Nelson et al. (2016) ↩︎
Cohen and Wills (1985) ↩︎
Helliwell, Huang, and Wang (2014) ↩︎
Thoits (1986) ↩︎
Thoits and Hewitt (2001) ↩︎
Putnam (2000) ↩︎
Berkman (1995); Cohen and Wills (1985); Kawachi and Berkman (2001); Cohen (2004); Thoits (2011a); Kawachi et al. (2008); Berkman et al. (2000); Helliwell and Putnam (2004); Helliwell (2007); Helliwell et al. (2014) ↩︎
Cohen and Wills (1985) ↩︎
Thoits (1985); Thoits (2011a); Berkman (1995) ↩︎
Kawachi and Berkman (2001) ↩︎
Thoits (2011b); Umberson, Crosnoe, and Reczek (2010) ↩︎
Pescosolido (1992) ↩︎
Cohen and Wills (1985); House, Landis, and Umberson (1988); Chuang et al. (2015); Ronnerstrand (2014); Lynch et al. (2000); Nyqvist et al. (2014); Holt-Lunstad et al. (2010); Kim et al. (2011); Kennedy et al. (1998) ↩︎
Lochner et al. (2003) ↩︎
Islam et al. (2008) ↩︎
Cohen et al. (2008) ↩︎
Each component is assessed through responses to the question: “In the past month, have you done any of the following? A. Donated money to a charity; B. Volunteered your time to an organisation; C. Helped a stranger or someone you didn’t know who needed help.” For a discussion of prosocial behaviour more generally, see Chapter 2. ↩︎
Putnam (2000); Costa and Kahn (2001); Bartolini et al. (2013) ↩︎
We have identified too many relevant variables with overlapping concepts. As opposed to subjectively choosing a subset of variables, we perform a data-driven variable selection procedure. We begin our analysis including each variable, then we sequentially drop the least statistically significant variable one at a time and rerun the regression. We continue this procedure until all of the retained variables reach a specified level of statistical significance (with t-statistics above 1.00). Through this procedure, we reduced our initial set of 20 explanatory variables (including prosocial behaviour) to a set of 7 without a significant drop in explanatory power. This analysis is presented in Table B7 in the online appendix. For robustness, we also used the alternative lasso approach for variable selection and retained a similar set of variables. ↩︎
Graham and Pinto (2021) ↩︎
We omit the population shares 0–14 and 15–29 because it is necessary to omit one group to estimate the model and our full sample is based on ages 15+. ↩︎
These groups also tend to have different labour market statuses, which is important to account for in order for labour force participation rate to capture the mechanism that we intend it to. Decreases in the participation rate conditional on the population structure are more likely to capture discouraged workers than students or retirees. ↩︎
Helliwell (2006) ↩︎
Graham and Pinto (2019) ↩︎
Helliwell (2007) ↩︎
For a discussion of latitude and suicide, see Helliwell (2007). ↩︎
The full set of controls before variable selection are in Table B7 in the online appendix. ↩︎
As evidenced by the adjusted R-squareds presented in Table B7 in the online appendix. They are nearly the same in the regression with 20 variables as in the regression with 7. ↩︎
Case and Deaton (2022) ↩︎
Social trust is the share of people (0–100) who respond “most people can be trusted” to the following question: “Generally speaking, would you say that most people can be trusted or that you need to be very careful in dealing with people?” Group membership is the share of people (0-100) who are a member of any of the following types of organisation: (1) church or religious organisation, (2) sport or recreational organisation, (3) art, music or educational organisation, (4) environmental organisation. ↩︎
As was found in earlier studies of suicides using earlier samples of WVS data, and reported in Helliwell (2006, 2007) and Helliwell & Wang (2011). ↩︎
Helliwell (2007) ↩︎
OECD (2013); Kapteyn et al. (2015) ↩︎
This replicates the results using earlier WVS data, where both memberships (and also social trust) were found to have the same standardised effects in equations for life satisfaction and suicide (Helliwell 2007, Figure 5) ↩︎
Additional factors may simultaneously explain deaths of despair in certain countries, such as those discussed in the introduction (e.g., social and economic marginalisation). The focus in this chapter has been on prosocial behaviour, the relation of which we isolated from plausible alternative explanations (including numerous economic and social variables) to provide a more reliable estimate of its impact. We encourage researchers to explore additional explanations in future analysis. ↩︎
Frey and Meier (2004); Shang and Croson (2009). ↩︎
Raposa et al. (2016); Sin et al. (2021) ↩︎