Caring and sharing: Global analysis of happiness and kindness
Key insights
Happiness and benevolence rankings
- Our annual happiness ranking is, once again, led by Nordic countries, with Finland still first among them.
- The Nordic countries also rank among the top places for expected and actual return of lost wallets.
- Country rankings for the three benevolent acts covered by the Gallup World Poll – donating, volunteering, and helping strangers – vary depending on cultural and institutional differences.
Review of previous findings
- Research shows that the wellbeing benefits of benevolent acts depend on why and how people do things for others.
- Both helpers and recipients experience greater happiness from caring and sharing in the context of three Cs: caring connections, choice, and clear positive impact.
Our new results on caring and sharing
- During 2024, the COVID-era surge in benevolent acts fell significantly but remains more than 10% higher than 2017–19 levels almost everywhere.
- In 2024, helping strangers remains significantly higher than in 2017–19 in all global regions, by a global average of 18%.
- Expecting kindness from others is a stronger predictor of happiness than major actual or expected harms (Figure 2.4).
- People are too pessimistic about the kindness of their communities. The return rate of lost wallets is much higher than people expect, especially in the Nordic countries, which have the highest rates of both expected and actual wallet returns.
- Engaging in benevolent acts and expecting kindness from others both matter for individual happiness levels. The effect of expected wallet return is almost twice as large as for the frequency of benevolent acts (Figure 2.4).
- Across countries, expected wallet return significantly predicts the return of wallets dropped in experiments.
- Happiness inequality within countries has increased by about one-quarter over the past two decades, while happiness inequality between countries has remained roughly constant (Figure 2.5).
- Expected fairness and kindness reduce happiness inequality and add to the benefits of trust and social connections (Figures 2.6 and 2.7).
- On average, countries that provide more untied official development assistance (ODA) are happier. Countries with high refugee population shares are less happy, as refugee flows are more often based on location than invitation.
Setting the stage
In World Happiness Report 2024, we studied happiness by age group and birth cohort, finding contrasting patterns in different parts of the world. We also continued to show how three types of benevolent acts – donating, volunteering, and helping strangers – changed during the COVID-19 years. We previously found a global surge in benevolent acts during 2020, led by the helping of strangers, which continued through subsequent years. Last year, we found these acts to be prevalent in all generations, especially among Millennials and Gen Z. We suggested that this upsurge of benevolent acts might have led people to feel better about themselves and their neighbours. These positive wellbeing effects appear to have offset the negative effects felt by many of those whose lives were changed, endangered, and sometimes harmed during the pandemic.
We also found that feelings of social support were twice as common as feelings of loneliness and had larger connections to life evaluations.[1] In World Happiness Report 2021, we found that people who felt others in their communities were watching their backs and would return a lost wallet were far happier with their lives. Seeing kindness in one’s community provides a greater happiness boost than the absence of violent crime, mental illness, or having a much higher income. These findings, along with the relative stability of life evaluations during COVID-19, led us to dig deeper into these questions.
This year, we present several strands of evidence on our theme of caring and sharing. First, we deliver our usual rankings of nations in terms of the average life evaluations of their residents, along with our modelling of how differences across countries and over time are connected to a variety of life circumstances and the prevalence of positive and negative emotions. The main life circumstances we consider continue to be GDP per capita, healthy life expectancy, having someone to count on, having a sense of freedom to make key life decisions, average frequency of donations,[2] and perceptions of corruption in government and business.
Next, we present rankings (using 2022–2024 data) for the three benevolent acts covered in every Gallup World Poll plus national perceptions, from the 2019 Lloyd’s Register Foundation World Risk Poll, of the likelihood of the return of a lost wallet if found by: (a) a neighbour, (b) a stranger, or (c) a police officer. As we shall see, each of these three wallet questions captures different aspects of society. The benevolence of neighbours represents the local social context, while expected wallet return by strangers reflects the broader social fabric. The expectation of wallet return by a police officer captures the perceived honesty and benevolence of an important public institution. We later track time trends of the three Gallup World Poll benevolence measures from 2006 through 2024.
We then survey the large literature that considers the conditions under which benevolent acts are likely to be of more benefit to givers and receivers. In doing so, we present evidence on the link between individual benevolent actions, wellbeing, and the social context.
Another central social issue relates to the distribution of wellbeing. We have previously shown that within-country inequality of wellbeing has been increasing over the past twenty years and that this inequality is less in high-trust environments. This year, we show how living in a society believed to be benevolent mitigates the harmful effects of unfortunate circumstances and thereby reduces the inequality of wellbeing.
Finally, we report on the extent of international caring and sharing and its possible linkages to national happiness. We consider both the levels of official development assistance and each country’s population share of refugees.
Box 2.1: Measuring subjective wellbeing
Our measurement of subjective wellbeing continues to rely on three main wellbeing indicators: life evaluations, positive emotions, and negative emotions (with the last two often referred to as positive and negative affect). Our happiness rankings are based on life evaluations, as the more stable measure of the quality of people’s lives.
Life evaluations
The Gallup World Poll, which remains the principal source of data in this report, asks respondents to evaluate their current life as a whole using the image of a ladder, with the best possible life for them as a 10 and the worst possible as a 0. Each respondent provides a numerical response on this scale, referred to as the Cantril Ladder. Typically, around 1,000 responses are gathered annually for each country. Weights are used to construct population-representative national averages for each year in each country. We base our happiness ranking on a three-year average of these life evaluations since the larger sample size enables more precise estimates.
Positive emotions
Positive affect is given by the average of individual yes or no answers about three positive emotions: laughter, enjoyment, and interest (for details see Box 2.2).
Negative emotions
Negative affect is given by the average of individual yes or no answers about three negative emotions: worry, sadness, and anger.
Comparing life evaluations and emotions
Life evaluations provide the most informative measure for international comparisons because they capture quality of life in a more complete and stable way than emotional reports based on daily experiences.
Life evaluations vary more between countries than emotions and are better explained by the diverse life experiences in different countries. Emotions yesterday are well explained by events of the day being asked about, while life evaluations more closely reflect the circumstances of life as a whole. In Table 2.1, we show that emotions are significant supports for life evaluations.
Positive emotions are still more than twice as frequent as negative emotions, even during the years since the onset of COVID-19.
Happiness ranking
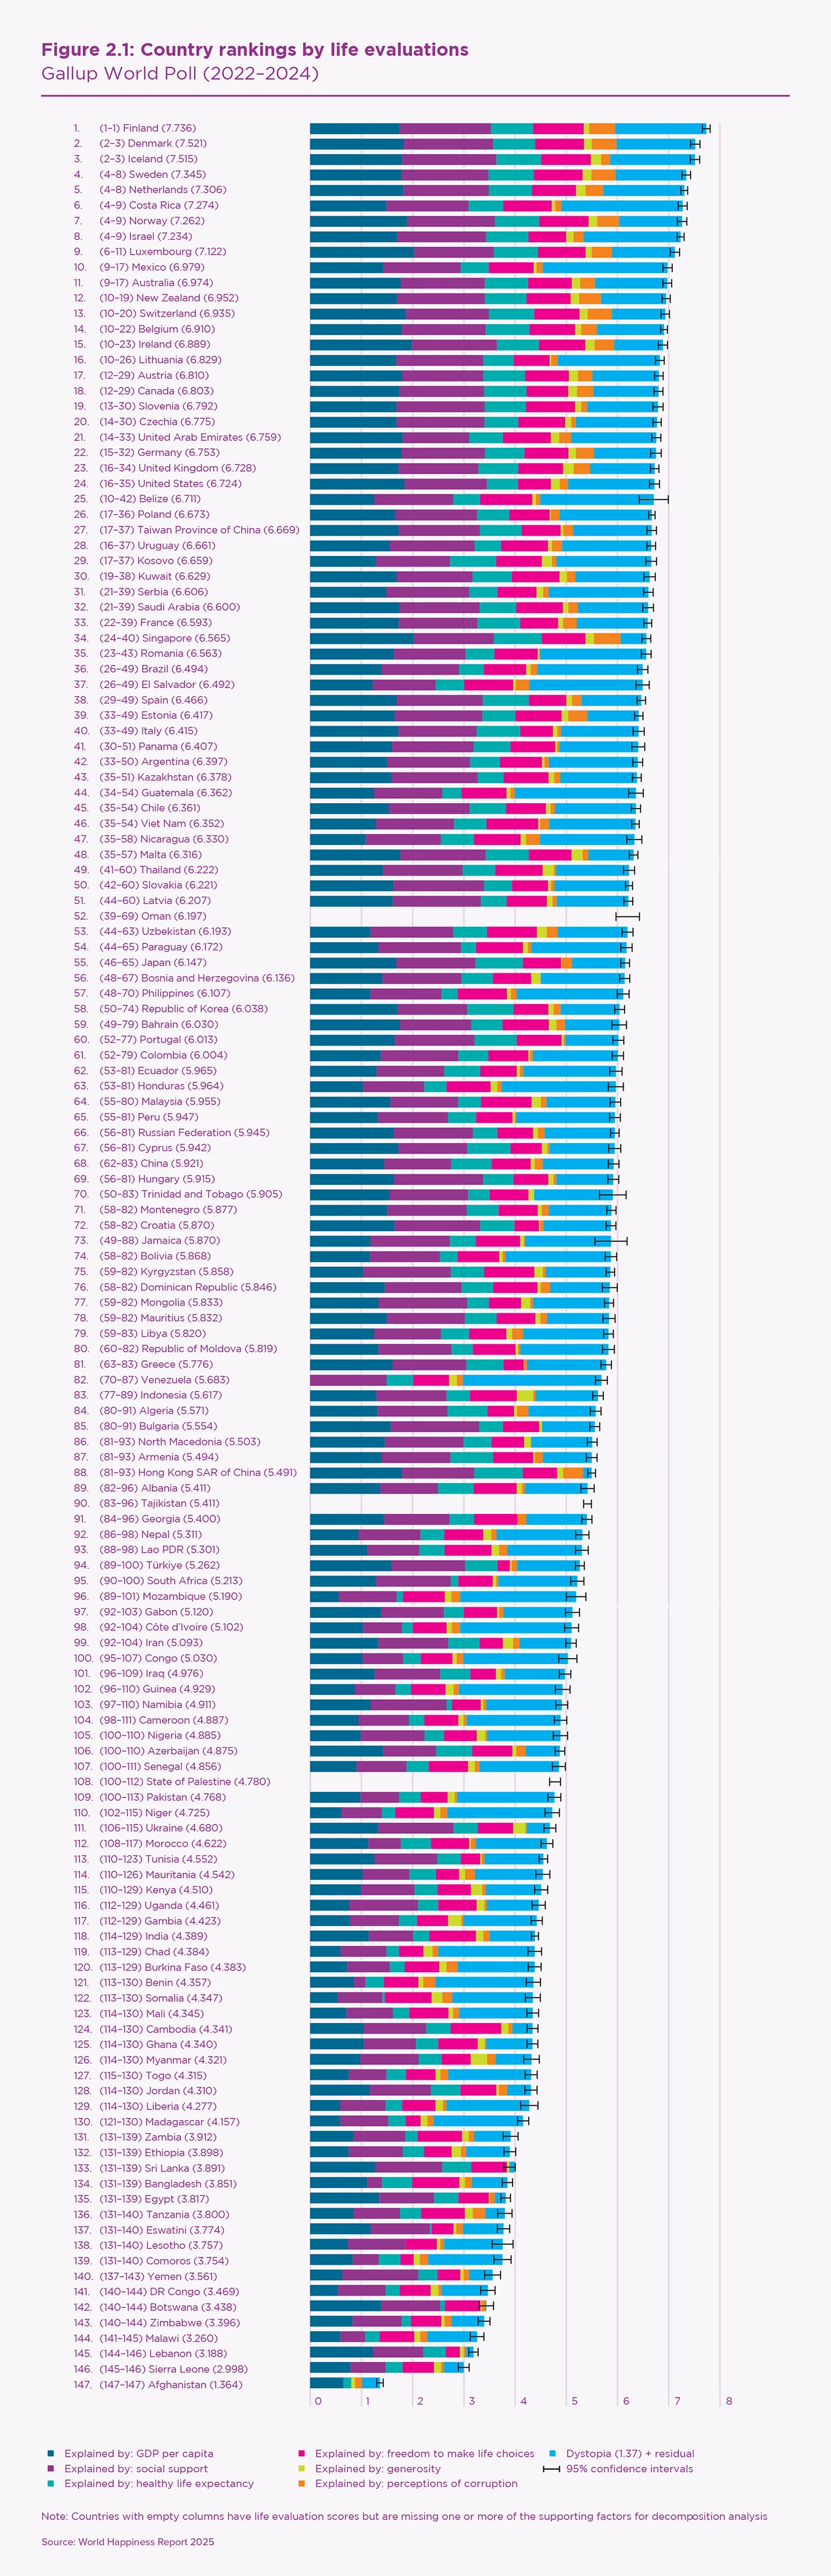
Countries are ranked according to their self-assessed life evaluations averaged over the years 2022–2024.[3] The overall length of each country bar in Figure 2.1 represents the average response to the Cantril Ladder question in the Gallup World Poll. The confidence intervals for each country’s average life evaluation are shown by horizontal whiskers at the right-hand end of each country bar. Confidence intervals for each country’s rank are displayed in brackets to the right of the rank number.[4] These ranking ranges are wider where there are many countries with similar averages and for countries with smaller sample sizes.[5]
Figure 2.1 includes colour-coded sub-bars in each country row representing the extent to which six key variables contribute to explaining life evaluations. These variables (described in more detail in Box 2.2) are log GDP per capita, social support, healthy life expectancy, freedom, generosity, and corruption. As already noted, our happiness rankings are not based on any index of these six factors. Rather, rankings are based on individuals’ assessments of their own lives, in particular their answers to the single-item Cantril Ladder life evaluation question. We use observed data on the six variables and estimates of their associations with life evaluations to help explain the variation of life evaluations across countries, much as epidemiologists estimate the extent to which life expectancy is affected by factors such as smoking, exercise, and diet.
Each of the country bars in Figure 2.1 is divided into seven segments, showing our research efforts to find possible sources for the ladder levels. The first six sub-bars show how much each of the six key variables is calculated to contribute to that country’s ladder score, relative to that in a hypothetical country called ‘Dystopia’, so named because it has values equal to the world’s lowest national averages for 2022–2024 for each of the six key variables used in Table 2.1. We use Dystopia as a benchmark against which to compare contributions from each of the six factors. The choice of Dystopia as a benchmark permits every real country to have a positive (or at least zero) contribution from each of the six factors. We calculate, based on the estimates in the first column of Table 2.1, that Dystopia had a 2022–2024 ladder score equal to 1.37 on the 0–10 scale. The final sub-bar is the sum of two components: the calculated average 2022–2024 life evaluation in Dystopia (= 1.37) and each country’s own prediction error, which measures the extent to which life evaluations are higher or lower than predicted by our equation in the first column of Table 2.1. These residuals are as likely to be negative as positive.
Consistency and change in happiness rankings
Two features carry over from previous editions of the World Happiness Report. First, there is still a lot of year-to-year consistency in the way people rate their lives in different countries. Since our rankings are based on a three-year average, there is information carried forward from one year to the next. The effects of cataclysmic events depend on when the survey took place and are muted by the three-year averaging.
Second, there remains a large gap between the top and bottom countries – more than six points (on a 0–10 scale) between Finland at the top and Afghanistan at the bottom. The top countries are more tightly grouped than the bottom ones. The top twenty have a spread of less than one point on the 0–10 scale, with the corresponding spread among the bottom twenty being three times as great. The remaining 100-odd countries cover the remaining 2.3 points of the total range. This means that relatively modest changes in a national average can lead to a large shift in rank, as illustrated by 95% confidence regions of more than 25 ranks for several countries in the middle of the global list.
Happiness scores are based on the resident populations in each country, rather than their citizenship or place of birth. In World Happiness Report 2018, we split the responses between the locally- and foreign-born populations in each country and found the happiness rankings to be essentially the same for the two groups.[6] There was some source-country effect after migration and some tendency for migrants to move to happier countries so that, among the 20 happiest countries in that report, the average happiness for the locally-born was about 0.2 points higher than the foreign-born.
Nordic countries once again lead the happiness rankings. Finland, Denmark, Iceland and Sweden are still the top four and in the same order. The confidence intervals for the rankings show Finland still in a group by itself, with Denmark and Iceland following in a group of two, and Sweden in a range that runs from 4 to 8.
If we compare this year’s top-ranking countries with those in the 2013 report – the first to assign rankings based on three-year averages – we find 14 western industrial countries in the top 20 in both years. In 2013, these countries were accompanied by four from Latin America and one from the Middle East. Reflecting the long-term convergence between Eastern and Western Europe, three of the top 20 countries in 2025 are from Central and Eastern Europe (Lithuania at 16, Slovenia at 19, and Czechia at 20). This year’s top 20 also includes two countries from Latin America (Costa Rica at 6 and Mexico at 10) and one from the Middle East (Israel at 8). In 2013, the top ten countries were all western industrial countries but now only seven are. As a group, the five Nordic countries have improved their positions in the top ten, with an average rank of 4.8 in 2013 rising to 3.4 in 2025. This increase is driven mainly by Finland (from 7 to 1) and Iceland (from 9 to 3). The industrial countries pushed out of the top ten between 2013 and 2025 include Switzerland (3 in 2013, 1 in 2015, and 13 in 2025), Canada (6 in 2013 and 18 in 2025), and Australia (10 in 2013 and 11 in 2025). This year, for the first time, none of the large industrial powers ranked in the top 20.
For the least happy countries, ranks are not so easily compared since there were 156 countries ranked in 2013 compared to 147 this year. Togo was the least happy country in 2013 and has since risen twenty places, with an average life evaluation almost 1.4 points higher now than then. Afghanistan has gone in the reverse direction with a drop of almost 2.7 points between 2013 and 2025. The average life evaluation is now 1.36, by far the lowest average score ever seen in all our reports. Furthermore, life is especially difficult for Afghan women, as their average is only 1.16 points.[7]
In the middle and lower sections of the rankings, it is more meaningful to look at average life evaluations, because a country’s rank can change many places with only a small change in average life evaluation. That is why, when we consider changes in happiness, we consider how current average life evaluations compare with those during the first years of the Gallup World Poll (2005–2010). Tables 24 to 26 in the online statistical appendix measure the change in average life evaluations from the 2005–2010 base period to the current ranking period, 2022–2024. The top five gainers are all in Central and Eastern Europe: Serbia, Bulgaria, Georgia, Latvia, and Romania. Of the 19 countries that have gained a point or more on the 0–10 scale, 12 are Central and Eastern Europe, reflecting the European happiness convergence that has been clear for more than a decade. Other big gainers include Togo and Congo in Africa; China, Mongolia, the Philippines and Viet Nam in Asia; and Nicaragua in Latin America.
There are, fortunately, fewer countries whose life evaluations have fallen by more than one point on the 0–10 scale. Going from the largest to the smallest drops in life evaluations, these seven countries are Afghanistan, Lebanon, Jordan, Malawi, Venezuela, Egypt and Botswana. These are mainly countries in or near zones of major conflict.
In general, the western industrial countries are now less happy than they were between 2005 and 2010.
In general, the western industrial countries are now less happy than they were between 2005 and 2010. Fifteen of them have had significant drops, compared to four with significant increases.[8] Three western countries had drops exceeding 0.5 on the 0–10 scale (the United States, Switzerland, and Canada) putting them among the fifteen largest losers.
Among the 136 countries included in the 2005–2010 and 2022–2024 data, there are 67 with statistically significant gains[9] and 42 with significant drops in their life evaluations.[10] Those with significant drops include western industrialised countries with previously, and even currently, high rankings.
The rankings for positive emotions are shown in Tables 66–68 of the online statistical appendix. The top ten include six from Latin America, three from Southeast Asia, and one from Africa. The lowest frequency of positive emotions is in Afghanistan. It also has the most frequent negative emotions. In the top ten for negative emotions it is joined by three Middle Eastern countries, five African countries, and Armenia (see Tables 69–71 of the online statistical appendix).
Why do happiness levels differ?
In Table 2.1, we present our latest modelling of national average life evaluations and measures of positive and negative emotions (often referred to as positive and negative affect) by country and year.[11] The results in the first column explain national average life evaluations in terms of six key variables: log GDP per capita, healthy life expectancy, having someone to count on, freedom to make life choices, generosity, and freedom from corruption.[12] Taken together, these six variables explain more than three-quarters of the variation in life evaluations across countries and years, using data from 2005 through 2024.[13]
The six variables were originally chosen as the best available measures of factors established in both experimental and survey data as having significant links to subjective wellbeing, and especially to life evaluations.[14] The explanatory power of the unchanged model has gradually increased as we have added more years to the sample, which is now almost three times as large as when the equation was first introduced in World Happiness Report 2013. We keep looking for possible improvements when and if new evidence becomes available.[15] The number of years of data is now great enough that we can experiment with including country fixed effects, as shown in Table 10 of the online statistical appendix. The results are remarkably similar.[16]
The second and third columns of Table 2.1 use the same six variables to estimate equations for national averages of positive and negative affect, where both are based on answers about yesterday’s emotional experiences (Box 2.2 explains how these measures are constructed). In general, emotional measures, especially negative ones, are differently and much less fully explained by the six variables than are life evaluations. GDP per capita and healthy life expectancy have significant effects on life evaluations,[17] but not, in these national average data, on positive emotions.[18] However, the social variables do have significant effects on both positive and negative emotions. Bearing in mind that positive and negative emotions are measured on a 0–1 scale, while life evaluations are on a 0–10 scale, having someone to count on can be seen to have similar proportionate effects on positive and negative emotions as it does on life evaluations. Freedom and generosity have even larger associations with positive emotions than with the Cantril Ladder. Negative emotions are significantly reduced by social support, a sense of freedom, and the absence of corruption.
In the fourth column, we re-estimate the life evaluation equation from column 1, adding both positive and negative emotions to partially implement the Aristotelian presumption that sustained positive emotions are important supports for a good life.[19] The results continue to buttress a finding in psychology that the existence of positive emotions matters more than the absence of negative ones when predicting either longevity[20] or resistance to the common cold.[21] Consistent with this evidence, we find that positive affect has a large and highly significant impact in the final equation of Table 2.1, while negative affect has none.
As for the coefficients on the other variables in the fourth column, the changes are substantial only on those variables – especially freedom and generosity – that have the largest impacts on positive affect. Thus, we can infer that positive emotions play a strong role in supporting life evaluations and that much of the impact of freedom and generosity on life evaluations is channelled through their influence on positive emotions. That is, freedom and generosity have large impacts on positive affect, which in turn has a major impact on life evaluations.
| Dependent Variable | ||||
|---|---|---|---|---|
| Independent Variable | Cantril Ladder | Positive Affect | Negative Affect | Cantril Ladder |
| Log GDP per capita | 0.328 | -.017 | -.0008 | 0.366 |
| (0.062)*** | (0.01)* | (0.007) | (0.061)*** | |
| Social support | 2.686 | 0.325 | -.343 | 2.021 |
| (0.336)*** | (0.055)*** | (0.043)*** | (0.348)*** | |
| Healthy life expectancy at birth | 0.032 | -.0007 | 0.003 | 0.033 |
| (0.01)*** | (0.001) | (0.001)*** | (0.01)*** | |
| Freedom to make life choices | 1.518 | 0.381 | -.089 | 0.694 |
| (0.295)*** | (0.045)*** | (0.039)** | (0.276)** | |
| Generosity | 0.382 | 0.081 | 0.026 | 0.198 |
| (0.243) | (0.032)** | (0.027) | (0.232) | |
| Perceptions of corruption | -.669 | -.016 | 0.095 | -.645 |
| (0.249)*** | (0.027) | (0.021)*** | (0.235)*** | |
| Positive affect | 2.212 | |||
| (0.326)*** | ||||
| Negative affect | 0.147 | |||
| (0.379) | ||||
| Year fixed effects | Included | Included | Included | Included |
| Number of countries | 155 | 155 | 155 | 155 |
| Number of obs. | 2234 | 2229 | 2233 | 2228 |
| Adjusted R-squared | 0.761 | 0.437 | 0.35 | 0.785 |
Note: This is a pooled OLS regression for a tattered panel explaining annual national average Cantril Ladder responses from all available surveys from 2005 through 2024. See Box 2.2 for detailed information about each of the predictors. Coefficients are reported with robust standard errors clustered by country (in parentheses). ***, **, and * indicate significance at the 1, 5, and 10 percent levels respectively.
Box 2.2: Explaining the variables in Table 2.1
GDP per capita is in terms of Purchasing Power Parity (PPP) adjusted to constant 2021 international dollars, taken from the World Development Indicators (WDI) by the World Bank (version 34, last updated on 28 October 2024). See the online statistical appendix for more details. GDP data for 2024 are not yet available, so we extend the GDP time series from 2023 to 2024 using country-specific forecasts of real GDP growth from the OECD Economic Outlook No. 116 (Edition 2024/2) or, if missing, from the World Bank’s Global Economic Prospects (last updated: 11 June 2024), after adjustment for population growth. The equation uses the natural log of GDP per capita as this form fits the data significantly better than GDP per capita.
The time series for healthy life expectancy at birth are constructed based on data from the World Health Organization (WHO) Global Health Observatory data repository, with data available up to 2021 (last updated: 2 August 2024). To match this report’s sample period (2005–2024), interpolation (when necessary) and extrapolation are used. See the online statistical appendix for more details.
Social support is the national average of the binary responses (0=no, 1=yes) to the Gallup World Poll (GWP) question “If you were in trouble, do you have relatives or friends you can count on to help you whenever you need them, or not?”
Freedom to make life choices is the national average of binary responses to the GWP question “Are you satisfied or dissatisfied with your freedom to choose what you do with your life?”
Generosity is the residual from regressing the national average of GWP responses to the donation question “Have you donated money to a charity in the past month?” on log GDP per capita.
Perceptions of corruption is the average of binary answers to two GWP questions: “Is corruption widespread throughout the government or not?” and “Is corruption widespread within businesses or not?” Where data for government corruption are missing, the perception of business corruption is used as the overall corruption-perception measure.
Positive affect is defined as the average of previous-day affect measures for laughter, enjoyment, and doing interesting things. The inclusion of doing interesting things (first added for World Happiness Report 2022) gives us three components in each of positive and negative affect, and slightly improves the equation fit in column 4. The general form for the affect questions is: “Did you experience the following feelings during a lot of the day yesterday?” See the online statistical appendix for more details.
Negative affect is defined as the average of previous-day affect measures for worry, sadness, and anger.
The variables we use in our Table 2.1 modelling may be taking credit properly due to other variables or unmeasured factors. There are also likely to be vicious or virtuous circles, with two-way linkages among the variables. For example, there is much evidence that those who have happier lives are likely to live longer,[22] be more trusting and cooperative, and generally better able to meet life’s demands.[23] This will double back to improve health, income, generosity, corruption, and a sense of freedom. Collectively, these possibilities suggest that we should interpret the observed relationships with some caution.
Another possible reason for a cautious interpretation of our results is that some of the data come from the same respondents as the life evaluations and are thus possibly determined by common factors. This is less likely when comparing national averages because individual differences in personality and individual life circumstances tend to average out at the national level. To provide even more assurance that our results are not significantly biased because we are using the same respondents to report life evaluations, social support, freedom, generosity, and corruption, we tested the robustness of our procedure by splitting each country’s respondents randomly into two groups.[24] We then examined whether the average values of social support, freedom, generosity, and the absence of corruption from one half of the sample explained average life evaluations in the other half of the sample. The coefficients on each of the four variables fell slightly, just as we expected.[25] But the changes were reassuringly small (ranging from 1% to 5%) and were not statistically significant.[26]
Overall, the model explains average life evaluation levels quite well within regions, among regions, and for the world as a whole.[27] On average, the countries of Latin America still have mean life evaluations that are significantly higher than predicted by the model (by about 0.5 on the 0–10 scale). This difference has been attributed to a variety of factors including some unique features of family and social life in Latin American countries.[28] In partial contrast, countries in East Asia have average life evaluations below predictions, although only slightly and insignificantly so in our latest results.[29] This may reflect, at least in part, cultural differences in the way people think about and report on the quality of their lives.[30] It is reassuring that our findings about the relative importance of the six factors are generally unaffected by whether or not we make explicit allowance for these regional differences.[31]
The relative frequency of the other benevolent acts depends on local social and religious norms, as well as the role of private benevolence as a substitute or supplement for institutional social safety nets.
Benevolence ranking
In Table 2.2, we report country rankings for six measures of benevolence. The first three are national average frequencies of people who report engaging once or more in three benevolent acts during the past month – donating, volunteering, and helping a stranger. The donation answers are used, after adjusting for differences in national income, in our Table 2.1 equation in the previous section.[32]
The remaining three indicators are quite different from the first three. Instead of reporting the respondent’s own benevolent acts, they capture respondents’ forecasts of how others would behave when facing an opportunity to show benevolence. Specifically, the so-called “wallet questions” ask respondents to say how likely it is that their lost wallet or other valuable object would be returned if found by: (a) a neighbour, (b) a stranger, or (c) a police officer.[33]
| Country | Rankings by: | ||||||
|---|---|---|---|---|---|---|---|
| Cantril Ladder | Donated | Volunteered | Helped a stranger | Wallet returned by: | |||
| Neighbour | Stranger | Police | |||||
| Finland | 1 | 39 | 75 | 96 | 3 | 5 | 2 |
| Denmark | 2 | 25 | 64 | 76 | 8 | 6 | 18 |
| Iceland | 3 | 5 | 77 | 125 | |||
| Sweden | 4 | 15 | 87 | 90 | 4 | 32 | 11 |
| Netherlands | 5 | 9 | 42 | 134 | 1 | 4 | 6 |
| Costa Rica | 6 | 92 | 84 | 36 | 98 | 128 | 104 |
| Norway | 7 | 11 | 43 | 101 | 2 | 1 | 1 |
| Israel | 8 | 32 | 61 | 84 | 42 | 69 | 55 |
| Luxembourg | 9 | 31 | 41 | 135 | 24 | 43 | 8 |
| Mexico | 10 | 102 | 89 | 61 | 126 | 120 | 136 |
| Australia | 11 | 20 | 34 | 39 | 7 | 14 | 12 |
| New Zealand | 12 | 22 | 22 | 65 | 10 | 8 | 5 |
| Switzerland | 13 | 21 | 56 | 137 | 11 | 19 | 7 |
| Belgium | 14 | 35 | 68 | 118 | 33 | 64 | 35 |
| Ireland | 15 | 7 | 36 | 88 | 9 | 21 | 16 |
| Lithuania | 16 | 110 | 125 | 131 | 134 | 132 | 56 |
| Austria | 17 | 10 | 59 | 111 | 5 | 7 | 4 |
| Canada | 18 | 17 | 25 | 47 | 12 | 18 | 14 |
| Slovenia | 19 | 37 | 47 | 127 | 15 | 31 | 24 |
| Czechia | 20 | 38 | 73 | 66 | |||
| United Arab Emirates | 21 | 16 | 19 | 67 | 51 | 12 | 13 |
| Germany | 22 | 26 | 67 | 82 | 6 | 15 | 3 |
| United Kingdom | 23 | 4 | 54 | 108 | 14 | 27 | 15 |
| United States | 24 | 12 | 15 | 12 | 17 | 52 | 25 |
| Belize | 25 | 100 | 37 | 23 | |||
| Poland | 26 | 125 | 143 | 146 | 75 | 90 | 43 |
| Taiwan Province of China | 27 | 42 | 112 | 86 | 43 | 22 | 27 |
| Uruguay | 28 | 75 | 95 | 34 | 60 | 74 | 91 |
| Kosovo | 29 | 23 | 139 | 63 | 72 | 45 | 46 |
| Kuwait | 30 | 33 | 46 | 27 | 19 | 11 | |
| Serbia | 31 | 41 | 145 | 140 | 74 | 54 | 53 |
| Saudi Arabia | 32 | 48 | 92 | 41 | 16 | 25 | 20 |
| France | 33 | 52 | 38 | 143 | 21 | 62 | 22 |
| Singapore | 34 | 14 | 32 | 35 | 25 | 56 | 9 |
| Romania | 35 | 119 | 140 | 110 | 86 | 87 | 49 |
| Brazil | 36 | 78 | 85 | 58 | 59 | 75 | 84 |
| El Salvador | 37 | 128 | 70 | 85 | 113 | 129 | 117 |
| Spain | 38 | 44 | 97 | 83 | 13 | 41 | 10 |
| Estonia | 39 | 36 | 82 | 102 | 31 | 65 | 31 |
| Italy | 40 | 65 | 106 | 121 | 64 | 100 | 32 |
| Panama | 41 | 104 | 62 | 75 | 125 | 115 | 106 |
| Argentina | 42 | 105 | 94 | 52 | 88 | 72 | 128 |
| Kazakhstan | 43 | 51 | 122 | 138 | 30 | 42 | 65 |
| Guatemala | 44 | 98 | 20 | 71 | 118 | 119 | 127 |
| Chile | 45 | 68 | 105 | 40 | 85 | 99 | 118 |
| Viet Nam | 46 | 136 | 124 | 122 | 78 | 101 | 52 |
| Nicaragua | 47 | 89 | 50 | 69 | 136 | 136 | 130 |
| Malta | 48 | 6 | 55 | 105 | 54 | 70 | 48 |
| Thailand | 49 | 8 | 81 | 87 | 121 | 138 | 83 |
| Slovakia | 50 | 88 | 103 | 136 | 57 | 91 | 57 |
| Latvia | 51 | 54 | 126 | 117 | 50 | 88 | 61 |
| Oman | 52 | 34 | 83 | 20 | |||
| Uzbekistan | 53 | 29 | 107 | 100 | 18 | 49 | 19 |
| Paraguay | 54 | 76 | 30 | 48 | 120 | 106 | 131 |
| Japan | 55 | 131 | 104 | 147 | 36 | 26 | 34 |
| Bosnia and Herzegovina | 56 | 28 | 128 | 113 | 53 | 48 | 58 |
| Philippines | 57 | 106 | 6 | 51 | 95 | 20 | 64 |
| Republic of Korea | 58 | 53 | 93 | 109 | 58 | 17 | 23 |
| Bahrain | 59 | 27 | 63 | 31 | 23 | 9 | 17 |
| Portugal | 60 | 101 | 120 | 116 | 47 | 84 | 40 |
| Colombia | 61 | 130 | 100 | 80 | 119 | 113 | 121 |
| Ecuador | 62 | 118 | 90 | 92 | 133 | 134 | 122 |
| Honduras | 63 | 70 | 31 | 43 | 107 | 116 | 125 |
| Malaysia | 64 | 19 | 28 | 81 | 80 | 122 | 66 |
| Peru | 65 | 124 | 88 | 79 | 132 | 121 | 124 |
| Russian Federation | 66 | 60 | 91 | 64 | 34 | 37 | 86 |
| Cyprus | 67 | 56 | 76 | 70 | 26 | 39 | 33 |
| China | 68 | 85 | 74 | 123 | 49 | 61 | 21 |
| Hungary | 69 | 58 | 119 | 21 | 32 | 112 | 28 |
| Trinidad and Tobago | 70 | 50 | 40 | 3 | |||
| Montenegro | 71 | 84 | 136 | 142 | 66 | 47 | 68 |
| Croatia | 72 | 126 | 134 | 144 | 81 | 85 | 45 |
| Jamaica | 73 | 108 | 9 | 1 | 77 | 81 | 103 |
| Bolivia | 74 | 117 | 66 | 72 | 137 | 126 | 133 |
| Kyrgyzstan | 75 | 40 | 78 | 55 | 40 | 92 | 98 |
| Dominican Republic | 76 | 96 | 21 | 25 | 108 | 127 | 134 |
| Mongolia | 77 | 30 | 18 | 132 | 99 | 102 | 60 |
| Mauritius | 78 | 69 | 29 | 119 | 89 | 68 | 85 |
| Libya | 79 | 73 | 80 | 30 | 20 | 10 | 72 |
| Republic of Moldova | 80 | 116 | 127 | 73 | 91 | 94 | 88 |
| Greece | 81 | 138 | 114 | 104 | 90 | 108 | 38 |
| Venezuela | 82 | 111 | 23 | 8 | 111 | 131 | 137 |
| Indonesia | 83 | 1 | 1 | 59 | 73 | 117 | 54 |
| Algeria | 84 | 114 | 121 | 99 | 56 | 3 | 62 |
| Bulgaria | 85 | 94 | 146 | 129 | 63 | 66 | 47 |
| North Macedonia | 86 | 46 | 138 | 130 | 122 | 98 | 120 |
| Armenia | 87 | 134 | 131 | 89 | 70 | 29 | 80 |
| Hong Kong SAR of China | 88 | 43 | 102 | 114 | 76 | 79 | 94 |
| Albania | 89 | 72 | 135 | 103 | 128 | 124 | 114 |
| Tajikistan | 90 | 122 | 4 | 60 | 48 | 96 | 41 |
| Georgia | 91 | 146 | 86 | 37 | 45 | 60 | 51 |
| Nepal | 92 | 59 | 26 | 120 | 112 | 107 | 92 |
| Lao PDR | 93 | 55 | 108 | 141 | 135 | 137 | 100 |
| Türkiye | 94 | 112 | 132 | 115 | 55 | 77 | 29 |
| South Africa | 95 | 113 | 60 | 54 | 96 | 105 | 95 |
| Mozambique | 96 | 103 | 24 | 93 | 79 | 55 | 82 |
| Gabon | 97 | 127 | 115 | 22 | 131 | 118 | 119 |
| Côte d'Ivoire | 98 | 95 | 96 | 50 | 93 | 59 | 59 |
| Iran | 99 | 18 | 117 | 29 | 28 | 2 | 30 |
| Congo | 100 | 115 | 58 | 24 | 117 | 58 | 116 |
| Iraq | 101 | 77 | 110 | 17 | 29 | 30 | 81 |
| Guinea | 102 | 61 | 12 | 16 | 67 | 73 | 115 |
| Namibia | 103 | 133 | 57 | 53 | 97 | 78 | 77 |
| Cameroon | 104 | 99 | 65 | 33 | 103 | 83 | 97 |
| Nigeria | 105 | 45 | 5 | 7 | 71 | 33 | 126 |
| Azerbaijan | 106 | 90 | 123 | 62 | 37 | 28 | 67 |
| Senegal | 107 | 79 | 35 | 6 | 27 | 35 | 26 |
| State of Palestine | 108 | 137 | 130 | 95 | 44 | 16 | 50 |
| Pakistan | 109 | 71 | 109 | 133 | 83 | 36 | |
| Niger | 110 | 109 | 69 | 13 | 35 | 51 | 79 |
| Ukraine | 111 | 3 | 45 | 9 | 62 | 40 | 109 |
| Morocco | 112 | 144 | 129 | 32 | 69 | 95 | 78 |
| Tunisia | 113 | 139 | 118 | 77 | 82 | 76 | 99 |
| Mauritania | 114 | 86 | 44 | 42 | 61 | 67 | 87 |
| Kenya | 115 | 24 | 3 | 4 | 84 | 93 | 96 |
| Uganda | 116 | 74 | 39 | 19 | 101 | 111 | 89 |
| Gambia | 117 | 13 | 16 | 14 | 46 | 50 | 63 |
| India | 118 | 57 | 10 | 74 | 115 | 86 | 93 |
| Chad | 119 | 66 | 17 | 28 | 102 | 109 | 129 |
| Burkina Faso | 120 | 81 | 49 | 56 | 87 | 71 | 36 |
| Benin | 121 | 121 | 99 | 124 | 124 | 89 | 73 |
| Somalia | 122 | 47 | 71 | 49 | |||
| Mali | 123 | 132 | 53 | 98 | 94 | 24 | 110 |
| Cambodia | 124 | 64 | 144 | 145 | 138 | 139 | 107 |
| Ghana | 125 | 63 | 14 | 44 | 65 | 34 | 75 |
| Myanmar | 126 | 2 | 48 | 106 | 105 | 125 | 102 |
| Togo | 127 | 123 | 79 | 107 | 114 | 82 | 69 |
| Jordan | 128 | 135 | 142 | 57 | 41 | 46 | 37 |
| Liberia | 129 | 91 | 2 | 2 | 104 | 53 | 111 |
| Madagascar | 130 | 97 | 8 | 94 | 139 | 135 | 123 |
| Zambia | 131 | 83 | 52 | 10 | 109 | 103 | 101 |
| Ethiopia | 132 | 49 | 51 | 91 | 110 | 130 | 108 |
| Sri Lanka | 133 | 62 | 7 | 45 | 68 | 13 | 44 |
| Bangladesh | 134 | 80 | 111 | 11 | 123 | 97 | 105 |
| Egypt | 135 | 143 | 147 | 38 | 38 | 44 | 76 |
| Tanzania | 136 | 67 | 116 | 112 | 116 | 63 | 74 |
| Eswatini | 137 | 129 | 72 | 26 | 129 | 123 | 71 |
| Lesotho | 138 | 145 | 101 | 68 | 52 | 57 | 39 |
| Comoros | 139 | 93 | 11 | 78 | |||
| Yemen | 140 | 147 | 141 | 128 | 22 | 23 | 112 |
| DR Congo | 141 | 87 | 27 | 46 | |||
| Botswana | 142 | 141 | 113 | 15 | 92 | 104 | 42 |
| Zimbabwe | 143 | 140 | 98 | 97 | 106 | 110 | 113 |
| Malawi | 144 | 120 | 33 | 18 | 100 | 38 | 90 |
| Lebanon | 145 | 107 | 137 | 139 | 39 | 80 | 70 |
| Sierra Leone | 146 | 82 | 13 | 5 | 127 | 114 | 132 |
| Afghanistan | 147 | 142 | 133 | 126 | 130 | 133 | 135 |
The rankings differ among the benevolent acts, and especially between benevolent acts and expected rates of wallet return. The Nordic countries are at the top in the rankings for expected return of wallets, as shown in Table 2.2, and are also much higher than other countries for actual wallet return, an important benevolent act. The relative frequency of the other benevolent acts depends on local social and religious norms, as well as the role of private benevolence as a substitute or supplement for institutional social safety nets. Among countries with incomplete social safety nets, more people fall between the cracks, thereby increasing the need for private benevolence to fill the gap.
Consider, for example, the case of Finland, which has universally available and high-quality health, education, and social support systems. Inequality of wellbeing is low in Finland and our data suggest a correspondingly lower need for private charity. A preference for universal over targeted social assistance may also help to explain their relatively low rankings for the three benevolent acts other than the return of lost wallet return. In the Finnish case, the contrast between the two sets of rankings is especially marked between the frequency of helping strangers and that of actual and expected return of lost wallets. All international wallet-dropping experiments have shown Finland and the other Nordic countries to be among the best places to lose your wallet. Given that the return of a lost wallet is a very powerful way of helping strangers, the low ranking for helping strangers may reflect fewer strangers around who need help. A lost wallet exposes an immediate need, and that call is indeed answered readily in the Nordic countries.[34]
There are a few countries where the ranking for helping strangers is very high, while the ranking for donating to charity is very low. Jamaica, Liberia, and Sierra Leone are in the top ranks for helping strangers but have donation rankings that are 80 or more places lower. Nigeria and Kenya, also in the top ten for helping strangers, provide a less extreme contrast, but still rank much higher for helping strangers than for donating. All five countries are near the bottom of the ranking for expected wallet return by police. People generally want to help others and are likely to choose the best means available.[35] Where institutional structures are weak, helping strangers in need probably represents a far more effective channel than donations to charities. In these countries, charities are fewer and less likely to have the credible and efficient structures that characterise effective benevolence, as illustrated in our review of published research below.
Comparing actual and expected benevolence
The wallet questions are of special interest as they are open to experimental testing in two ways. First, they can be used to see whether international differences in expected wallet return (by a stranger) match international differences in the actual return of lost wallets. They do. The first recorded international wallet drop experiment was by Reader’s Digest and they repeated it recently in one city in each of 16 countries.[36] Expected wallet return predicts actual return better in 1996 (r=0.71), than in 2018 (r=0.19), with some different cities involved. A much larger experiment covering 40 countries, with over 17,000 wallets handed in at societal institutions rather than randomly dropped,[37] also shows a high correlation (r=0.62) with expected wallet returns by strangers. These results show that cross-country differences in the expected benevolence of others have the power to predict actual benevolent behaviours by others.
The second valuable use of the wallet questions is to see whether people are too optimistic or too pessimistic about the benevolence of others. This was first done by comparing experimentally dropped wallets in Toronto with large samples of answers from Toronto respondents to the Canadian General Social Survey. The expected rate of return was 23% and the actual return was over 80%.[38] In the same vein, the 40-country study showed actual return to be much higher than expected (1.8 times). Finally, two-thirds of 200 wallets dropped in 20 North American cities were returned, far higher than the author expected,[39] and double that expected by US respondents to the wallet stranger question in our 2019 data.[40] Collectively, these data on expected and actual wallet return show that people are far too pessimistic about the benevolence of others.[41] We show later that expected benevolence is a substantial predictor of life satisfaction, meaning that people may be made needlessly unhappy by their unwarranted pessimism.
These data on expected and actual wallet return show that people are far too pessimistic about the benevolence of others.
The discussion above relates to wallets found by strangers since that is the answer most open to testing by experiments. How might we expect the three different wallet measures to relate to one another and to other measures? The expected return by a neighbour is an indicator of the local social context. Thus, individual answers to “having someone to count on” are more highly correlated with the neighbour wallet answers than with the other wallet answers. On the other hand, the police answers are positively related to variables reflecting how highly people rate their public institutions, especially the honesty and efficiency of the judicial system. The answers for return by strangers are positively correlated with the other wallet answers, and, as noted above, to the actual return of dropped wallets. Across nations, actual wallet returns were found to be highly correlated (r=0.65) with survey measures of social trust.[42]
The police answers are most closely related to how people rate the quality of their public institutions. These institutions are often national in scope and differ greatly among countries. Thus, it might be expected that international differences in police answers would explain a larger share of the variations among individuals. This is indeed the case, as the international share of the variance of the police answers is much higher than for the other two.[43]
Benevolence trends
In this section, we consider benevolence across the globe and over time. We offer a brief summary of the relevant research before presenting new data.
A review of previous research
Recent evidence shows that empathy – imagining others’ perspectives and feeling compassion for others – has fluctuated over time. For instance, these two empathy types declined in American young adults from 1979–2009.[44] Yet, after the global financial crisis, empathy increased in both American and Chinese youth, and benevolent values increased in European youth.[45]
Other research has assessed actual helping behaviours (e.g., picking up dropped papers) in 24 US cities over time. Mirroring the empathy decline discussed above, between 1994 (53%) and 2005 (49%), Americans were less likely to help strangers over time.[46] Larger, denser, and lower-income cities had lower rates of helping behaviours. Yet, this trend was not observed consistently everywhere. A behavioural study found a 10 percent decline in helping behaviour (mailing lost letters) between 2001 and 2011 in the United States, but not in Canada.[47] Yet, long-term behavioural studies have found increased cooperation among Americans between 1956 to 2017.[48]
As for self-reported benevolent behaviours, there were increases in helping strangers between 2010/2011 and 2016/2017 globally, but not giving time or money to charities.[49] Yet, after this, World Happiness Report 2024 found increases in helping strangers, volunteering, and donating, from 2017–2019 (pre-COVID) to 2020–2023 (during COVID).[50] Here, we go beyond previous research by examining a longer time frame.
There have been few studies examining cross-cultural differences in benevolent traits and acts, with sometimes differing results.[51] For example, one study examined cross-cultural variations in empathy across 63 countries, finding higher empathy scores in more collectivistic countries.[52] However, researchers examining self-reported benevolent behaviours in 66 countries found higher rates of charitable giving in more individualistic countries.[53]
The 40-country wallet-dropping study discussed above found that wallets were returned 40% of the time when they had no money, and over half (51%) the time when they contained money.[54] That return rates were higher for the wallets including money provides a likely example of the ‘clear positive impact’ effect we describe below. Returns were more likely in countries with more universalist values (which are related to individualism). These results are supported by another study with 21 countries, which found that people were less likely to help strangers in cultures with more collectivist values.[55]
Taken together, empathy is higher in collectivist contexts, but helping strangers (both self-reported and actual) appears to be lower in these contexts. This apparent discrepancy may, at least in part, stem from who respondents have in mind as a target when answering questions about empathy as well as how people compare themselves to their peers.[56] In particular, it is possible that empathy measures capture feelings toward people you know well, which is very different from more impersonal forms of helping (like helping strangers and returning lost wallets). Indeed, new research suggests that providing assistance to family and strangers predicts wellbeing through feelings of autonomy while supporting friends increases feelings of closeness.[57]
How is global benevolence changing?
In Figure 2.2, we show the global trends in three types of benevolent acts: donating, volunteering, and helping strangers. We also include a variable called ‘prosocial’, which is equal to 1 for any respondent who has done any of the three benevolent acts during the past month. We have noted the post-COVID increases in benevolent acts in each of our past three reports, being struck by the longevity of the increases appearing first in 2020. In the 2024 data, we see a significant decline in the frequency of benevolent acts since 2023.[58] However, the size and persistence of the post-COVID increases in benevolent acts are such that even in 2024, four years after the onset of COVID, all three benevolent acts were still more than 10% above their pre-pandemic levels in 2017–2019.[59]
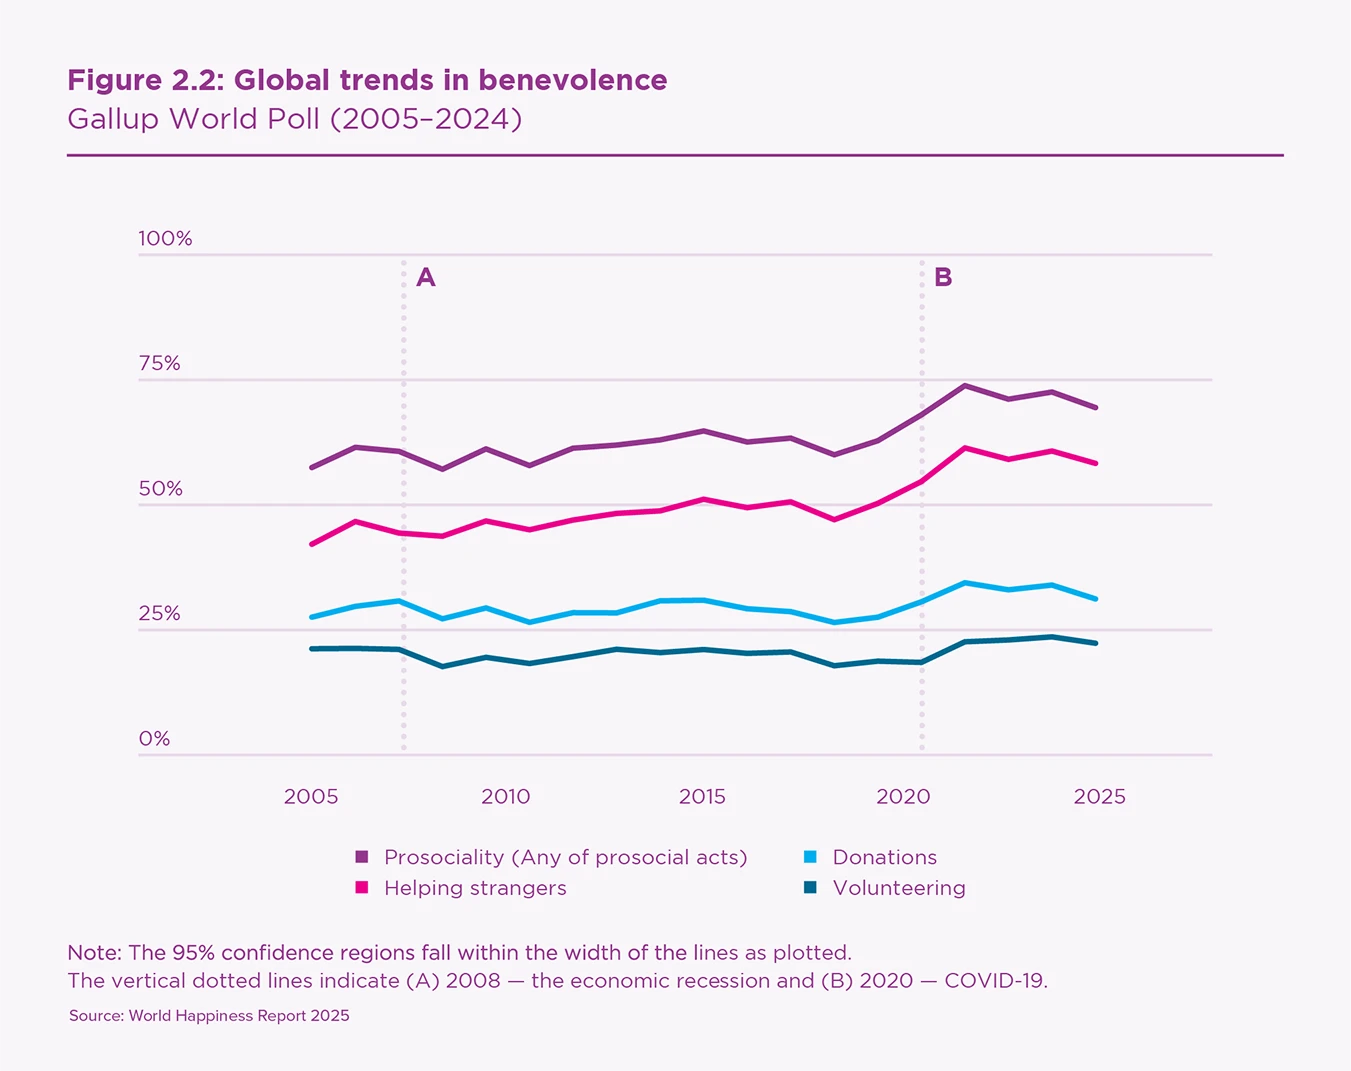
Figure 2.3 illustrates benevolence trends for 10 global regions. In almost all regions, helping strangers is the most common benevolent act, while volunteering is generally the least common.
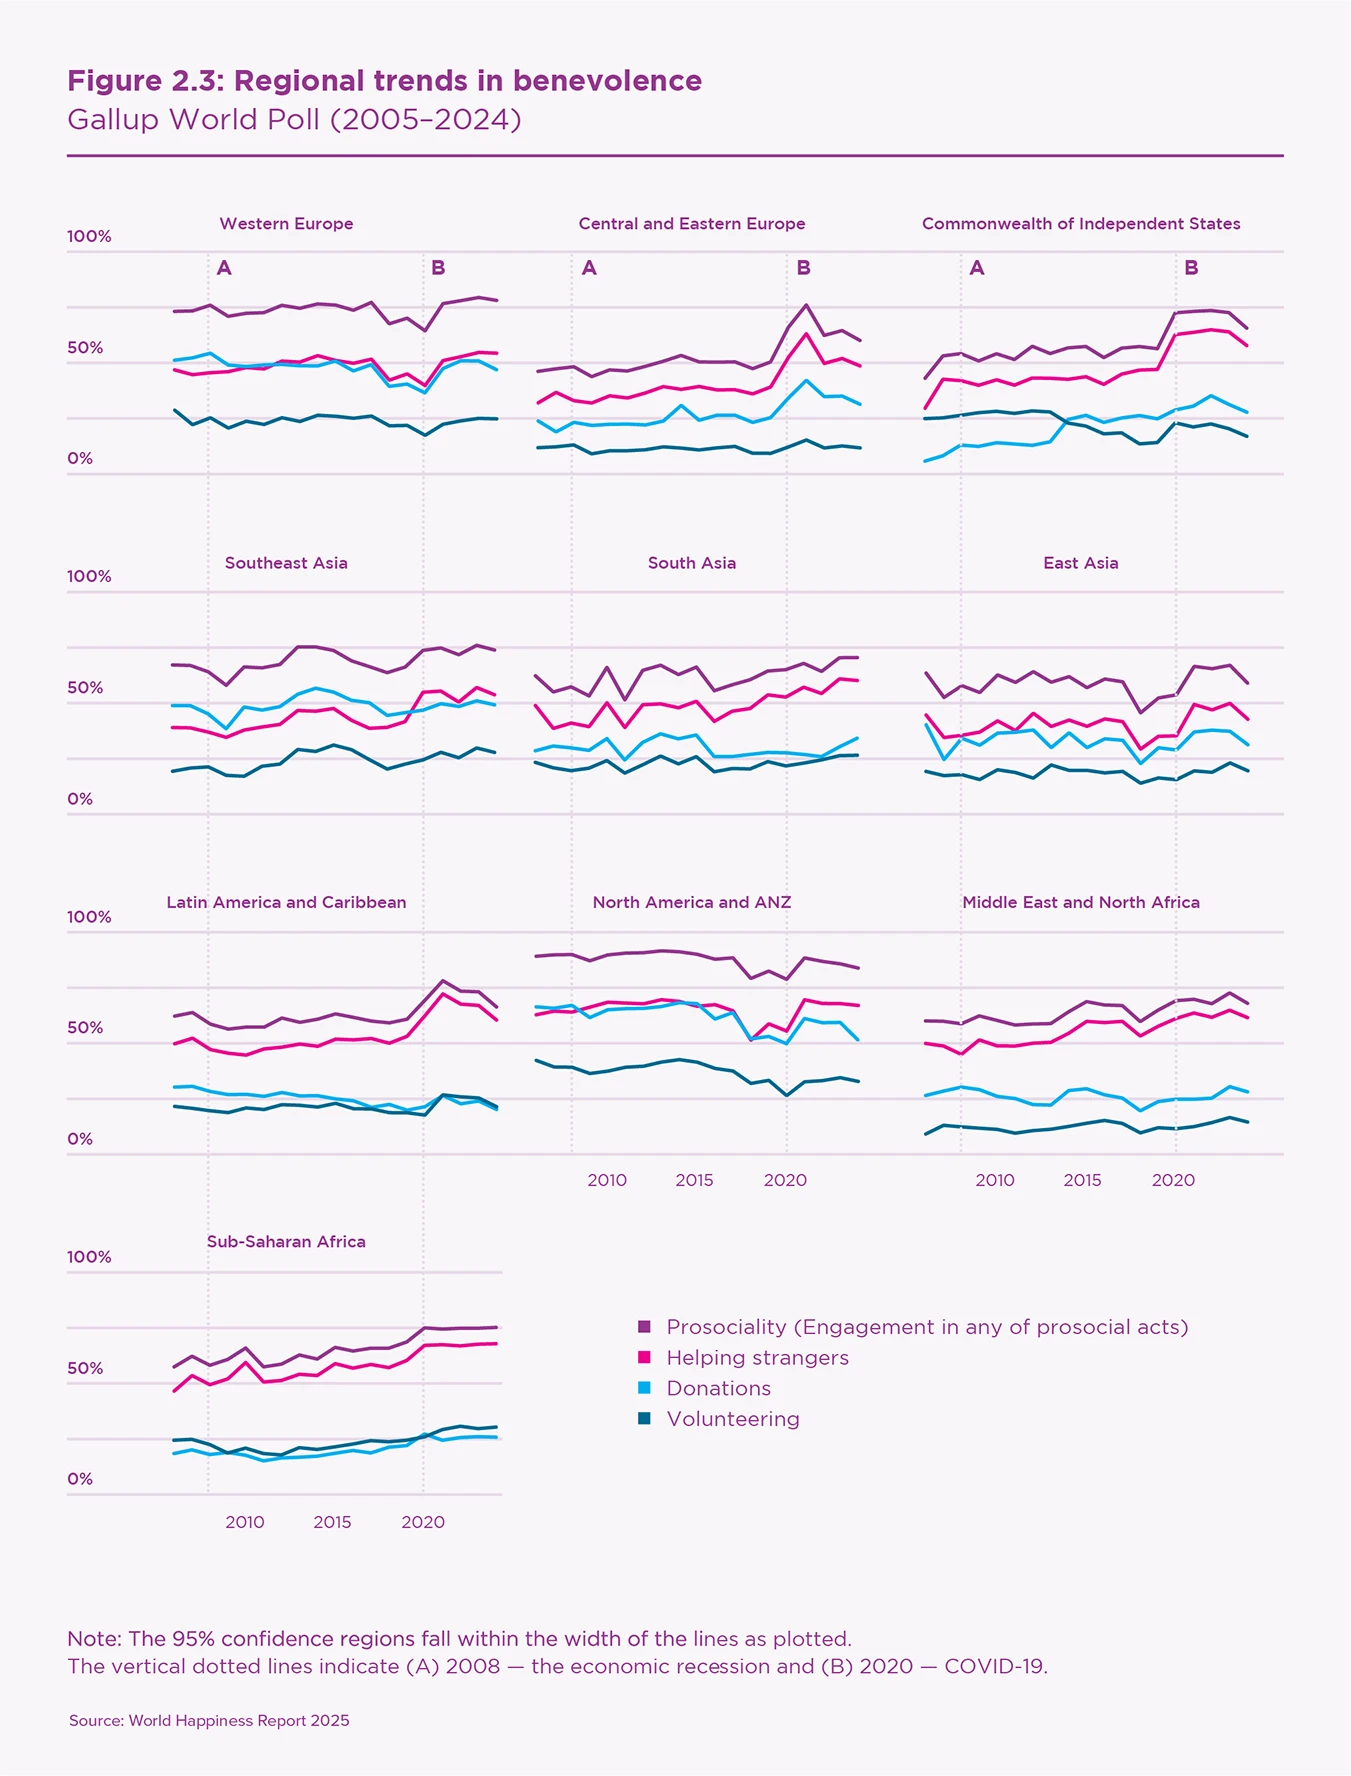
There are notable regional differences in the modes of benevolence. For instance, donations have been among the most common benevolent acts in three regions: Southeast Asia; Western Europe; and North America, Australia, and New Zealand (NANZ) – although in recent years, helping strangers has become the most prevalent. In contrast, donations are the least common form of benevolence in Sub-Saharan Africa and Latin America and the Caribbean, where helping strangers is the primary benevolent action. Volunteering was more commonly practised in the Commonwealth of Independent States until 2014, at which point donations became more frequent.
Regional differences may represent cultural variations that shape norms for caring for others.[60] In regions such as Central and Eastern Europe, Latin America and Caribbean, and Middle East and North Africa, an informal benevolent act, such as helping strangers, appears to be more common than other formal acts of benevolence such as donating and volunteering. On the contrary, regions including Southeast Asia, Western Europe, and NANZ tend to engage more in formal helping behaviours, particularly through sharing material resources. This may also be influenced by institutions and policies in each country that encourage donations by monetary rewards, such as tax credits.[61]
We also noticed regional differences in benevolence trajectories. The post-COVID increase in benevolent acts was more prominent in regions such as NANZ and Western Europe, and less pronounced in regions like Sub-Saharan Africa, the Middle East and North Africa, and Southeast Asia. Meanwhile, some regions, such as Central and Eastern Europe and Latin America and the Caribbean, showed an immediate surge in benevolence after COVID-19, but this increase declined soon after. We observe an overall decline in benevolence between 2023 and 2024 across most regions, except for Southeast Asia, South Asia, and Sub-Saharan Africa, where levels remained stable. Nevertheless, the post-COVID increase in benevolent acts (relative to the 2017–2019 average) remains almost universally intact. NANZ is the only region where the prosocial variable was not significantly higher[62] in 2024 than in the pre-COVID years (2017–2019), but even in that region, the helping of strangers is still significantly higher than before the pandemic.
Even in 2024, four years after the onset of COVID, all three benevolent acts were still more than 10% above their pre-pandemic levels in 2017–2019.
Benevolence and happiness
In this section, we review the burgeoning research literature suggesting that the wellbeing benefits of benevolent acts depend fundamentally on their motivations, the ways in which they are designed and delivered, and the extent of cooperation and collaboration among givers and receivers. In short, we find that benevolent actions deliver greater wellbeing benefits when they involve three Cs: caring connections, choice, and a clear positive impact.[63]
Caring connections
Much research supports this chapter’s finding that generous behaviours are associated with — and often directly cause — increased wellbeing among givers across the world.[64] Even children as young as two years old feel pleasure from giving to others.[65] Previous research examines various types of benevolent acts or ways in which people may help one another that include and go beyond the Gallup World Poll questions examined in this chapter. These range from the more formal or institutional giving in nonprofit organisations (e.g., donating money, volunteering time) and workplaces (e.g., helping coworkers) to more informal everyday forms of giving like helping friends, neighbours, family, and strangers.
Yet, there is evidence to suggest that the wellbeing benefits of benevolent acts are often stronger for both helpers and beneficiaries in caring communities. Thus, benevolent actions may deliver greater wellbeing benefits to the extent to which they involve more social connectedness and caring motivations.
There is some accuracy to the saying, “charity begins at home”. Most often, people care for and share their resources with others they regularly see, whether family,[66] friends, coworkers, or acquaintances. Giving behaviours often occur within social contexts and simply witnessing someone else giving has positive effects on wellbeing.[67] Such behaviours can also spread through people’s social networks,[68] thus creating and reinforcing caring communities.
When social or relational aspects of giving are stronger, this can amplify wellbeing among givers. Several social and relational factors demonstrate this. For example, having direct social engagement can amplify givers’ wellbeing. When volunteers engage directly with others, they experience higher wellbeing compared to when they have more indirect roles.[69] In addition, being closer to the recipient can also amplify wellbeing effects. For example, research finds that spending money on stronger social ties increases happiness more than spending on weaker social ties.[70] When directly compared, giving to loved ones increases reward centre activation in the brain more than donating to charity.[71]
Recipients also benefit more from closeness. Although receiving gifts can sometimes lead to feelings of indebtedness, receiving gifts can also lead to happiness, especially when gifts come from stronger (as opposed to weaker) social ties.[72] Even when not directly interacting with people, loved ones can inspire us to give and help. For example, simply being socially motivated to give can amplify benefits to givers, as demonstrated by research finding that those who volunteer for social reasons – because it’s important to their loved ones – have higher self-esteem, wellbeing, self-efficacy, and connectedness,[73] and a lower risk of mortality among older adults.[74]
In caring communities, the lines between “giver” and “recipient” blur as everyone regularly occupies both roles through interactions over time.[75] Research on adolescents[76] and older adults[77] has found that social support interactions that are more balanced – with similar levels of giving and receiving – are associated with higher wellbeing, fewer depressive symptoms, and even a lower risk of dying. However, other research suggests that low levels of both giving and receiving, even if balanced, are associated with lower wellbeing.[78] Thus, increased wellbeing is more likely when people are embedded in mutual and frequent caring interactions.
Although giving within caring communities can support increased meaning and joy, people often give beyond their own immediate groups, to strangers both near and far, and, as reviewed below, this still feels good. We review key psychological pathways that can extend one’s circle of compassion more broadly beyond the people we know and love, creating a sense of caring community across our cities, countries, and even globally, to people we might not ever directly interact with.
One such pathway is caring personality traits, like compassion or altruism. People with caring personality traits tend to prioritise others’ needs and wellbeing, and they are often kind to themselves as well.[79] Notably, they also tend to have more balanced social support interactions in their relationships,[80] which has implications for their wellbeing, as discussed above. But their care extends beyond people they directly interact with, often giving to and helping strangers in need.[81] Much research supports the idea that more compassionate people have higher wellbeing and experience fewer mental health symptoms.[82] Even in high-stress jobs, those who are more compassionate report lower stress and burnout.[83] These wellbeing effects run deep, translating into lower stress hormones during stressful situations[84] and even a lower risk of dying among older adults.[85]
A related pathway that can extend one’s circle of compassion is experiencing caring emotions, which increase altruistic motivations, making people more likely to help others.[86] For example, to the extent that people experience increased feelings of benevolence after giving to distant others (compared to close others), these feelings increase their happiness.[87] Thus, both compassionate traits and feelings can feel rewarding to people, even when directed toward strangers.
Another such pathway is caring motivations. People who have such other-focused motivations experience more positive emotions and higher self-esteem.[88] When following such people over time, researchers find that having caring motivations at one time point predicts later increased positive emotions and self-esteem, fewer anxiety and depression symptoms, and decreased feelings of loneliness, isolation, and other negative feelings.[89]
People can have caring motivations in general, but such motivations are often applied to specific prosocial behaviours. Although prosocial behaviours may appear to be other-focused, there are many reasons that people engage in them, such as self-enhancement, indicating that they can be motivated by self- and/or other-oriented concerns.[90] Research consistently finds that not all acts of kindness offer equivalent wellbeing benefits and that self-focused motives may undermine the emotional rewards that typically follow other-focused prosocial behaviour.
For example, among volunteer healthcare workers, other-oriented motives for helping predict higher life satisfaction, but self-oriented motives do not.[91] Other research confirms and extends this, finding that volunteers with altruistic motivations have higher self-esteem, wellbeing, self-efficacy, and connectedness,[92] and volunteers who value others report decreased distress.[93] Even simply recalling an instance of other-focused helping can increase positive emotions compared to recalling an instance of self-focused helping.[94]
Such other-oriented motivations also benefit nonprofit organisations, in that volunteers with altruistic motivations also have increased satisfaction with their volunteer role and more intentions to continue volunteering in the future.[95] Remarkably, other-oriented older adult volunteers have a lower risk of dying when tracked over time compared to those with more self-focused motivations.[96]
Research on blood donations displays a similar pattern on physical pain measures. In one recent study, people reported less intense pain from a vein puncture when blood was drawn for the purpose of post-earthquake medical use than when blood was drawn for personal medical tests.[97] Taken together, research on caring traits, feelings, and motivations suggest that the reason that people give is as important as the actual giving behaviours in terms of promoting wellbeing.
Overall, giving in communities of care is more likely to lead to emotional rewards than giving in disconnected or less caring contexts. These communities can consist of people we interact with in our daily lives,[98] and can also imaginatively extend beyond known others, through caring traits, feelings, and motivations. Next, we discuss two other features that may be prevalent in such caring communities: freely choosing one’s benevolent behaviours, and caring about the impact of them.
Choice
Caring communities provide people with a variety of ways to help one another as well as the choice of how to do so. For example, a teenager living in a caring community can choose to volunteer at the local homeless shelter, mentor younger children in a sport they love, or assist an elderly neighbour with grocery shopping.
The opportunity to choose how to help others is important because people are more likely to feel happy after giving when they have a sense of autonomy or personal choice in how they help.[99] Evidence supporting this claim comes from studies exploring different kinds of prosocial behaviour and research methods. For instance, in the realm of volunteering, people can choose to help others for reasons that they find personally valuable (autonomous motivations) or reasons that are forced upon them (controlled motivations), and the reasons for volunteering matter. A large survey conducted with over 700 college students in China who volunteered during COVID found that volunteers who endorsed more autonomous motivations for their actions experienced greater satisfaction, meaning, and happiness.[100] Meanwhile, volunteers who expressed higher levels of controlled motivations reported lower satisfaction, meaning, and happiness. Similar findings have been observed using a large data set from the National Longitudinal Study of Adolescent and Adult Health in the United States. Youth volunteers who provide assistance voluntarily also reported lower levels of depression, while volunteers who say their volunteering is “required by others” do not.[101]
Similar findings have been observed when people give or transfer money. For instance, in one study, 80 students were provided with a few dollars to distribute between themselves and another person. Afterwards, each student reported their wellbeing. Importantly, half of the students were allowed to choose how much money, if any, they wanted to give to the other person (high-choice). Meanwhile, the other half of students were not given a choice in how the money was distributed, they were simply told to distribute the money between themselves and the other person (low-choice). Participants reported experiencing higher levels of happiness when they gave more money to the other person, but only when the participant had a choice over how much was given.[102] Harbaugh and colleagues (2007) arrived at a similar conclusion when looking at brain activation as people donated to a local charity while in an fMRI scanner. People showed activation in parts of the brain that are commonly associated with pleasurable tasks or enjoyable activities while giving, and this pattern of activity was greatest when people made voluntary donations.
The importance of feeling as if one has exercised choice when helping others can even be detected upon reflection. In one experiment, individuals were asked to write about a time they chose to help another person and a time in which they helped another person but had little choice. After writing each description, participants reported their current happiness. Consistent with the evidence reviewed above, people reported greater momentary wellbeing after recalling a time they chose to help someone else as opposed to a time they did not have a choice about how to help.[103]
While not all situations allow people total freedom when deciding how to engage in prosocial action, past research suggests it can be helpful to provide even a small degree of choice. For instance, when people are required to complete a prosocial act, such as contribute to their child’s school or religious community, it could be helpful to allow people to decide when (which date and time) and how (volunteer at a fundraiser, donate from home) they would like to help. This flexibility may protect one’s sense of choice and, in turn, bolster the joy of giving. If this possibility is not viable, some research suggests that reminding people they have some freedom to choose whether or not to help can be beneficial. For example, in one study, 104 students were instructed to help on a task.[104] Half the students were told it was “entirely their choice whether to help or not” while the other half of students were told that they “should help out.” Afterwards, students reported their wellbeing. Students who were reminded of their choice to help reported greater happiness.
There are a few potential reasons why voluntary (as opposed to involuntary) giving may lead to greater happiness. One possibility is that freely chosen giving may fulfil a basic human urge to act in a way that one chooses. Whether it be deciding what to eat for dinner or how to assist others, having the freedom to make your own choices is a strong predictor of happiness.[105] Another reason that voluntary giving may lead to greater happiness is that it allows people to show and act upon their personal preferences when it comes to giving. If someone has a particular affinity for the environment or caring for children, autonomous helping provides a chance to help in this way. Finally, unforced giving may be especially likely to bolster happiness because it provides people with evidence that they are a kind and generous person, revealing their caring traits. Unforced giving is particularly powerful proof because one’s kind act was self-chosen and not required by external pressures, such as government legislation or educational requirements.
Clear positive impact
Caring communities may also encourage generosity by providing clearer opportunities to see how one’s actions have made a positive impact on others. Indeed, caring communities may be more likely to foster a clear dialogue or exchange of information that allows recipients to relay what they need, and for helpers to appreciate how their assistance has been effective.
Classic research in psychology has shown that recognising how one’s actions are effective is a key predictor of whether one helps. For instance, research on what is called “the identifiable victim effect” has documented that people are more likely to help one clear identifiable target in need over a larger number of unknown targets.[106] While there are various reasons for why people respond in this manner, one contributing factor is that people can more clearly see or imagine how their assistance will be effective when helping a singular, detailed target over a larger number.[107]
Beyond encouraging people to act, recognising how one’s actions positively impact others amplifies the joy of giving. For instance, in one experiment, 120 students were given 10 Canadian dollars and were then invited to donate some, none, or all to a charity before reporting their happiness.[108] Critically, half of the students were asked to donate to a charity that made the positive impact of their work incredibly clear by stating that every $10 purchases a bed net for a child in need to stop the spread of malaria. Meanwhile, the other half of students were asked to donate to another charity that also helped children in the same region but did not clearly explain how the donation would be used. When the impact of the donation was clear, people who donated more money to charity reported higher happiness. Yet, when the impact of giving was not clear, people who gave more money did not report greater happiness. These findings suggest that creating or fostering opportunities for people to appreciate how they have helped others can increase the wellbeing of the helper.
Indeed, similar findings have been observed among living kidney donors who tend to report the greatest positive reactions about their actions when they feel like their donation was impactful in helping the recipient survive.[109] Thus, creating an opportunity for recipients to meet the donor and express their appreciation may heighten feelings of impact and the joy of giving. This may be why many nonprofits go to great lengths to facilitate these connections and why some organisations, like blood donor clinics, now allow donors to receive messages when their contributions have been directed to a recipient. Finally, feelings of efficacy may help to explain why activism behaviour is not associated with wellbeing while other forms of helping often are.[110] The positive effects of one’s activism may be harder to see given the nature of many ongoing social problems.
Our new evidence
How are individual benevolent actions and perceptions of social benevolence linked to life evaluations? To answer this question, we use data from the 2019 Gallup World Poll which includes individual data for the wallet questions discussed earlier.[111] This allows us to see how personally engaging in prosocial behaviour – versus believing that others will act in a benevolent way – is linked to wellbeing.
Figure 2.4 shows that people’s prosocial actions and their beliefs about the benevolence of others are both important predictors of individual life evaluations when assessed within the same equation.[112]
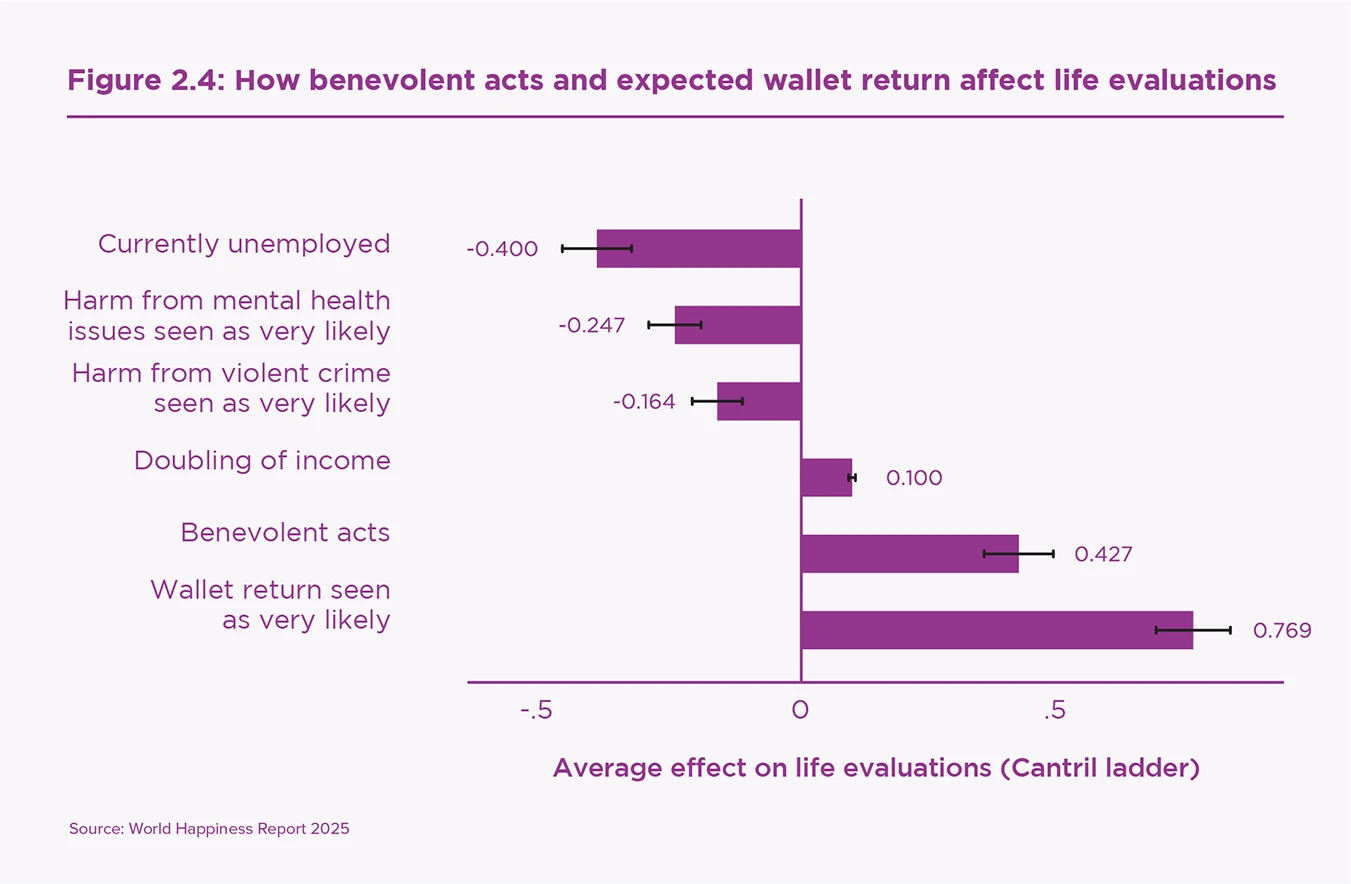
The ‘benevolent acts’ variable is the average frequency for the three benevolent acts, with a value of 1 for individuals who performed each of the three acts in the previous month. If the acts are included as separate variables, each of them has a significant effect, about twice as large for donations as for volunteering or helping strangers.[113]
Expected wallet return also has a large positive effect, almost twice that for benevolent acts. Believing that others would return a wallet predicts a larger boost to life satisfaction than a doubling of income. Believing that your lost wallet would very likely be returned is accompanied by life satisfaction that is higher by more than three-quarters of a point on the 0–10 scale.[114] This effect is almost twice as large as being unemployed. It is also higher than the negative effects of comparably measured expected harms from mental health issues or violent crime.[115]
Caring and sharing reduce wellbeing inequality by being more valuable to those facing less fortunate life circumstances.
Benevolence and inequality
The distribution of wellbeing among individuals and population groups is as important as its average. In several recent editions of the World Happiness Report, we have documented sharp increases in the inequality of wellbeing globally[116] and in most global regions[117] as well as growing gaps between the top and bottom halves of the population.[118]
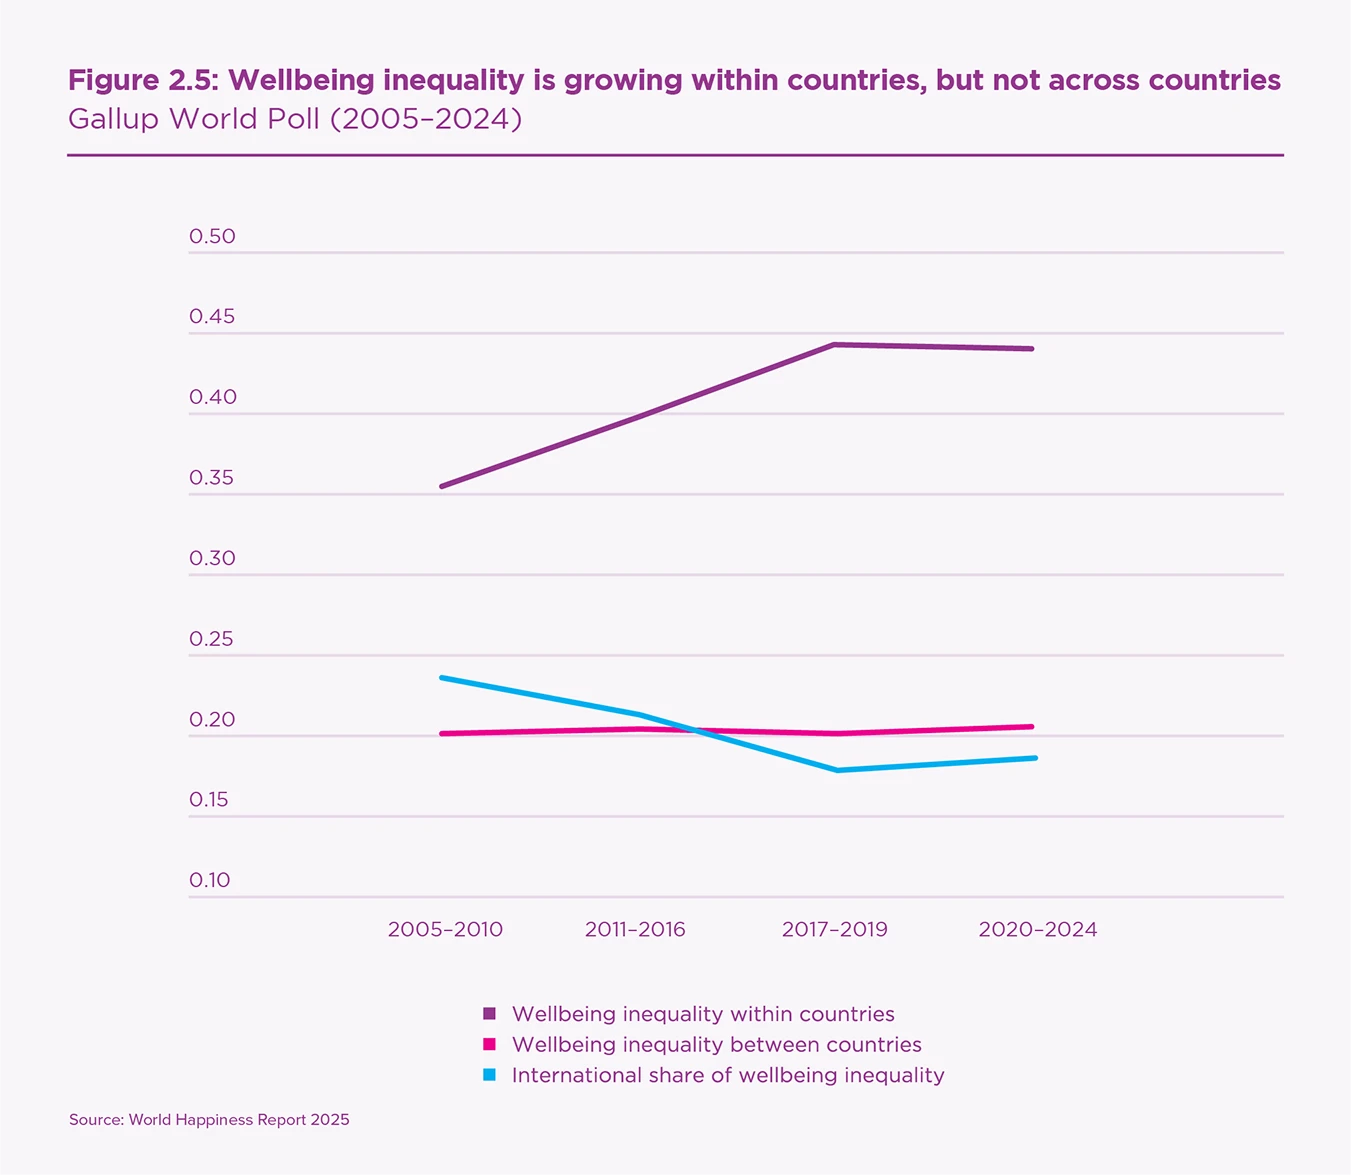
Our latest analysis, shown in Figure 2.5, separates the trends in wellbeing inequality within countries and between countries. The purple line shows that the average within-country inequality of wellbeing has increased by about one-quarter over the past two decades.[119] As shown by the pink line, the between-country inequality of wellbeing has remained essentially unchanged at 0.2.[120] The international share of total individual variance in life evaluations, as shown by the blue line,[121] has thus dropped, from 0.236 to 0.187.
Past reports have shown that wellbeing inequality itself lowers national average happiness, while World Happiness Report 2020 broke new ground in showing that living in countries with high social and institutional trust is of significantly greater value for those afflicted by ill health, unemployment, unsafe streets, and difficult family circumstances. These afflictions are all more common among those reporting lower life satisfaction. Thus, countries with higher trust have less inequality of wellbeing, as revealed by using interaction terms between life circumstances and measures of trust.[122]
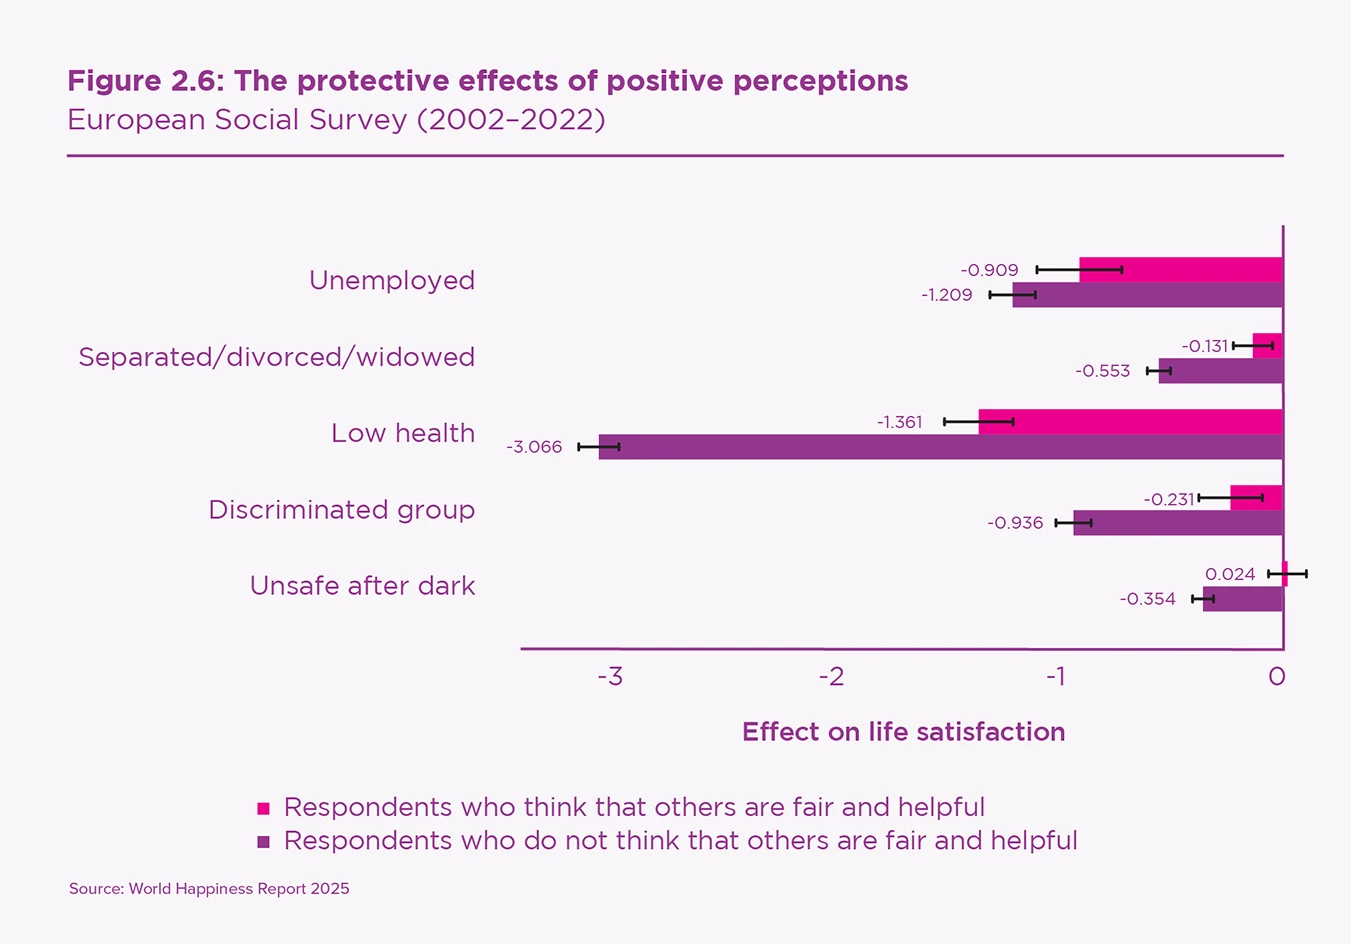
Furthermore, caring and sharing reduce wellbeing inequality by being more valuable to those facing less fortunate life circumstances. Data from the European Social Survey (2002–2022) show that people who judge most people to be both fair and kind suffer materially less from being subject to unemployment, ill health, discrimination, or unsafe streets.[123] The results are shown in Figure 2.6. These are large effects, so the scale is different than in Figure 2.4.
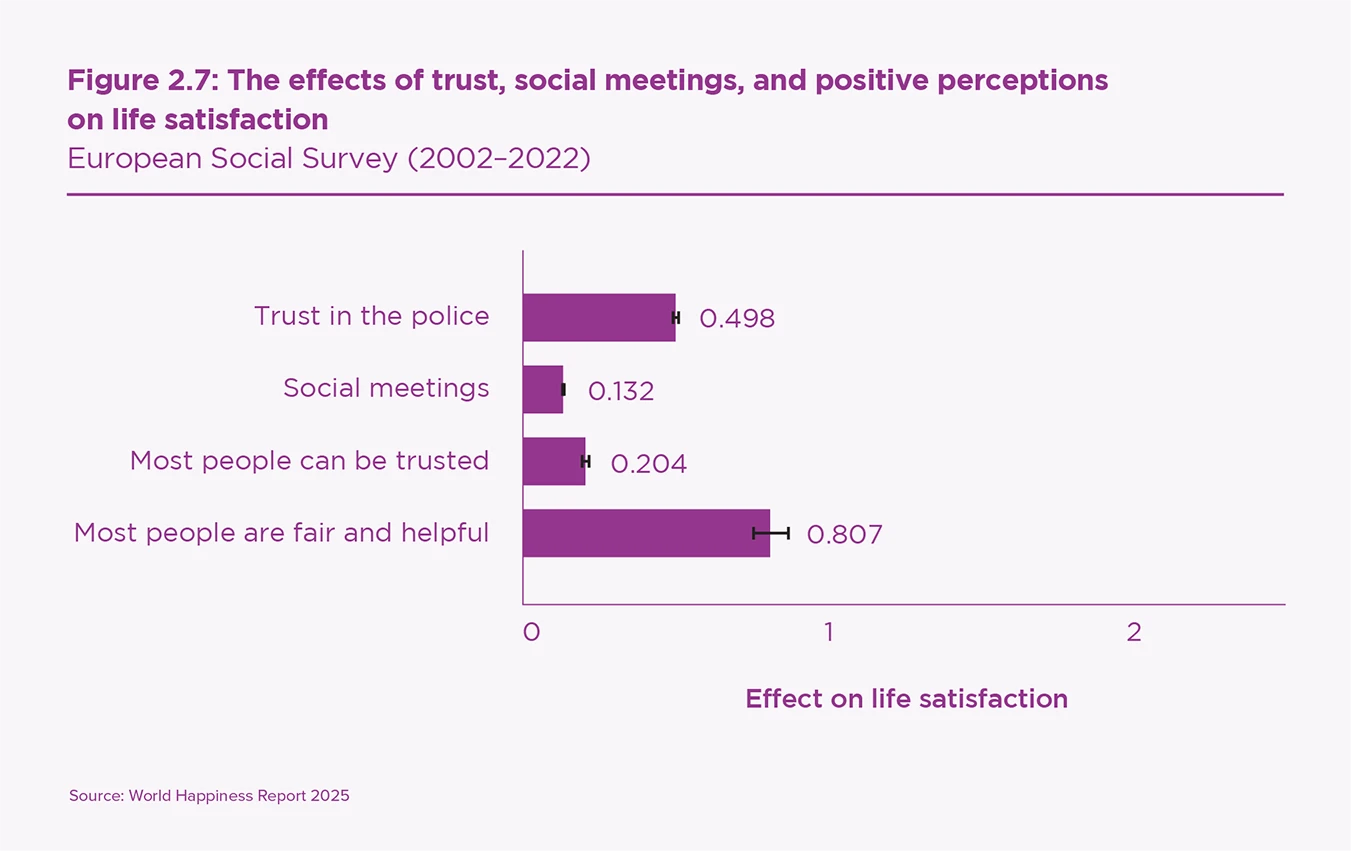
These interactions come from an equation using European Social Survey data from 2002–2023 that also includes a large main effect, four-fifths of a point on the 0–10 scale (as shown in Figure 2.7) for anyone living in a country where they judge others to be both fair and helpful. Figure 2.7 also shows substantial positive effects from frequent social meetings,[124] high social trust,[125] and trust in the police.[126] The scale in Figure 2.7 is the same as in Figure 2.6.
Benevolence between countries
Official Development Assistance (ODA) refers to government-provided aid aimed at fostering economic development and improving the welfare of low- and middle-income countries. It can be considered a form of prosocial behaviour when viewed from the perspective of international relations and collective welfare. However, ODA is also associated with motivations such as strategic interests, political alliances, or economic benefits. This duality of altruistic versus self-interested motives makes ODA a nuanced example of prosocial behaviour.
To better capture the prosocial component, we focus on untied ODA i.e., aid that is freely and fully available to finance procurement from all countries. It differs from tied or partially tied aid which restricts the procurement of goods or services to the donor country or a specific group of countries. Tied aid can negatively affect aid effectiveness by increasing the costs of goods and services, and possibly deflecting policy priorities. Moreover, untied aid represents the majority of total ODA commitment by many donors, thus we focus on untied ODA in our analysis.[127]
Another potential form of international prosocial behaviour is hosting refugees, as it reflects actions taken by countries to assist vulnerable populations in need, often at considerable cost and with little or no immediate benefit to the host country. The number of forcibly displaced people worldwide has risen significantly in recent years. According to UNHCR’s 2024 Mid-Year Trends report, 122.6 million people worldwide were forcibly displaced in the first half of 2024 due to persecution, violence, conflict, human rights abuses, or events disrupting public order. Of these, 32 million are refugees under UNHCR’s mandate. While hosting refugees often aligns with prosocial and altruistic values, it does not always stem purely from voluntary goodwill. Geopolitical pressures, international legal obligations, geographical location, and domestic political considerations frequently play substantial roles. For instance, low- and middle-income countries host 71% of the world’s refugees and other people in need of protection, and 69% of refugees and others in need of international protection reside in neighbouring countries. These figures illustrate that hosting refugees is not always a purely prosocial activity. Given that current data do not distinguish between voluntarily and involuntarily hosted refugees, interpreting the estimated relationship between the refugee ratio and happiness requires caution.
While numerous empirical studies at the individual level demonstrate that prosocial spending enhances the giver’s happiness, research on how prosocial behaviours by nations affect donor happiness remains scarce. Most individual-level studies focus on the psychological mechanisms behind giving, such as the warm glow effect or a sense of altruistic satisfaction, which contribute to increased subjective wellbeing. However, at the national level, prosocial behaviours like ODA and refugee hosting involve complex dynamics that extend beyond individual motivations. These behaviours are influenced by political, economic, and social factors which can shape the perceptions and experiences of citizens in donor countries. This section addresses this gap by analysing the relationship between national-level prosocial actions and donor happiness on a global scale. By examining data on ODA and refugee hosting alongside measures of national wellbeing, this analysis explores whether collective generosity translates into increased happiness for donor populations.
We present the data for ODA and refugees first and then proceed to empirical analysis. Table 2.3 shows the top 20 countries ranked by untied ODA commitments as a share of GDP in 2022. It refers to untied bilateral commitments that consist of grants and grant-like contributions as well as loans in current dollars.[128] We calculate the untied ODA as a share of PPP-adjusted GDP and per capita value ($US). The GDP and population data are retrieved from the World Bank’s World Development Indicators (WDI). The table reveals that Western and Northern European countries generally exhibit higher per capita values among the donor countries. In 2022, the top five countries are Norway, Switzerland, Sweden, Germany, and Denmark.
| Rank | Donor | Ratio of untied ODA to GDP (%) | Untied ODA per capita ($) | Untied ODA (million $) |
|---|---|---|---|---|
| 1 | Norway | 0.54 | 673.63 | 3,676.07 |
| 2 | Switzerland | 0.36 | 324.46 | 2,847.77 |
| 3 | Sweden | 0.33 | 218.82 | 2,294.77 |
| 4 | Germany | 0.31 | 211.86 | 17,753.10 |
| 5 | Denmark | 0.28 | 218.05 | 1,287.15 |
| 6 | France | 0.26 | 148.66 | 10,118.30 |
| 7 | Luxembourg | 0.24 | 351.80 | 229.76 |
| 8 | Canada | 0.22 | 137.72 | 5,362.77 |
| 9 | Netherlands | 0.21 | 164.73 | 2,915.89 |
| 10 | Japan | 0.19 | 89.75 | 11,230.20 |
| 11 | Iceland | 0.17 | 123.98 | 47.36 |
| 12 | Australia | 0.11 | 69.04 | 1,796.07 |
| 13 | United States | 0.10 | 81.83 | 27,270.10 |
| 14 | New Zealand | 0.10 | 51.25 | 262.26 |
| 15 | Republic of Korea | 0.10 | 50.44 | 2,606.33 |
| 16 | United Kingdom | 0.09 | 54.13 | 3,669.26 |
| 17 | Belgium | 0.09 | 59.27 | 692.33 |
| 18 | Ireland | 0.08 | 106.85 | 551.96 |
| 19 | Austria | 0.06 | 41.01 | 370.85 |
| 20 | Spain | 0.05 | 25.32 | 1,209.39 |
Notes: ODA share of GDP and per capita ODA are calculated by authors using ODA data from OECD as well as GDP and population data from WDI. ODA in this table refers to total untied bilateral commitments that consist of grants and grant-like contributions as well as loans in current dollars.
Table 2.4 presents the top 20 countries ranked by the ratio of resident refugees to population in 2022. The total numbers of refugees in each country are also reported. Refugee statistics are sourced from UNHCR, while population data is retrieved from the World Bank’s WDI to calculate refugees as a percentage of the population. The table shows that population refugee shares are highest in countries in the Middle East, Africa, and Europe. Specifically, Lebanon, Jordan, Montenegro, Türkiye, and Czechia were the countries with the highest refugee ratios in 2022.
| Rank | Country | Number of refugees | Refugees as % of population |
|---|---|---|---|
| 1 | Lebanon | 818,861 | 14.9 |
| 2 | Jordan | 697,761 | 6.2 |
| 3 | Montenegro | 32,438 | 5.3 |
| 4 | Türkiye | 3,568,259 | 4.2 |
| 5 | Czechia | 435,212 | 4.1 |
| 6 | Republic of Moldova | 105,374 | 4.1 |
| 7 | Iran | 3,425,091 | 3.9 |
| 8 | Chad | 592,764 | 3.3 |
| 9 | Uganda | 1,463,523 | 3.1 |
| 10 | Estonia | 40,806 | 3.0 |
| 11 | Austria | 258,613 | 2.9 |
| 12 | South Sudan | 308,369 | 2.8 |
| 13 | Bulgaria | 176,297 | 2.7 |
| 14 | Sweden | 277,726 | 2.6 |
| 15 | Poland | 971,129 | 2.6 |
| 16 | Germany | 2,075,445 | 2.5 |
| 17 | Lithuania | 67,638 | 2.4 |
| 18 | Sudan | 1,097,128 | 2.3 |
| 19 | Cyprus | 29,280 | 2.3 |
| 20 | Mauritania | 100,981 | 2.1 |
To assess the possible links to happiness, we added ‘ODA as % of GDP’ and ‘refugees as % of the population’ to our Table 2.1 equations for life evaluations and emotions, as reported in the online ODA appendix. The ODA share is positively linked to life evaluations, while the refugee share is negatively linked to both life evaluations and positive emotions. Neither ODA nor refugee shares show significant links to negative emotions. The life evaluation links for ODA and refugee shares are similar in magnitude after allowing for the different cross-country variability of ODA and refugee shares. An increase in ODA by one standard deviation is associated with a life evaluation higher by .07 points, while an increase of the same relative size in the refugee share is associated with an average life evaluation that is lower by .06 points. The data in Table 2.4 show that refugee shares are highest in countries that share borders with countries in turmoil or on escape routes from those countries. The plausible positive effects of offering a safe haven for refugees are being swamped by the pressures that fleeing populations place on neighbouring countries that are often themselves short of the basics of life.
The results in this section echo the general pattern of results surveyed earlier in the chapter: benevolent acts are more likely to support higher levels of happiness if they embody caring connections, choice, and a clear positive impact. These features are less typical for refugee flows, which are frequently driven by circumstances rather than caring connections or choice, and impose costs on both refugees and hosts. ODA is more likely to involve all of the three C’s. Since these are national decisions, however, they may reflect national interests not fully shared by the individuals whose happiness is being assessed. Furthermore, both the decisions to donate and the possible benefits in the receiving countries are far removed from the daily lives of individuals in the donor countries, whose immediate surroundings and social connections are likely to be of much greater importance. As for future trends in ODA, it is apparently being cut entirely in the United States, while being cut back in a number of other donor countries.[129]
National decisions are likely to have more impacts on the wellbeing of individuals in other countries to the extent that the resulting actions create or destroy peace. Overall rankings of individual life evaluations are especially low in countries wracked by violence, notably Afghanistan and Lebanon, and other countries not even in the rankings, such as Sudan and Syria, because conditions have been too unsafe to permit surveys.
International caring and sharing are likely to be of most benefit to global life evaluations, especially in conflict-ridden countries, to the extent that they can create peace and heal the wounds of past conflicts. Forgiveness is associated with higher life satisfaction in many studies,[130] especially where supported by favourable attitudes and beliefs about others.[131] These supporting attitudes are hardest to establish in international settings and where there are long-standing animosities and grievances. This makes it especially challenging to achieve forgiveness and reconciliation in conflict and post-conflict settings.[132] Our findings in this chapter expose the need for the kind of caring and sharing that delivers peace, forgiveness and reconciliation. Building a broader international network of caring connections seems to us a first necessary step, using such efforts to supplant the force of arms.
References
Aknin, L. B., Barrington-Leigh, C. P., Dunn, E. W., Helliwell, J. F., Burns, J., Biswas-Diener, R., Kemeza, I., Nyende, P., Ashton-James, C. E., & Norton, M. I. (2013). Prosocial spending and well-being: Cross-cultural evidence for a psychological universal. Journal of Personality and Social Psychology, 104(4), 635–652.
Aknin, L. B., Dunn, E. W., Whillans, A. V., Grant, A. M., & Norton, M. I. (2013). Making a difference matters: Impact unlocks the emotional benefits of prosocial spending. Journal of Economic Behavior & Organization, 88, 90-95.
Aknin, L. B., Dunn, E. W., & Whillans, A. V. (2022). The emotional rewards of prosocial spending are robust and replicable in large samples. Current Directions in Psychological Science, 31(6), 536-545.
Aknin, L. B., Hamlin, J. K., & Dunn, E. W. (2012). Giving leads to happiness in young children. PLoS one, 7(6), e39211.
Aknin, L. B., Sandstrom, G. M., Dunn, E. W., & Norton, M. I. (2011). It’s the recipient that counts: Spending money on strong social ties leads to greater happiness than spending on weak social ties. PLoS one, 6(2), e17018.
Aknin, L. B., & Whillans, A. V. (2021). Helping and happiness: A review and guide for public policy. Social Issues and Policy Review, 15(1), 3-34.
Aknin, L. B., Whillans, A. V., Norton, M. I., & Dunn, E. W. (2019). Happiness and prosocial behavior: An evaluation of the evidence. World Happiness Report, 67-86.
Algoe, S. B., & Haidt, J. (2009). Witnessing excellence in action: The ‘other-praising’ emotions of elevation, gratitude, and admiration. The Journal of Positive Psychology, 4(2), 105-127.
Au, A., Wong, A., Lai, M. & Chan, C. (2011). Empathy, coping, social support, and mental health in local and migrant adolescents in Beijing. International Journal on Disability and Human Development, 10(3), 173-178.
Aydinli, A., Bender, M., & Chasiotis, A. (2013). Helping and volunteering across cultures: Determinants of prosocial behavior. Online Readings in Psychology and Culture, 5(3), 1-27.
Ballard, P. J., Hoyt, L. T., & Pachucki, M. C. (2019). Impacts of adolescent and young adult civic engagement on health and socioeconomic status in adulthood. Child development, 90(4), 1138-1154.
Batson, C. D. (2011). Altruism in humans. Oxford University Press.
Bloem, J. R., & Oswald, A. J. (2022). The analysis of human feelings: a practical suggestion for a robustness test. Review of Income and Wealth, 68(3), 689-710.
Brethel-Haurwitz, K. M., Cardinale, E. M., Vekaria, K. M., Robertson, E. L., Walitt, B., VanMeter, J. W., & Marsh, A. A. (2018). Extraordinary Altruists Exhibit Enhanced Self–Other Overlap in Neural Responses to Distress. Psychological Science, 29(10), 1631-1641.
Bond, T. N., & Lang, K. (2019). The sad truth about happiness scales. Journal of Political Economy, 127(4), 1629–1640.
Burtson, P. L., & Stichler, J. F. (2010). Nursing work environment and nurse caring: relationship among motivational factors. Journal of Advanced Nursing, 66(8), 1819-1831.
Canevello, A., & Crocker, J. (2011). Interpersonal goals, others’ regard for the self, and self‐esteem: The paradoxical consequences of self‐image and compassionate goals. European Journal of Social Psychology, 41(4), 422-434.
Canevello, A., & Crocker, J. (2017). Compassionate goals and affect in social situations. Motivation and Emotion, 41, 158-179.
Chancellor, J., Margolis, S., Jacobs Bao, K., & Lyubomirsky, S. (2018). Everyday prosociality in the workplace: The reinforcing benefits of giving, getting, and glimpsing. Emotion, 18(4), 507-517.
Chen, E., Lam, P. H., Finegood, E. D., Turiano, N. A., Mroczek, D. K., & Miller, G. E. (2021). The balance of giving versus receiving social support and all-cause mortality in a US national sample. Proceedings of the National Academy of Sciences, 118(24), e2024770118
Chen, C., Lee, S. Y., & Stevenson, H. W. (1995). Response style and cross-cultural comparisons of rating scales among East Asian and North American students. Psychological Science, 6(3), 170–175.
Chida, Y., & Steptoe, A. (2008). Positive psychological well-being and mortality: a quantitative review of prospective observational studies. Psychosomatic Medicine, 70(7), 741-756.
Chopik, W. J., O’Brien, E., & Konrath, S. H. (2017). Differences in empathic concern and perspective taking across 63 countries. Journal of Cross-Cultural Psychology, 48(1), 23-38.
Clark, M. S., & Mills, J. R. (2012). A theory of communal (and exchange) relationships. In P. A. M. Van Lange, A. W. Kruglanski, & E. T. Higgins (Eds.), Handbook of theories of social psychology (pp. 232–250). Sage Publications Ltd. https://doi.org/10.4135/9781446249222.n38
Clary, E. G., & Snyder, M. (1999). The motivations to volunteer: Theoretical and practical considerations. Current Directions in Psychological Science, 8(5), 156-159.
Cohn, A., Maréchal, M. A., Tannenbaum, D., & Zünd, C. L. (2019). Civic honesty around the globe. Science, 365(6448), 70-73.
Cohen, S., Doyle, W. J., Turner, R. B., Alper, C. M., & Skoner, D. P. (2003). Emotional style and susceptibility to the common cold. Psychosomatic Medicine, 65(4), 652-657.
Crocker, J., & Canevello, A. (2008). Creating and undermining social support in communal relationships: The role of compassionate and self-image goals. Journal of Personality and Social Psychology, 95(3), 555-575.
Crocker, J., Canevello, A., Breines, J. G., & Flynn, H. (2010). Interpersonal goals and change in anxiety and dysphoria in first-semester college students. Journal of Personality and Social Psychology, 98(6), 1009-1024.
Curry, O. S., Rowland, L. A., Van Lissa, C. J., Zlotowitz, S., McAlaney, J., & Whitehouse, H. (2018). Happy to help? A systematic review and meta-analysis of the effects of performing acts of kindness on the well-being of the actor. Journal of Experimental Social Psychology, 76, 320-329.
Danner, D. D., Snowdon, D. A., & Friesen, W. V. (2001). Positive emotions in early life and longevity: Findings from the nun study. Journal of Personality and Social Psychology, 80(5), 804–813.
Das, G., van Esch, P., Jain, S. P., & Cui, Y. G. (2023). Donor happiness comes from afar: The role of donation beneficiary social distance and benevolence. International Journal of Research in Marketing, 40(4), 865-880.
De Neve, J. E., Diener, E., Tay, L., & Xuereb, C. (2013). The objective benefits of subjective well-being. In J. F. Helliwell, R. Layard, & J. Sachs (Eds.), World Happiness Report 2013 (pp. 54–79). New York: SDSN.
Depow, G. J., Francis, Z., & Inzlicht, M. (2021). The experience of empathy in everyday life. Psychological Science, 32(8), 1198-1213.
Doyle, W. J., Gentile, D. A., & Cohen, S. (2006). Emotional style, nasal cytokines, and illness expression after experimental rhinovirus exposure. Brain, Behavior, and Immunity, 20(2), 175-181.
Dunn, E. W., Aknin, L. B., & Norton, M. I. (2014). Prosocial spending and happiness: Using money to benefit others pays off. Current Directions in Psychological Science, 23(1), 41-47.
Ferrer‐i‐Carbonell, A., & Frijters, P. (2004). How important is methodology for the estimates of the determinants of happiness?. The Economic Journal, 114(497), 641–659.
Fowler, J. H., & Christakis, N. A. (2010). Cooperative behavior cascades in human social networks. Proceedings of the National Academy of Sciences, 107(12), 5334-5338.
Fredrickson, B. L. (2001). The role of positive emotions in positive psychology: The broaden-and-build theory of positive emotions. American Psychologist, 56(3), 218–226.
Gallagher, S., Haugh, C., Castro Solano, A., de la Iglesia, G., & McMahon, J. (2022). Social support imbalance and depressive symptoms in young adolescents: The negative effect of giving but not receiving. International Journal of Adolescence and Youth, 27(1), 528-540.
Gao, F., Li, Y., & Bai, X. (2022). Forgiveness and subjective well-being: A meta-analysis review. Personality and Individual Differences, 186, 111350.
García-Campayo, J., Barcelo-Soler, A., Martínez-Rubio, D., Navarrete, J., Perez-Aranda, A., Feliu-Soler, A., … & Montero-Marin, J. (2024). Exploring the relationship between self-compassion and compassion for others: The role of psychological distress and wellbeing. Assessment, 31(5), 1038-1051.
Gulrajani, N., & Pudussery, J. (2025). With the knives out on development spending, have we reached “Peak aid”? . The Guardian. https://www.theguardian.com/global-development/2025/jan/23/global-development-economics-donor-spending-refugee-oecd-world-bank-peak-aid
Hampton, K. N. (2016). Why is helping behavior declining in the United States but not in Canada?: Ethnic diversity, new technologies, and other explanations. City & Community, 15(4), 380-399.
Heine, S. J., Lehman, D. R., Peng, K., & Greenholtz, J. (2002). What’s wrong with cross-cultural comparisons of subjective Likert scales?: The reference-group effect. Journal of Personality and Social Psychology, 82(6), 903-918.
Helliwell, J. F., & Aknin, L. B. (2018). Expanding the social science of happiness. Nature Human Behaviour, 2(4), 248-252.
Helliwell, J. F., Huang, H., & Wang, S. (2018). New Evidence on Trust and Well-Being. The Oxford Handbook of Social and Political Trust, 409.
Helliwell, J. F., Layard, R., Sachs, J. D., De Neve, J.-E., Aknin, L. B., & Wang, S. (Eds.). (2024). World Happiness Report 2024. University of Oxford: Wellbeing Research Centre.
Helliwell, J. F., Shiplett, H., & Bonikowska, A. (2020). Migration as a test of the happiness set‐point hypothesis: Evidence from immigration to Canada and the United Kingdom. Canadian Journal of Economics/Revue canadienne d’économique, 53(4), 1618–1641.
Helliwell, J. F., & Wang, S. (2011). Trust and wellbeing. International Journal of Wellbeing, 1, 1, 42-78.
Ho, S. S., Konrath, S., Brown, S., & Swain, J. E. (2014). Empathy and stress related neural responses in maternal decision making. Frontiers in Neuroscience, 8, 152.
Hui, B. P., Ng, J. C., Berzaghi, E., Cunningham-Amos, L. A., & Kogan, A. (2020). Rewards of kindness? A meta-analysis of the link between prosociality and well-being. Psychological Bulletin, 146(12), 1084.
Huo, M., Fuentecilla, J. L., Birditt, K. S., & Fingerman, K. L. (2019). Older adults’ empathy and daily support exchanges. Journal of Social and Personal Relationships, 36(11-12), 3814-3834
Inagaki, T. K., & Ross, L. P. (2018). Neural correlates of giving social support: Differences between giving targeted versus untargeted support. Psychosomatic Medicine, 80(8), 724-732.
Ironson, G., Solomon, G. F., Balbin, E. G., O’cleirigh, C., George, A., Kumar, M., … & Woods, T. E. (2002). The Ironson-Woods Spirituality/Religiousness Index is associated with long survival, health behaviors, less distress, and low cortisol in people with HIV/AIDS. Annals of Behavioral Medicine, 24(1), 34-48.
Jordan, J. J., Rand, D. G., Arbesman, S., Fowler, J. H., & Christakis, N. A. (2013). Contagion of cooperation in static and fluid social networks. PLoS ONE, 8(6), e66199.
Joshanloo, M., & Bond, M. H. (2023). National wealth, individualism, generalised trust, and religiosity as moderators of the relationship between helping strangers and life satisfaction in 137 societies. International Journal of Psychology, 58(2), 178-186.
Ju, E., Qi, H., Zhao, L., Luo, Y., Li, Y., & You, X. (2025). The Longitudinal Relationship between Adolescents’ Prosocial Behavior and Well-Being: A Cross-Lagged Panel Network Analysis. Journal of Youth and Adolescence, 1-14.
Kaiser, C., & Oswald, A. J. (2022). The scientific value of numerical measures of human feelings. Proceedings of the National Academy of Sciences, 119(42), e2210412119.
Kim, J., & Morgül, K. (2017). Long-term consequences of youth volunteering: Voluntary versus involuntary service. Social Science Research, 67, 160-175.
Konrath, S., Fuhrel-Forbis, A., Lou, A., & Brown, S. (2012). Motives for volunteering are associated with mortality risk in older adults. Health Psychology, 31(1), 87-96.
Konrath, S., & Handy, F. (2018). The development and validation of the motives to donate scale. Nonprofit and Voluntary Sector Quarterly, 47(2), 347-375.
Konrath, S., Martingano, A. J., Davis, M., & Breithaupt, F. (2023). Empathy trends in American youth between 1979 and 2018: an update. Social Psychological and Personality Science, 19485506231218360.
Konrath, S. H., O’Brien, E. H., & Hsing, C. (2011). Changes in dispositional empathy in American college students over time: A meta-analysis. Personality and Social Psychology Review, 15(2), 180-198.
Knack, S. (2001) Trust, associational life, and economic performance. In John F. Helliwell and Aneta Bonikowska, eds. The Contribution of Human and Social Capital to Sustained Economic Growth and Well-Being, 172-202, Ottawa: HRDC and OECD.
Knafo, A., Schwartz, S. H., & Levine, R. V. (2009). Helping strangers is lower in embedded cultures. Journal of Cross-Cultural Psychology, 40(5), 875-879.
Krueger, A. B., & Schkade, D. A. (2008). The reliability of subjective well-being measures. Journal of Public Economics, 92(8-9), 1833–1845.
Kushlev, K., Radosic, N., & Diener, E. (2022). Subjective well-being and prosociality around the globe: Happy people give more of their time and money to others. Social Psychological and Personality Science, 13(4), 849-861.
Le, B. M., Impett, E. A., Kogan, A., Webster, G. D., & Cheng, C. (2013). The personal and interpersonal rewards of communal orientation. Journal of Social and Personal Relationships, 30(6), 694-710.
Levine, R. V., Reysen, S., & Ganz, E. (2008). The kindness of strangers revisited: A comparison of 24 US cities. Social Indicators Research, 85, 461-481.
Luria, G., Cnaan, R. A., & Boehm, A. (2015). National culture and prosocial behaviors: Results from 66 countries. Nonprofit and Voluntary Sector Quarterly, 44(5), 1041-1065.
Martela, F., & Ryan, R. M. (2016). The benefits of benevolence: Basic psychological needs, beneficence, and the enhancement of well‐being. Journal of Personality, 84(6), 750-764.
Mogstad, M., Romano J.P., Shaikh, A. & Wilhelm D. (2024) Inference for Ranks with Applications to Mobility across Neighbourhoods and Academic Achievement across Countries, The Review of Economic Studies, 91, 1, 476–518.
Morelli, S. A., Lee, I. A., Arnn, M. E., & Zaki, J. (2015). Emotional and instrumental support provision interact to predict well-being. Emotion, 15(4), 484-493.
Mullet, E., López, López, W., & Pineda Marín, C. (2021). Forgiveness and reconciliation in post-conflict settings. Transitioning to peace: Promoting global social justice and non-violence, 67-90.
Muñoz Sastre, M. T., Vinsonneau, G., Neto, F., Girard, M., & Mullet, E. (2003). Forgivingness and satisfaction with life. Journal of Happiness Studies, 4(3), 323-335.
Peng, A., Patterson, M. M., & Wang, H. (2023). Attachment, empathy, emotion regulation, and subjective well-being in young women. Journal of Applied Developmental Psychology, 84, 101497.
Poulin, M. J. (2014). Volunteering predicts health among those who value others: Two national studies. Health Psychology, 33(2), 120-129.
Pressman, S. D., Jenkins, B. N., & Moskowitz, J. T. (2019). Positive affect and health: What do we know and where next should we go?. Annual Review of Psychology, 70, 627-650.
Qu, G., Ju, E., Qin, G., Chen, X., & Luo, Y. (2024). Profiles of volunteers’ motivations and positive experiences relate to their sustained volunteering during the COVID‐19 pandemic. Journal of Community & Applied Social Psychology, 34(1), e2748.
Qu, H., Konrath, S., & Poulin, M. (2020). Which types of giving are associated with reduced mortality risk among older adults?. Personality and Individual Differences, 154, 109668.
Reader’s Digest (2023) Most honest cities: the Reader’s Digest ‘lost wallet’ test. https://www.rd.com/list/most-honest-cities-lost-wallet-test/
Rhoads, S. A., Gunter, D., Ryan, R. M., & Marsh, A. A. (2021). Global variation in subjective well-being predicts seven forms of altruism. Psychological Science, 32(8), 1247-1261.
Rhoads, S. A., & Marsh, A. A. (2023a). Doing Good and Feeling Good: Relationships Between Altruism and Well-being for Altruists, Beneficiaries, and Observers. In World Happiness Report 2023 (11th ed., Chapter 4). Sustainable Development Solutions Network.
Rhoads, S. A., & Marsh, A. A. (2023b). Traits of Extraordinary Altruists. In Encyclopedia of Heroism Studies (pp. 1-4). Cham: Springer International Publishing.
Rhoads, S. A., Vekaria, K. M., O’Connell, K., Elizabeth, H. S., Rand, D. G., Kozak Williams, M. N., & Marsh, A. A. (2023). Unselfish traits and social decision-making patterns characterize six populations of real-world extraordinary altruists. Nature Communications, 14(1), 1807.
Rinner, M. T., Haller, E., Meyer, A. H., & Gloster, A. T. (2022). Is giving receiving? The influence of autonomy on the association between prosocial behavior and well-being. Journal of Contextual Behavioral Science, 24, 120-125.
Rober, M. (2019) 200 dropped wallets: the 20 most and least honest cities. https://www.youtube.com/watch?v=jnL7sJYblGY
Rojas, M. (2018). Happiness in Latin America has social foundations. In J. F. Helliwell, R. Layard, & J. Sachs (Eds.), World happiness report 2018 (pp. 114–145). New York: SDSN.
Ryan, R. M., & Deci, E. L. (2000). Self-determination theory and the facilitation of intrinsic motivation, social development, and well-being. American Psychologist, 55(1), 68-78.
Smith, P. B. (2019). Changes in reported nation-level pro-social behavior frequencies over 6 years: a test of alternative predictors. Social Indicators Research, 144(3), 1195-1208.
Song, Y., Broekhuizen, M. L., & Dubas, J. S. (2020). Happy little benefactor: Prosocial behaviors promote happiness in young children from two cultures. Frontiers in Psychology, 11, 1398.
Sortheix, F. M., Parker, P. D., Lechner, C. M., & Schwartz, S. H. (2019). Changes in young Europeans’ values during the global financial crisis. Social Psychological and Personality Science, 10(1), 15-25.
Steffen, P. R., & Masters, K. S. (2005). Does compassion mediate the intrinsic religion-health relationship?. Annals of Behavioral Medicine, 30(3), 217-224.
Stukas, A. A., Hoye, R., Nicholson, M., Brown, K. M., & Aisbett, L. (2016). Motivations to volunteer and their associations with volunteers’ well-being. Nonprofit and Voluntary Sector Quarterly, 45(1), 112-132.
Tham, Y. J., Okamoto, S., & Kobayashi, E. (2024). The importance of examining both the amount and balance of social support: A study on the relationship between social support and subjective well‐being of older Japanese adults. Journal of Community & Applied Social Psychology, 34(2), e2783.
Toussaint, L., & Friedman, P. (2009). Forgiveness, gratitude, and well-being: The mediating role of affect and beliefs. Journal of Happiness Studies, 10, 635-654.
Tsvetkova, M., & Macy, M. W. (2014). The Social Contagion of Generosity. PLoS ONE, 9(2), e87275.
Veerasamy, C., Sambasivan, M., & Kumar, N. (2015). Life satisfaction among healthcare volunteers in Malaysia: Role of personality factors, volunteering motives, and spiritual capital. VOLUNTAS: International Journal of Voluntary and Nonprofit Organizations, 26, 531-552.
Von Harscher, H., Desmarais, N., Dollinger, R., Grossman, S., & Aldana, S. (2018). The impact of empathy on burnout in medical students: new findings. Psychology, Health & Medicine, 23(3), 295-303.
Waddimba, A. C., Bennett, M. M., Fresnedo, M., Ledbetter, T. G., & Warren, A. M. (2021). Resilience, well-being, and empathy among private practice physicians and advanced practice providers in Texas: A structural equation model study. Mayo Clinic Proceedings: Innovations, Quality & Outcomes, 5(5), 928-945.
Wang, Y., Ge, J., Zhang, H., Wang, H., & Xie, X. (2020). Altruistic behaviors relieve physical pain. Proceedings of the National Academy of Sciences, 117(2), 950-958.
Wheeler, J. A., Gorey, K. M., & Greenblatt, B. (1998). The beneficial effects of volunteering for older volunteers and the people they serve: A meta-analysis. The International Journal of Aging and Human Development, 47(1), 69-79.
Wiwad, D., & Aknin, L. B. (2017). Motives matter: The emotional consequences of recalled self-and other-focused prosocial acts. Motivation and Emotion, 41, 730-740.
Xia, W., van Wijngaarden, J. D., Huijsman, R., & Buljac-Samardžić, M. (2024). The effect of long-term (im)balance of giving versus receiving support with nonrelatives on subjective well-being among home-dwelling older people. The Journals of Gerontology, Series B: Psychological Sciences and Social Sciences, 79(4), gbad198.
Yin, Y., & Wang, Y. (2023). Is empathy associated with more prosocial behaviour? A meta‐analysis. Asian Journal of Social Psychology, 26(1), 3-22.
Yan, Z. Q., Su, J. L., & Su, Y. J. (2017). Increasing empathy in Chinese college students: a cross-temporal meta-analysis. Psychology of Technology Applied, 5(10), 578-585.
Yang, F. (2024). Being good and feeling good: What happiness means to children. Child Development Perspectives. https://doi.org/10.1111/cdep.12522
Yuan, M., Spadaro, G., Jin, S., Wu, J., Kou, Y., Van Lange, P. A., & Balliet, D. (2022). Did cooperation among strangers decline in the United States? A cross-temporal meta-analysis of social dilemmas (1956–2017). Psychological Bulletin, 148(3-4), 129.
Wu, F., & Nugent, J. B. (2024). Mitigating Life Challenges to Subjective Well-being through Civic Engagement: Insights from a Global Perspective (No. 1489). GLO Discussion Paper.
Zhang, W., Pan, J., Liu, J., Zhang, Y., & Chen, M. (2021). Recipients’ happiness in prosocial spending: The role of social ties. Journal of Consumer Affairs, 55(4), 1333-1351.
Endnotes
This was reported for the seven deep-dive countries in World Happiness Report 2023 and for the global sample of Gallup World Poll countries in World Happiness Report 2024. ↩︎
Donations are the only one of the three benevolent acts to have a statistically significant relation to average life evaluations at the national level. In our results using individual-level data later in the chapter we find significant positive linkages for all three benevolent acts. In our Table 2.1 results the donation variable removes the influence of log GDP, leaving the coefficient on income to include those effects that flow through their support for larger donations. ↩︎
A country’s average answer to the Cantril Ladder question is exactly equivalent to a notion of average underlying satisfaction with life under an assumption of ‘cardinality’: the idea that the difference between a 4 and a 3 should count the same as the difference between a 3 and a 2, and be comparable across individuals. Some social scientists argue that too little is known about how people choose their answer to the Cantril Ladder question to make this assumption and that if it is wrong enough, then rankings based on average survey responses could differ from rankings based on underlying satisfaction with life (Bond & Lang, 2019). Other researchers have concluded that answers to the Cantril Ladder question are indeed approximately cardinal (Bloem & Oswald, 2022; Ferrer-i-Carbonell & Frijters, 2004; Kaiser & Oswald, 2022; Krueger & Schkade, 2008). ↩︎
For any pair of countries, the confidence intervals for the means (depicted in Figure 2.1 as whiskers) can be used to gauge which country’s mean is higher than the other, accounting for statistical uncertainty in the measurement of each. The confidence interval for a country’s rank (given in Figure 2.1 as text, in the form (4-8) represents a range of possible values for the ranking of their mean among all countries, accounting for uncertainty in the measurement of all of the means (following Mogstad et al. 2024). The ranges are constructed so that the chance that the range does not contain the country’s true rank is no more than 5%. ↩︎
Not every country has a survey every year. The total sample sizes are reported in the online Statistical Appendix and are reflected in Figure 2.1 by the size of the 95% confidence intervals for the mean, indicated by horizontal lines. The confidence intervals are naturally tighter for countries with larger samples. ↩︎
See Helliwell et al. (2020) for a detailed analysis of the life satisfaction of immigrants to the United Kingdom and Canada from many source countries. ↩︎
In 2013 there was no significant difference between the male and female responses while in this report (with surveys from 2022 and 2023) the male life evaluations are one-third higher than for females (1.57/1.16). This is the largest gender gap ever seen in our reports, where at the global level there is a slight advantage favouring females. ↩︎
Going from the larger to the smaller gains, these were Portugal, Iceland, Germany, and Finland. ↩︎
All with increases of 0.2 points or more on the 0–10 scale. ↩︎
All with drops of 0.17 or more on the 0–10 scale. ↩︎
The online statistical appendix contains alternative forms without year effects (Table A9) and a repeat version of the Table 2.1 equation showing the estimated year effects (Table A8). These results continue to confirm that inclusion of year effects makes no significant difference to any of the coefficients. In these aggregate equations, adding country fixed effects (as in Table A10) lowers the coefficients on relatively slowly moving variables where most of the variance is across countries rather than over time, such as healthy life expectancy. Our equations based on individual observations (e.g., Figure 2.4), where income and health are measured by individual-level variables, include both year and country fixed effects, with coefficients very similar to those estimated without fixed effects. ↩︎
The definitions of the variables are shown in Box 2.2, with additional detail in the online statistical appendix. ↩︎
The model’s predictive power is little changed if the year fixed effects in the model are removed, with adjusted R-squared falling only from 0.761 to 0.756. ↩︎
The data and rankings for the 2022–2024 averages for the six variables are to be found in Figures 48–65 of the online statistical appendix. The rankings for positive affect are in Figures 66–68, and for negative affect in Figures 69–71. The underlying annual data used in estimating the equations shown in Table 2.1 are currently not available on our website. We can at this time provide the data to researchers approved by Gallup. ↩︎
For example, unemployment responses at the individual level are available in most waves of the Gallup World Poll. While they show an effect size similar to that found in other research, the coefficient has never been significant in the country-level equation and their inclusion does not influence the size of the other coefficients. ↩︎
The main differences are a larger income effect, presumably flowing from the cyclical variations, and the insignificance of the healthy life expectancy effect, probably due to its trend-like variation in most countries. ↩︎
Below, we use the term ‘effect’ when describing the coefficients in these regressions; some caveats to this interpretation are discussed later in this section. ↩︎
In the equation for negative affect, healthy life expectancy takes a significant positive coefficient, despite its positive simple correlation with life evaluations in this aggregate dataset. This may be due to the fact that in the global sample there is a positive correlation between age and the frequency of reports of negative emotions. Countries with higher healthy life expectancies have respondents who are older on average, since the sample data are weighted to replicate the actual age shares of the population. ↩︎
This influence may be direct, as many have found, e.g., De Neve et al. (2013). It may also embody the idea, as made explicit in Fredrickson’s broaden-and-build theory (Fredrickson, 2001), that good moods help to induce the sorts of positive connections that eventually provide the basis for better life evaluations. ↩︎
See, for example, the well-known study of the longevity of nuns, Danner et al. (2001). ↩︎
See Cohen et al. (2003) and Doyle et al. (2006). ↩︎
The meta-analysis by Chida and Steptoe (2008) shows significant linkages from positive affect to health, independent of the effects of negative affect. For a recent survey of the links running from positive emotions and life evaluations to subsequent morbidity and mortality, see Pressman et al. (2019). ↩︎
The prevalence of these feedbacks was documented in Chapter 4 of World Happiness Report 2013, De Neve et al. (2013). ↩︎
For more detail, see Table 10 of the online Statistical Appendix for World Happiness Report 2018. ↩︎
We expected the coefficients on these variables (but not on the variables based on non-survey sources) to be reduced to the extent that idiosyncratic differences among respondents tend to produce a positive correlation between the four survey-based factors and the life evaluations given by the same respondents. This line of possible influence is cut when the life evaluations are coming from an entirely different set of respondents than are the four social variables. The fact that the coefficients are reduced, but only very slightly, suggests that the common-source link is real but very limited in its impact. ↩︎
The coefficients on GDP per capita and healthy life expectancy were affected even less than were the coefficients on the survey variables, and in the opposite direction in the case of the income measure, being increased rather than reduced, once again just as expected. The changes were very small because the data come from other sources and are unaffected by our experiment. However, the income coefficient does increase slightly since income is positively correlated with the other four variables being tested, so that income is now able to pick up a fraction of the drop in influence from the other four variables. We also performed an alternative robustness test using the previous year’s values for the four survey-based variables. Because each year’s respondents are from a different random sampling of the national populations, using the previous year’s average data also avoids using the same respondent’s answers on both sides of the equation. This alternative test produced similarly reassuring results as shown in Table 13 of the online Statistical Appendix in World Happiness Report 2018. The Table 13 results are very similar to the split-sample results shown in Tables 11 and 12, and all three tables give effect sizes very similar to those in Table 2.1 in the main text. Because the samples change only slightly from year to year, there was no need to repeat these tests with this year’s sample. ↩︎
Actual and predicted national and regional average 2022–2024 life evaluations are plotted in Figure 72 of the online statistical appendix. The 45-degree line in each part of the figure shows a situation where the actual and predicted values are equal. A predominance of country dots below the 45-degree line shows a region where actual values are below those predicted by the model, and vice versa. Southeast Asia provides the largest current example of the former case, and Latin America of the latter. ↩︎
See Rojas (2018) and Chapter 4 of this report. ↩︎
If special variables for Latin America and Southeast Asia are added to the equation in column 1 of Table 2.1, the Latin American coefficient is +0.49 (t=5.3) while that for Southeast Asia is -0.3 (t=2.1). Special variables for East Asia and South Asia are not significant. ↩︎
See Chen et al. (1995) for differences in response style, and Chapter 6 of World Happiness Report 2022 for data on regional differences in variables thought to be of special importance in Asian cultures. ↩︎
One slight exception is that the negative effect of corruption is estimated to be slightly larger (0.87 rather than 0.73), although not significantly so, if we include a separate regional variable for Latin America. This is because perceived corruption is worse than average in Latin America and its happiness effects there are offset by stronger close-knit social networks, as described in Rojas (2018). The inclusion of a special Latin American variable thereby permits the corruption coefficient to take a higher value. ↩︎
The donation variable on its own adds more to the explanatory power of the Table 2.1 equation than does an average of the three variables. In a later section of this chapter we use individual-level data to show that each of the three benevolent acts is associated with reported life evaluations, with the donation effect significantly larger than the others. ↩︎
The data are drawn from the Lloyd’s Register Foundation World Risk Poll, included as part of the 2019 round of the Gallup World Poll. The answers were on a three-point scale anchored by ‘not at all likely’ at 0 and very likely at 1. The middle option, ‘somewhat likely’ was coded as 0.5. The same question form and scale were also used to assess negative rather than positive risks, including the risks from violent crime and from mental health problems. This made it possible to compare the subjective wellbeing effects of positive and negative risks evaluated in comparable terms, as will be reported later in the chapter. ↩︎
If we compare the data from countries in the 40-country study (Cohn et al., 2014) we find actual wallet return in the three Nordic countries in the study (Sweden, Denmark and Norway) to be 81%, compared to 47% in the other countries in their global sample. The expected wallet return by strangers (as ranked in Table 2.2) is also much more likely in the Nordic countries, at 47%, than in the other countries, at 28%. Hence, perceptions match reality in that wallet return is higher in the Nordic countries than in other places. Yet, in the Nordic countries and elsewhere, people underestimate the kindness of others, as will be shown later in this chapter. These results are all shown graphically in the first of the online wallet figures. ↩︎
Kenya and Liberia are both near the top of the ranking for volunteering. ↩︎
Reader’s Digest (2023). ↩︎
Cohn et al. (2019). Employees of societal institutions were approached and asked to take the lost object to the next stage on its return to the imaginary owner. ↩︎
See Helliwell and Wang (2011) for the fullest description, and also Helliwell and Aknin (2018) and Helliwell et al. (2019). ↩︎
Rober (2019). He also did sub-experiments to show that the unexpectedly high wallet return rate applied equally to rich and poor, and equally to males and females. ↩︎
Of the 20 cities, 18 were in the United States and 2 in Canada. The expected rate of return for wallets found by strangers is 34% in the US and 39% in Canada. ↩︎
These results are also shown in the second of the online wallet figures. ↩︎
Knack (2001). His analysis was based on the first Reader’s Digest wallet drops, in the late 1990s. ↩︎
The shares of explained variance are given by the r2 on the full set of country fixed effects. These are .206 for police, .125 for neighbours, and .080 for strangers. ↩︎
See Konrath et al. (2011). ↩︎
See Konrath et al. (2023); Sortheix et al. (2019); Yan et al. (2017). ↩︎
Levine et al. (2008). ↩︎
See Hampton (2016) in which the result is based on modelling that controls for differences in average neighbourhood characteristics. It shows a 10% drop in the United States, but no significant change in Canada. In 2001 there was no variation in altruistic behavior based on neighborhood diversity. However, areas of the United States where the proportion of non-citizens increased since 2001 experienced reduced helping; the opposite was found in Canada. ↩︎
Yuan et al. (2022). ↩︎
Smith (2019). ↩︎
Helliwell et al. (2024). ↩︎
See Aydinli et al. (2013) for a more detailed summary. ↩︎
See Chopik et al. (2017). ↩︎
Luria et al. (2015). ↩︎
Our analysis of actual and expected returns uses actual returns from the wallet+money experiments of Cohn et al. (2019) and expected returns from the 2019 Lloyd’s Register Foundation World Risk Poll. Actual return averages 1.83 times expected return. ↩︎
See Knafo et al. (2009). See also Rhoads et al. (2021) for an evaluation of seven kinds of altruism across countries and variation showing higher levels in individualistic countries. ↩︎
See Heine et al., (2002) for challenges in cross-cultural comparisons of subjective Likert scales. ↩︎
See Ju et al. (2025). ↩︎
These declines in the average frequency appear significantly (as indicated by non-overlapping 95% confidence regions) for each of the three benevolent acts as well as the prosocial umbrella variable. Donation frequency was down from 34.6% in 2023 to 31.7% in 2024, while helping strangers fell from 61.4% to 58.8%, and volunteering from 24.2% to 22.9%. The prosocial frequency fell from 73.1% to 70.0%. ↩︎
For prosocial, 70% in 2022–2024 vs 63% 2017–2019. For donations, 31.7% vs 28%. For helping strangers 58.8% vs 50%, and for volunteering 22.9% vs 20%. These differences in means are all highly significant, p<.001. ↩︎
Joshanloo and Bond (2023) use Gallup World Poll data from 2019 to investigate the extent to which religiosity, trust, income and individualism, which vary among countries and cultures, serve to moderate the links between volunteering and life satisfaction. When all moderations considered together, only trust and religiosity appear, both with negative moderating effects (their Model 5). ↩︎
https://globalindices.indianapolis.iu.edu/environment-index/index.html ↩︎
We speak of a significant difference for the regional data if there is no overlap in the 95% confidence levels for the estimate of the 2017–2019 and 2024 means. ↩︎
Aknin and Whillans (2021); Dunn et al. (2014); Ryan and Deci (2000). ↩︎
Aknin et al. (2013); Aknin et al. (2022); Curry et al. (2018); Hui et al. (2020); Joshanloo and Bond (2023); Kushlev et al. (2022). In addition, two chapters in previous World Happiness Reports have considered the joy of giving (Aknin et al., 2019; Rhoads & Marsh, 2023a). ↩︎
Aknin et al. (2012); Song et al. (2020); Yang (2024). ↩︎
See Chapter 4 of this report for more on caring and connection in family settings. ↩︎
Algoe and Haidt (2009); Chancellor et al. (2018). ↩︎
Fowler and Christakis (2010); Jordan et al. (2013); Tsvetkova and Macy (2014). ↩︎
Wheeler et al. (1998). ↩︎
Aknin et al. (2011). ↩︎
Inagaki and Ross (2018). ↩︎
Zhang et al. (2021). ↩︎
Stukas et al. (2016). ↩︎
Konrath et al. (2012). ↩︎
In the psychology literature, relationships in which the primary concern is the person’s welfare and people assist one another without monitoring contributions and/or expectation of reciprocity is called a “communal relationship” (see Clark & Mills, 2012). ↩︎
Gallagher et al. (2022). ↩︎
Chen et al. (2021); Xia et al. (2024). ↩︎
Tham et al. (2024). ↩︎
García-Campayo et al. (2024). Other research also finds that extreme altruists (i.e., individuals who donate organs to strangers) are higher on honesty-humility and general unselfishness (Rhoads et al., 2023; Rhoads & Marsh, 2023b). ↩︎
Crocker and Canevello (2008); Huo et al. (2019). ↩︎
Yin and Wang (2023). ↩︎
Au et al. (2011); Depow et al. (2021); Ironson et al. (2002); Morelli et al. (2015); Peng et al. (2023); Steffen and Masters (2005). ↩︎
Burtson and Stichler (2010); Von Harscher et al. (2018); Waddimba et al. (2021). ↩︎
Ho et al. (2014). ↩︎
Qu et al. (2020). ↩︎
Batson (2011). ↩︎
Das et al. (2023). ↩︎
Le et al. (2013). ↩︎
Canevello and Crocker (2011; 2017); Crocker and Canevello (2008); Crocker et al. (2010). ↩︎
For volunteering: Clary and Snyder (1999); for charitable giving: Konrath and Handy (2018). ↩︎
Veerasamy et al. (2015). ↩︎
Stukas et al. (2016). ↩︎
Poulin (2014). ↩︎
Wiwad and Aknin (2017). ↩︎
Stukas et al. (2016). ↩︎
Konrath et al. (2012); Poulin (2014). ↩︎
Wang et al. (2020). See also Brethel-Haurwitz et al. (2018) for research showing that altruistic kidney donors have a higher pain tolerance than controls. ↩︎
Including those we share meals with, see Chapter 3 in this year’s report. ↩︎
Aknin and Whillans (2021); Dunn et al. (2014); Weinstein and Ryan (2010). ↩︎
Gebauer et al. (2008); Qu et al. (2024). ↩︎
Kim and Morgül (2017); see also work by Rinner et al. (2017) which shows that providing help that is freely chosen predicts greater personal wellbeing, but providing help that is forced predicts lower personal wellbeing. ↩︎
Weinstein and Ryan (2010). ↩︎
Lok and Dunn (2020). ↩︎
Weinstein and Ryan (2010). ↩︎
Ryan and Deci (2000). ↩︎
Jenni and Lowenstein (1997). ↩︎
Lee and Feely (2016); These considerations may also shape how people give to charity; see Chapter 8 for a discussion of how some charities may have a larger positive impact on recipients’ wellbeing. ↩︎
Aknin et al. (2013); see also Martela and Ryan (2016). ↩︎
Switzer et al. (1996). ↩︎
Ballard et al. (2019). ↩︎
The data for the likelihood of wallet return as well as comparably measured negative risks posed by violent crime and poor mental health, are drawn from the Lloyd’s Register Foundation World Risk Poll for 2019. ↩︎
The estimated equation for the Cantril Ladder includes country fixed effects for which the coefficients are not shown. Control variables included in the equation but not shown in the figure are gender, age and age squared, married or living as a couple, separated divorced or widowed, having a health problem, and having a college education. The sample includes 123,050 observations from the 2019 Gallup World Poll supplemented by additional questions asked for the Lloyd’s Register Foundation World Risk Poll. ↩︎
The coefficients are .246 for donations, .100 for helping strangers and .089 for volunteering. ↩︎
To guard against the possibility that this effect would be inflated by the use of individual data for expected wallet return, we have used the data for actual return of wallets in the 40 country sample of Cohn et al. (2019), and find that it adds significantly to the explanation of life evaluations in those countries. The estimated coefficient on the Cohn et al. (2019) return rate for wallets with money is 1.87 (t=4.4). ↩︎
Standardised betas provide another way of comparing the explanatory power of the key variables in the equation. The standardised betas are +0.078 for expected wallet return (t=20.5), +0.048 (t=12.2) for performing all three benevolent acts in the previous month, -0.024 (t=6.5) for believing harm from violent crime very likely, -0.035 (t=9.3) for believing mental health problems very likely, and -0.040 (t=11.5) for being currently unemployed. The wallet return effect explains almost as large a share of total variance as the log of household income at 0.108 (t=23.7) or the five-point scale for self-assessed health, -0.097 (t=26.8) ↩︎
The lower right panel of Figure 2.2 of World Happiness Report 2022 shows that global inequality of wellbeing, not population-weighted, but treating each country with equal weight, increased by about 20% from 2007 to 2019. ↩︎
Figure 2.5 of World Happiness Report 2022 shows inequality converging between the two parts of Europe and generally rising in all other regions. ↩︎
This is shown in Figures 2.3 and 2.4 of World Happiness Report 2023. ↩︎
As measured by the within-country coefficient of variation (COV), within-country inequality has grown from .35 to .44 from 2005–2010 to 2020–2024. ↩︎
As measured by the coefficient of variation (COV) of country level average life evaluations in each of the four time periods. ↩︎
As measured by the r2 of a regression of individual ladder answers on a set of country dummies. ↩︎
See Chapter 7 of this report for a discussion of how trust and life satisfaction predict voting behaviour. ↩︎
Wu and Nugent (2024) do a parallel analysis using Gallup World Poll data, with broadly similar results to those shown here for ESS data. ↩︎
Represented using a seven part Likert scale where 0 is none and 1 is every day. ↩︎
These are the answers, converted to a 0 to 1 scale, to a question about how much others can be trusted, with a zero to 10 scale ranging from not at all to completely. ↩︎
This variable is like that for general social trust, but in this case referring to trust in police. ↩︎
As noted in the online ODA appendix, the two series are highly correlated (0.971) so that the regression results are very similar using the alternative definitions. ↩︎
The untied ODA data are obtained from “DAC7B: Aid (ODA) tying status” in the OECD Data Explorer. ↩︎
Gulrajani and Pudussery (2025). ↩︎
For a meta-analysis, see Gao et al. (2022). For an earlier study with more equivocal findings, see Muñoz Sastre et al. (2003). ↩︎
Toussaint and Friedman (2009). ↩︎
See Mullet et al. (2021). ↩︎