World Happiness, Trust and Social Connections in Times of Crisis
Acknowledgments
The authors are grateful for the financial support of the WHR sponsors and for data from the Gallup World Poll and the Gallup/Meta State of Social Connections study. For much helpful assistance and advice, we are grateful to Lara B. Aknin, Bernardo Andretti, Chris Barrington-Leigh, Tim Besley, Jan-Emmanuel De Neve, Anya Drabkin, Anat Noa Fanti, Dunigan Folk, Rodrigo Furst, Rafael Goldszmidt, Carol Graham, Jon Hall, David Halpern, Nancy Hey, Sarah Jones, Richard Layard, Eden Litt, Joe Marshall, Marwan H. Saleh, Chris McCarty, Tim Ng, Sharon Paculor, Rachel Penrod, Anna Petherick, Julie Ray, Ryan Ritter, Rajesh Srinivasan, Jeffrey D. Sachs, Lance Stevens, and Meik Wiking.
Introduction
By any standard, 2022 was a year of crises, including the continuing COVID-19 pandemic, war in Ukraine, worldwide inflation, and a range of local and global climate emergencies. We thus have more evidence about how life evaluations, trust and social connections together influence the ability of nations, and of the world as a whole, to adapt in the face of crisis. Our main analysis relates to happiness as measured by life evaluations and emotions, how they have evolved in crisis situations, and how lives have been better where trust, benevolence, and supportive social connections have continued to thrive.
In our first section, we present our annual ranking and modelling of national happiness, but in a way slightly different from previous practice. Our key figure 2.1 continues to rank countries by their average life evaluations over the three preceding years, with that average spanning the three COVID-19 years of 2020-2022. That much remains the same. The main change is that this year we have removed the coloured sub-bars showing our attempts to explain the differences we find in national happiness. We introduced these bars in 2013 because readers wanted to know more about some of the likely reasons behind the large differences we find. Over the succeeding years, however, many readers and commentators have thereby been led to think that our ranking somehow reflects an index based on the six variables we use in our modelling. To help correct this false impression, we removed the explanatory bars, leaving the actual life evaluations alone on centre stage. We continue to include horizontal whiskers showing the 95% confidence bands for our national estimates, supplemented this year by showing a measure for each country of the range of rankings within which its own ranking is likely to be. We also continue to present our attempts to explain how and why life evaluations vary among countries and over time. We then present our latest attempts to explain the happiness differences revealed by the wide variations in national life evaluations.
In our second section, we look back once again at the evolution of life evaluations and emotions since Gallup World Poll data first became available in 2005-2006. This year we focus especially on how COVID-19 has affected the distribution of well-being. Has well-being inequality grown or shrunk? Where, and for whom? We divide national populations into their happier and less happy halves to show how the two groups have fared before and during the pandemic. We do this for life evaluations, and for their emotional, social, and material foundations.
In the third section, we document the extent to which trust, benevolence, and social connections have supported well-being in times of crisis. First we add a third year of COVID-19 data to illustrate how much death rate patterns changed in 2022 under the joint influences of Omicron variants, widespread vaccination, and changes in public health measures. Countries where people have confidence in their governments were still able to have lower COVID-19 death tolls in 2022, just as they did in 2020 and 2021.
Next we update our reporting on the extent to which benevolence has increased during COVID-19, finding it still well above pre-pandemic levels.
Then we present data on how the conflict between Ukraine and Russia since 2014, and especially in 2022, is associated with patterns of life evaluations, emotions, trust in governments, and benevolence in both countries.
Finally, we leverage new data from 2022 on the relative importance of positive and negative aspects of the social context. These data show that positive social environments were far more prevalent than loneliness and that gains from increases in positive social connections exceed the well-being costs of additional loneliness, even during COVID-19. These findings help us explain the resilience of life evaluations. While crises impose undoubted costs, they may also expose and even build a sense of shared connections.
Our concluding section provides a summary of our key results.
Measuring and Explaining National Differences in Life Evaluations
Country rankings this year are based on life evaluations in 2020, 2021, and 2022, so all of the observations are drawn from years of high infection and deaths from COVID-19.
Technical Box 1: Measuring Subjective Well-Being
Our measurement of subjective well-being continues to rely on three main well-being indicators: life evaluations, positive emotions, and negative emotions (described in the report as positive and negative affect). Our happiness rankings are based on life evaluations, as the more stable measure of the quality of people’s lives. In World Happiness Report 2023, we continue to pay special attention to specific daily emotions (the components of positive and negative affect) to better track how COVID-19 has altered different aspects of life.
Life evaluations. The Gallup World Poll, which remains the principal source of data in this report, asks respondents to evaluate their current life as a whole using the image of a ladder, with the best possible life for them as a 10 and worst possible as a 0. Each respondent provides a numerical response on this scale, referred to as the Cantril ladder. Typically, around 1,000 responses are gathered annually for each country. Weights are used to construct population-representative national averages for each year in each country. We base our usual happiness rankings on a three-year average of these life evaluations, since the larger sample size enables more precise estimates.
Positive emotions. Positive affect is given by the average of individual yes or no answers about three emotions: laughter, enjoyment, and interest (for details see Technical Box 2).
Negative emotions. Negative affect is given by the average of individual yes or no answers about three emotions: worry, sadness, and anger.
Comparing life evaluations and emotions:
Life evaluations provide the most informative measure for international comparisons because they capture quality of life in a more complete and stable way than do emotional reports based on daily experiences.
Life evaluations differ more between countries than do emotions and are better explained by the widely differing life experiences in different countries. Emotions yesterday are well explained by events of the day being asked about, while life evaluations more closely reflect the circumstances of life as a whole. We show later in the chapter that emotions are significant supports for life evaluations.
Positive emotions are more than twice as frequent (global average of 0.66) as negative emotions (global average of 0.29), even during the three COVID years 2020-2022.
Ranking of Happiness 2020-2022
The country rankings in Figure 2.1 show life evaluations (answers to the Cantril ladder question) for each country, averaged over the years 2020-2022.[1]
The overall length of each country bar represents the average response to the ladder question, which is also shown in numerals. The confidence intervals for each country’s average life evaluation are shown by horizontal whiskers at the right-hand end of each country bar. Confidence intervals for the rank of a country are displayed to the right of each country bar.[2] These ranking ranges are wider where there are many countries with similar averages, and for countries with smaller sample sizes.[3]
In the Statistical Appendix, we show a version of Figure 2.1 that includes colour-coded sub-bars in each country row, representing the extent to which six key variables contribute to explaining life evaluations. These variables (described in more detail in Technical Box 2) are GDP per capita, social support, healthy life expectancy, freedom, generosity, and corruption. As already noted, our happiness rankings are not based on any index of these six factors — the scores are instead based on individuals’ own assessments of their lives, in particular their answers to the single-item Cantril ladder life-evaluation question. We use observed data on the six variables and estimates of their associations with life evaluations to explain the observed variation of life evaluations across countries, much as epidemiologists estimate the extent to which life expectancy is affected by factors such as smoking, exercise, and diet.
Figure 2.1: Country Rankings by Life Evaluations in 2020-2022
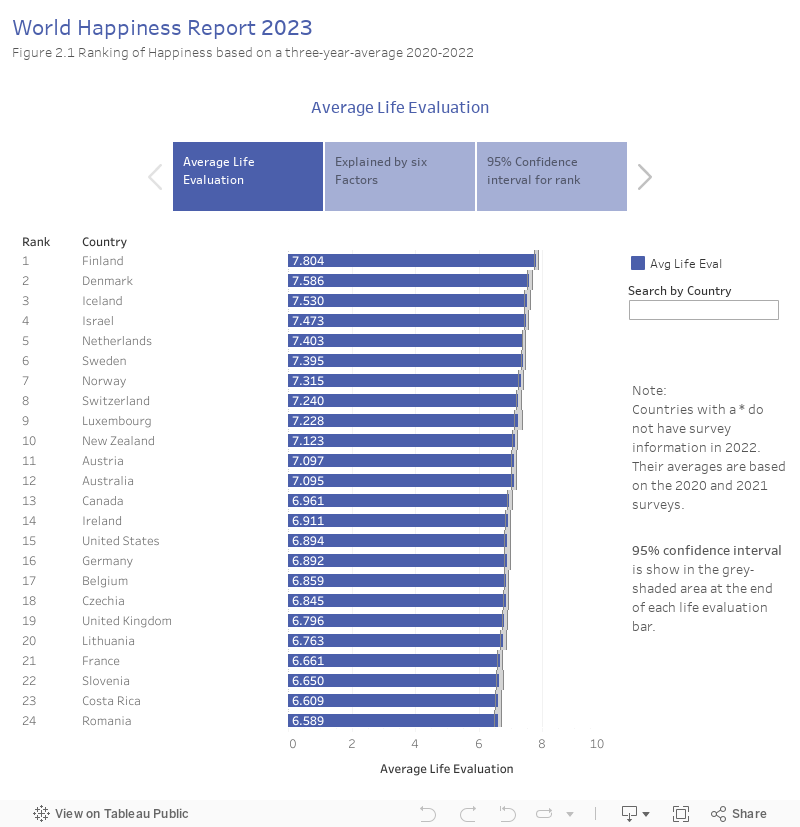
Notes: Those with a * do not have survey information in 2022. Their averages are based on the 2020 and 2021 surveys.
What do the latest data show for the 2020-2022 country rankings?[4]
Two features carry over from previous editions of the World Happiness Report. First, there is still a lot of year-to-year consistency in the way people rate their lives in different countries, and since our rankings are based on a three-year average there is information carried forward from one year to the next (See Figure 1 of Statistical Appendix 1 for individual country trajectories on an annual basis). Finland continues to occupy the top spot, for the sixth year in a row, with a score that is significantly ahead of all other countries. Denmark remains in the 2nd spot, with a confidence region bounded by 2nd and 4th. Among the rest of the countries in the top twenty, the confidence regions for their ranks cover five to ten countries. Iceland is 3rd, and with its smaller sample size, has a confidence region from 2nd to 7th. Israel is in 4th position, up five positions from last year, with a confidence range between 2nd and 8th. The 5th through 8th positions are filled by the Netherlands, Sweden, Norway, and Switzerland. The top ten are rounded out by Luxembourg and New Zealand. Austria and Australia follow in 11th and 12th positions, as last year, both within the likely range of 8th to 16th. They are followed by Canada, up two places from last year’s lowest-ever ranking. The next four positions are filled by Ireland, the United States, Germany, and Belgium, all with ranks securely in the top twenty, as shown by the rank ranges.
The rest of the top 20 include Czechia, the United Kingdom, and Lithuania, 18th to 20th. The same countries tend to appear in the top twenty year after year, with 19 of this year’s top 20 also being there last year. The exception is Lithuania, which has steadily risen over the past six years, from 52nd in 2017 to 20th this year.[5] Throughout the rankings, except at the very top and the very bottom, the three-year average scores are close enough to one another that significant differences are found only between country pairs that are in some cases many positions apart in the rankings. This is shown by the ranking ranges for each country.
There remains a large gap between the top and bottom countries, with the top countries being more tightly grouped than the bottom ones. Within the top group, national life evaluation scores have a gap of 0.40 between the 1st and 5th position, and another 0.28 between 5th and 10th positions. Thus there is a gap of less than 0.7 points between the first and 10th positions.
There is a much bigger range of scores covered by the bottom 10 countries, where the range of scores covers 2.1 points. The range estimates show that Afghanistan in the last position, and Lebanon second last, have ranks significantly different from each other, and from all higher countries. Further up the scale the gaps become narrower, and the ranges larger, with the 95% range exceeding 25 ranks for several countries in the middle of the global list.
Despite the general consistency among the top country scores, there have been many significant changes among the rest of the countries. Looking at changes over the longer term, many countries have exhibited substantial changes in average scores, and hence in country rankings, as shown in more detail in the Statistical Appendix, and as noted above for the Baltic countries.
The scores are based on the resident populations in each country, rather than their citizenship or place of birth. In World Happiness Report 2018 we split the responses between the locally and foreign-born populations in each country and found the happiness rankings to be essentially the same for the two groups. There was some footprint effect after migration, and some tendency for migrants to move to happier countries, so that among the 20 happiest countries in that report, the average happiness for the locally born was about 0.2 points higher than for the foreign-born.
Why do happiness levels differ?
In Table 2.1 we present our latest modelling of national average life evaluations and measures of positive and negative affect (emotions) by country and year.[6] The results in the first column explain national average life evaluations in terms of six key variables: GDP per capita, social support, healthy life expectancy, freedom to make life choices, generosity, and freedom from corruption.[7] Taken together, these six variables explain more than three-quarters of the variation in national annual average ladder scores among countries and years, using data from 2005 through 2022.[8] The six variables were originally chosen as the best available measures of factors established in both experimental and survey data as having significant links to subjective well-being, and especially life evaluations. The explanatory power of the unchanged model has gradually increased as we have added more years to the sample, which is now more than twice as large as when the equation was first introduced in World Happiness Report 2013. We keep looking for possible improvements as sufficient evidence becomes available.[9] Chapter 3 introduces five measures of government effectiveness, all of which are shown to be individually correlated with life evaluations. It is reassuring for the robustness of our Table 2.1 equation that these new measures of government effectiveness contribute importantly (as shown in Chapter 3) to the explanations of the six variables used in Table 2.1, but do not provide additional explanatory power when added to the equation in the first column of Table 2.1.
The second and third columns of Table 2.1 use the same six variables to estimate equations for national averages of positive and negative affect, where both are based on answers about yesterday’s emotional experiences (see Technical Box 2 for how the affect measures are constructed). In general, emotional measures, and especially negative ones, are differently and much less fully explained by the six variables than are life evaluations. Per-capita income and healthy life expectancy have significant effects on life evaluations,[10] but not, in these national average data, on positive affect.[11] But the social variables do have significant effects on both positive and negative emotions. Bearing in mind that positive and negative affect are measured on a 0 to 1 scale, while life evaluations are on a 0 to 10 scale, social support can be seen to have similar proportionate effects on positive and negative emotions as on life evaluations. Freedom and generosity have even larger associations with positive affect than with the Cantril ladder. Negative affect is significantly ameliorated by social support, freedom, and the absence of corruption.
Only at the extremes do country rankings for life evaluations differ significantly from all others- Finland at the top and Afghanistan and Lebanon at the bottom.
In the fourth column, we re-estimate the life evaluation equation from column 1, adding both positive and negative affect to partially implement the Aristotelian presumption that sustained positive emotions are important supports for a good life.[12] The results continue to buttress a finding in psychology that the existence of positive emotions matters much more than the absence of negative ones when predicting either longevity[13] or resistance to the common cold.[14] Consistent with this evidence, we find that positive affect has a large and highly significant impact in the final equation of Table 2.1, while negative affect has none. In a parallel way, we find in the final section of this chapter that the effects of a positive social environment are larger than the effects of loneliness.
As for the coefficients on the other variables in the fourth column, the changes are substantial only on those variables – especially freedom and generosity – that have the largest impacts on positive affect. Thus we can infer that positive emotions play a strong role in supporting life evaluations, and that much of the impact of freedom and generosity on life evaluations is channelled through their influence on positive emotions. That is, freedom and generosity have large impacts on positive affect, which in turn has a major impact on life evaluations. The Gallup World Poll does not have a widely available measure of life purpose to test whether it also would play a strong role in support of high life evaluations.
| Dependent Variable | ||||
|---|---|---|---|---|
| Independent Variable | Cantril Ladder | Positive Affect | Negative Affect | Cantril Ladder |
| Log GDP per capita | 0.359 | -.015 | -.001 | 0.392 |
| (0.067)*** | (0.009) | (0.007) | (0.065)*** | |
| Social support (0-1) | 2.526 | 0.318 | -.337 | 1.865 |
| (0.356)*** | (0.056)*** | (0.046)*** | (0.35)*** | |
| Healthy life expectancy at birth | 0.027 | -.0005 | 0.003 | 0.028 |
| (0.01)*** | (0.001) | (0.001)*** | (0.01)*** | |
| Freedom to make life choices (0-1) | 1.331 | 0.371 | -.090 | 0.505 |
| (0.297)*** | (0.041)*** | (0.039)** | (0.278)* | |
| Generosity | 0.537 | 0.088 | 0.027 | 0.33 |
| (0.256)** | (0.032)*** | (0.027) | (0.245) | |
| Perceptions of corruption (0-1) | -.716 | -.009 | 0.094 | -.712 |
| (0.262)*** | (0.027) | (0.022)*** | (0.249)*** | |
| Positive affect (0-1) | 2.285 | |||
| (0.331)*** | ||||
| Negative affect (0-1) | 0.185 | |||
| (0.388) | ||||
| Year fixed effects | Included | Included | Included | Included |
| Number of countries | 156 | 156 | 156 | 156 |
| Number of observations | 1,964 | 1,959 | 1,963 | 1,958 |
| Adjusted R-squared | 0.757 | 0.439 | 0.334 | 0.782 |
Notes: This is a pooled OLS regression for a tattered panel explaining annual national average Cantril ladder responses from all available surveys from 2005 through 2022. See Technical Box 2 for detailed information about each of the predictors. Coefficients are reported with robust standard errors clustered by country (in parentheses). ***, **, and * indicate significance at the 1, 5, and 10 percent levels respectively.
Technical Box 2: Detailed information about each of the predictors in Table 2.1
GDP per capita is in terms of Purchasing Power Parity (PPP) adjusted to constant 2017 international dollars, taken from the World Development Indicators (WDI) by the World Bank (version 17, metadata last updated on January 22, 2023). See Statistical Appendix 1 for more details. GDP data for 2022 are not yet available, so we extend the GDP time series from 2021 to 2022 using country-specific forecasts of real GDP growth from the OECD Economic Outlook No. 112 (November 2022) or, if missing, from the World Bank’s Global Economic Prospects (last updated: January 10, 2023), after adjustment for population growth. The equation uses the natural log of GDP per capita, as this form fits the data significantly better than GDP per capita.
The time series for healthy life expectancy at birth are constructed based on data from the World Health Organization (WHO) Global Health Observatory data repository, with data available for 2005, 2010, 2015, 2016, and 2019. To match this report’s sample period (2005-2022), interpolation and extrapolation are used. See Statistical Appendix 1 for more details.
Social support is the national average of the binary responses (0=no, 1=yes) to the Gallup World Poll (GWP) question “If you were in trouble, do you have relatives or friends you can count on to help you whenever you need them, or not?”
Freedom to make life choices is the national average of binary responses to the GWP question “Are you satisfied or dissatisfied with your freedom to choose what you do with your life?”
Generosity is the residual of regressing the national average of GWP responses to the donation question “Have you donated money to a charity in the past month?” on log GDP per capita.
Perceptions of corruption are the average of binary answers to two GWP questions: “Is corruption widespread throughout the government or not?” and “Is corruption widespread within businesses or not?” Where data for government corruption are missing, the perception of business corruption is used as the overall corruption-perception measure.
Positive affect is defined as the average of previous-day affect measures for laughter, enjoyment, and interest. The inclusion of interest (first added for World Happiness Report 2022), gives us three components in each of positive and negative affect, and slightly improves the equation fit in column 4. The general form for the affect questions is: Did you experience the following feelings during a lot of the day yesterday? See Statistical Appendix 1 for more details.
Negative affect is defined as the average of previous-day affect measures for worry, sadness, and anger.
The variables we use in our Table 2.1 modelling may be taking credit properly due to other variables, or to unmeasured factors. There are also likely to be vicious or virtuous circles, with two-way linkages among the variables. For example, there is much evidence that those who have happier lives are likely to live longer, and be more trusting, more cooperative, and generally better able to meet life’s demands.[15] This will double back to improve health, income, generosity, corruption, and a sense of freedom. Chapter 4 of this report highlights the importance of two-way linkages between altruism and subjective well-being.
Another possible reason for a cautious interpretation of our results is that some of the data come from the same respondents as the life evaluations and are thus possibly determined by common factors. This is less likely when comparing national averages because individual differences in personality and individual life circumstances tend to average out at the national level. To provide even more assurance that our results are not significantly biased because we are using the same respondents to report life evaluations, social support, freedom, generosity, and corruption, we tested the robustness of our procedure by splitting each country’s respondents randomly into two groups (see Table 10 of Statistical Appendix 1 of World Happiness Report 2018 for more detail). We then examined whether the average values of social support, freedom, generosity, and absence of corruption from one half of the sample explained average life evaluations in the other half of the sample. The coefficients on each of the four variables fell slightly, just as we expected.[16] But the changes were reassuringly small (ranging from 1% to 5%) and were not statistically significant.[17]
Overall, the model explains average life evaluation levels quite well within regions, among regions, and for the world as a whole.[18] On average, the countries of Latin America still have mean life evaluations that are significantly higher (by about 0.5 on the 0 to 10 scale) than predicted by the model. This difference has been attributed to a variety of factors, including some unique features of family and social life in Latin American countries.[19] In partial contrast, the countries of East Asia have average life evaluations below predictions, although only slightly and insignificantly so in our latest results.[20] This has been thought to reflect, at least in part, cultural differences in the way people think about and report on the quality of their lives.[21] It is reassuring that our findings about the relative importance of the six factors are generally unaffected by whether or not we make explicit allowance for these regional differences.[22]
We can now use the model of Table 2.1 to assess the overall effects of COVID-19 on life evaluations. A simple comparison of average life evaluations during 2017-2019 and the pandemic years 2020-2022 shows them to be down slightly (-0.09, t=2.2) in the western industrial countries[23] (for which the 2022 data are complete) and slightly higher than pre-pandemic levels in the rest of the world, where there are fewer available surveys for 2022. Our modelling suggests that the growth of prosociality cushioned the fall of life evaluations in the industrial countries, and made it a net increase in the rest of the world. Thus if we add an indicator for the three COVID years 2020-2022 to our Table 2.1 equation, using data only from the three COVID years and the three preceding years, it shows no net increase or decrease in life evaluations.[24] This suggests, in a preliminary way, that the undoubted pains were offset by increases in the extent to which respondents had been able to discover and share the capacity to care for each other in difficult times. We shall explore other evidence on this point in the next section.
Inequality measured by happiness gaps differs by a full five points between the most equal and the least equal countries.
Inequality of happiness before and during COVID
Last year, we traced the longer-term trends in life evaluations and emotions as part of our review of the first ten years of the World Happiness Report.[25] This year we dig deeper to search for trends in the distribution of well-being. Our main technique is to calculate trends in all these same variables separately for the more and less happy halves of each national population. We are thus able to show in Figure 2.2 the size of the happiness gap between the more and less happy halves of the population, ranking from the smallest to the largest gap. The happiness gap takes the average life evaluation among those above the median response and subtracts the average life evaluation among those below the median, with those exactly at the median split equally across the two halves. A higher ranking in Figure 2.2 means a lower happiness inequality, as measured by the happiness gap[26]
Figure 2.2: Happiness gaps between the top and bottom halves of each country’s population, 2020-2022
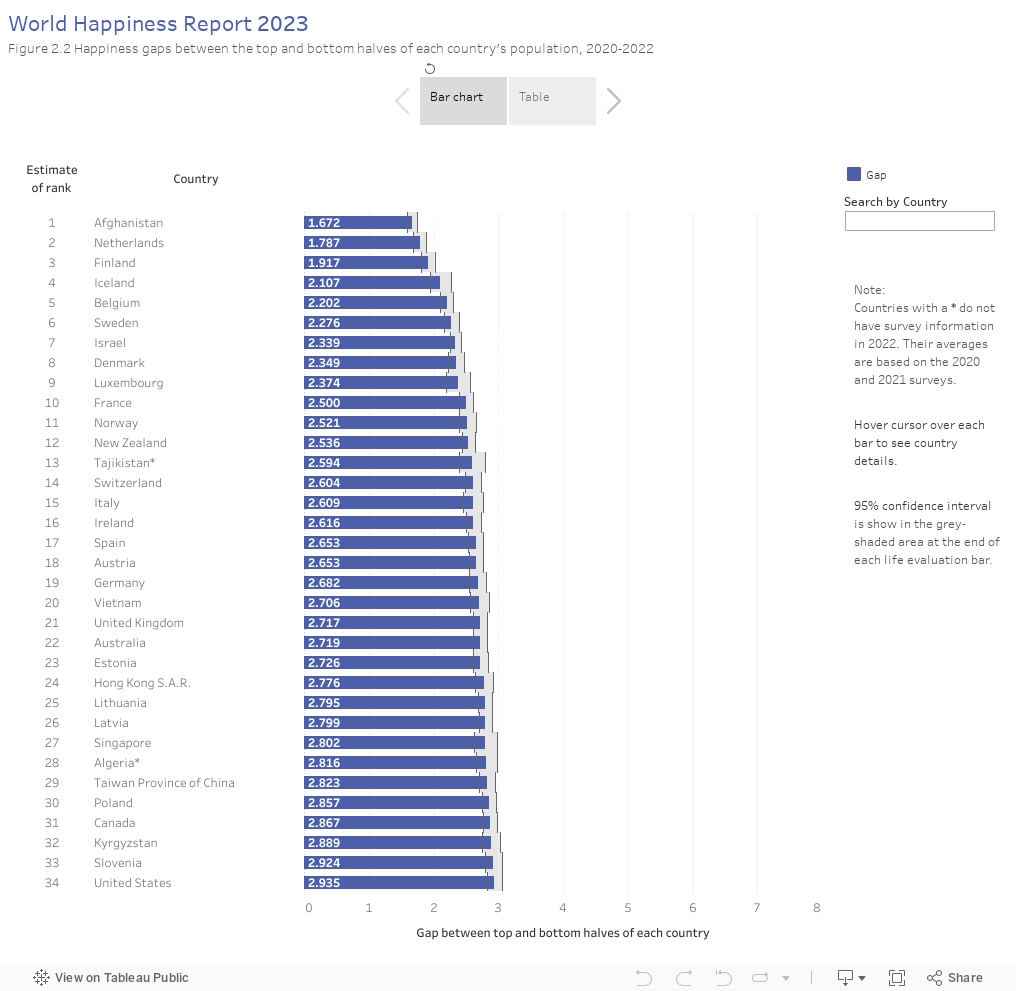
The gap between the mean life evaluation among the top and bottom halves of the distribution has several notable features. First, the gap has a maximum value of 10 and a minimum of zero, sharing the same scale as individual life evaluations. Second, the overall mean life evaluation in a given year is equal to the arithmetic average of the top and bottom half means. This permits the evolution of inequality and mean life evaluations in a region to be shown in the same figure. Third, the gap shows a lot of variation among countries, covering a full five point range between the most and least equal countries.[27]
The equality rankings shown in Figure 2.2 are quite different from the life evaluation rankings shown in Figure 2.1. There is of course a positive correlation in general between the two rankings, since greater equality of well-being is something valued by survey respondents, and hence influences average life evaluations.[28] But there remain substantial differences, since inequality is only one among many factors influencing how people evaluate their lives as a whole. When the rankings in the two figures are compared, there are eighteen countries where the equality ranking is 35 or more ranks below their ladder ranking. At the other extreme, there are another eighteen countries where the equality ranking is 35 or more places above their happiness ranking. The former group, where equality of happiness is lower than indicated by the happiness rank, includes Mexico and all six Central American countries in the rankings, three Persian Gulf states (the United Arab Emirates, Bahrain, and Saudi Arabia), and eight from four other global regions. The contrasting group, where the equality ranking is 35 or more places higher than the ladder ranking, includes Afghanistan and Lebanon, the two least happy countries, where almost everyone is very unhappy, leading to low values for both life evaluations and the gap between the two halves of the population. The group also includes four countries in Southeast Asia, three current or former members of the Commonwealth of Independent States, six African countries, of which three in North Africa, plus Hong Kong, Sri Lanka, and Iran. The 24 WEIRD countries[29] are all located towards the middle of this spectrum, spanning about 40 places, from the most unequal relative to life evaluations (the United States, with an equality gap 19 places below the life evaluations ranking), to Greece at the other end, with an equality ranking of 36 and a life evaluations ranking of 58. The Nordic countries are even more closely aligned, with all having high rankings for both equality and life evaluations.
The Nordic countries all have high ranks for both happiness and equality.
Figure 2.3 has several panels showing global inequality trends for life evaluations, emotions, and other key variables from the outset of the Gallup World Poll in 2005-2006 through 2022. For life evaluations, in panel (a), we present the median response along with the means of happiness in the happier and less happy halves of the population. We also present two measures of the frequency of misery, which we define in two alternative ways. The first is the share of respondents giving answers of 3 and below, while the second is the share giving answers of 4 and below.[30] Growth in either of these shares reflects a general lowering of life evaluations or an increasing concentration of responses at the bottom end of the distribution. The happiness gaps between the two halves of the population provide a good measure of trends in the inequality of well-being, while the misery ratios reveal the extent of very low life evaluations. The overall mean, illustrated as a dashed green line, shows how remarkably resilient global happiness has remained throughout the pandemic.
For emotions, as shown in panels (b) to (d) in Figure 2.3, we pair one positive and one negative emotion in each panel. The fact that all of the positive emotions are more frequent than the negative ones helps to keep the two parts of each panel separate. Even for the less happy half of the population the frequency of each negative emotion is less than the frequency of the corresponding positive emotion.
In panels (e) through (g) we pair one social pillar of well-being and one measure of benevolence in each panel, again contrasting the mean response in the more and less happy halves of the population.[31] The measures of benevolence illustrated by dashed lines in these panels have surged worldwide in the last 3 years—especially helping a stranger. Year after year we have found that generosity is a meaningful predictor of happiness. Our measure of generosity is based on the frequency of charitable donations in a given country, shown in panel (f) (see Technical Box 2). The growth in the broader set of benevolence measures helps explain the resilience of life evaluations during the pandemic. We expand on this theme further in the third section of this chapter.
Fig. 2.3: Global trends for the more and less happy 50% of each country (not population weighted)
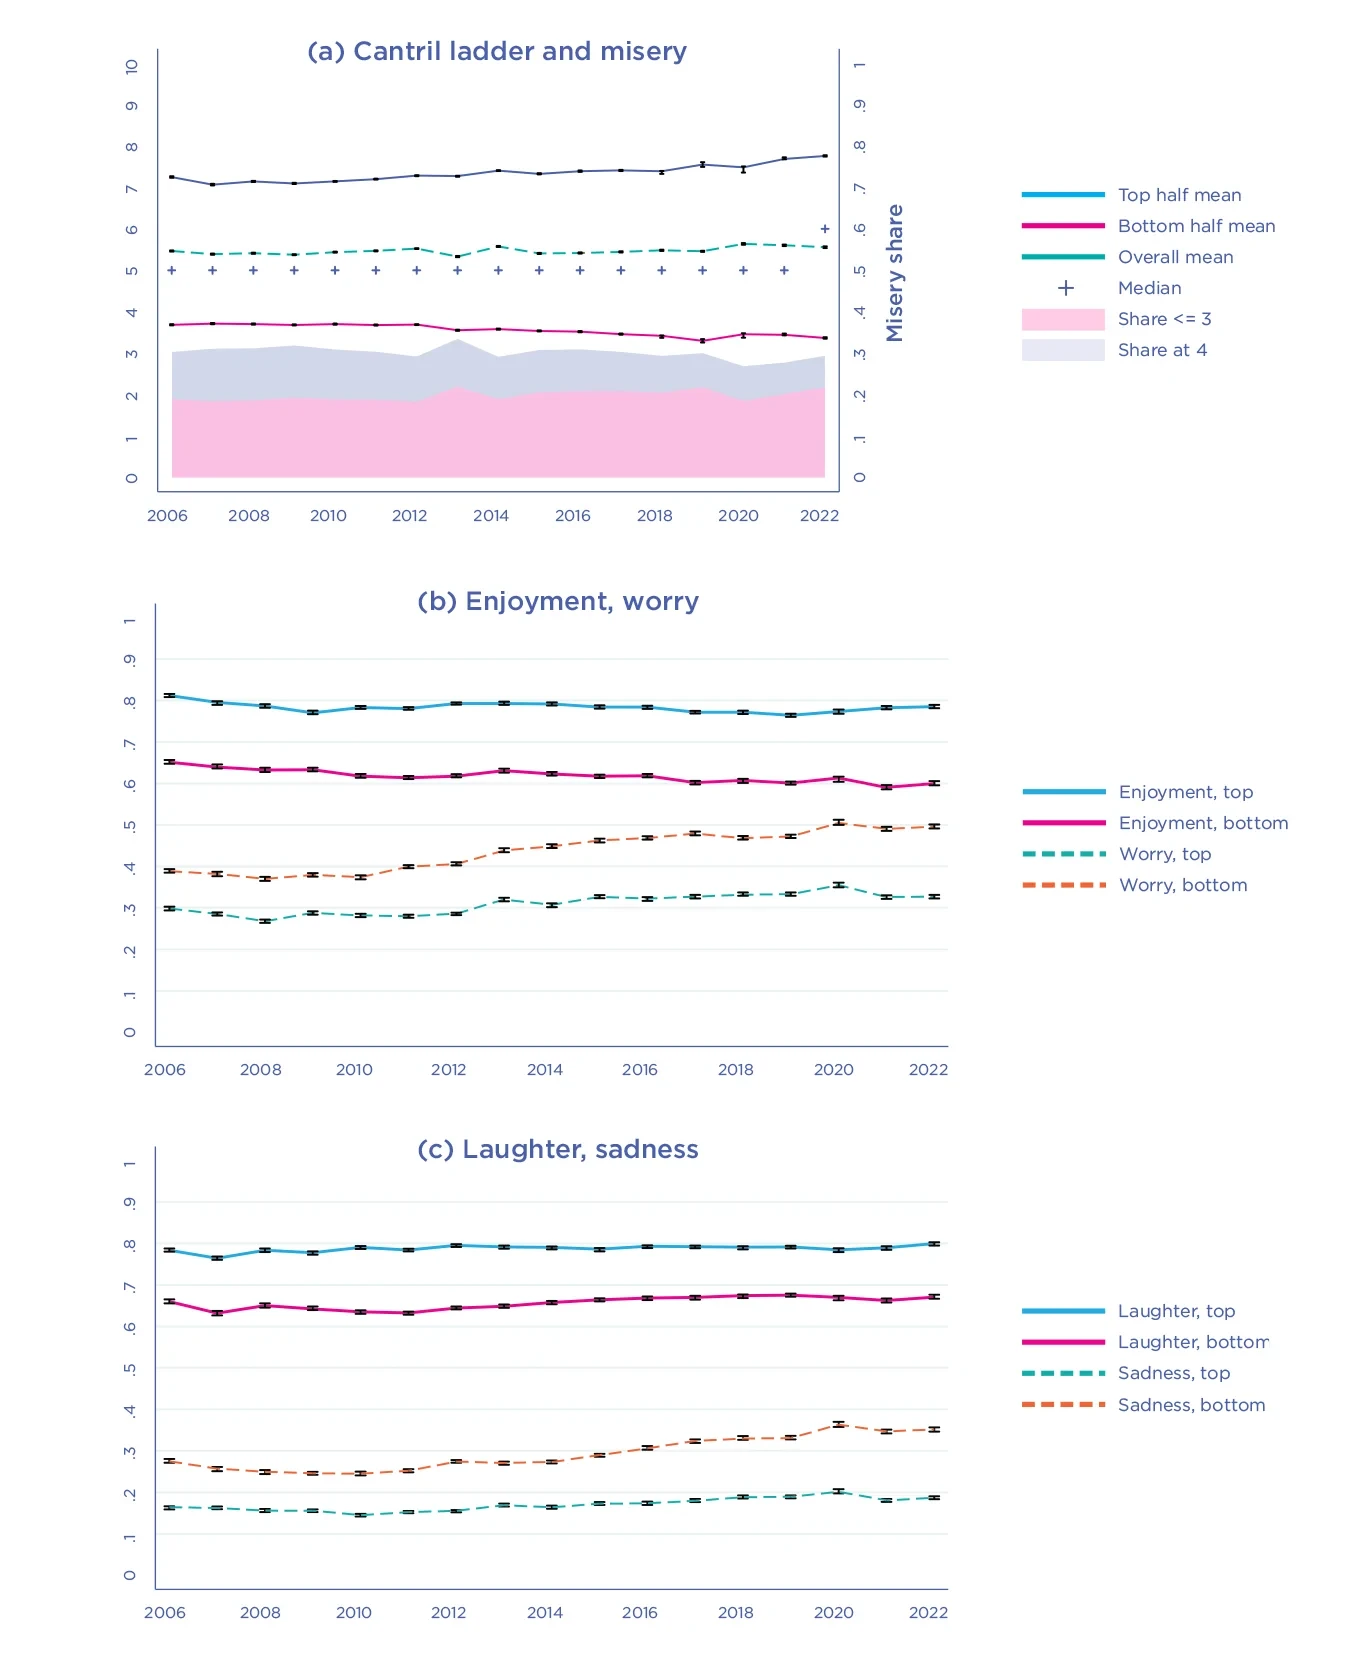
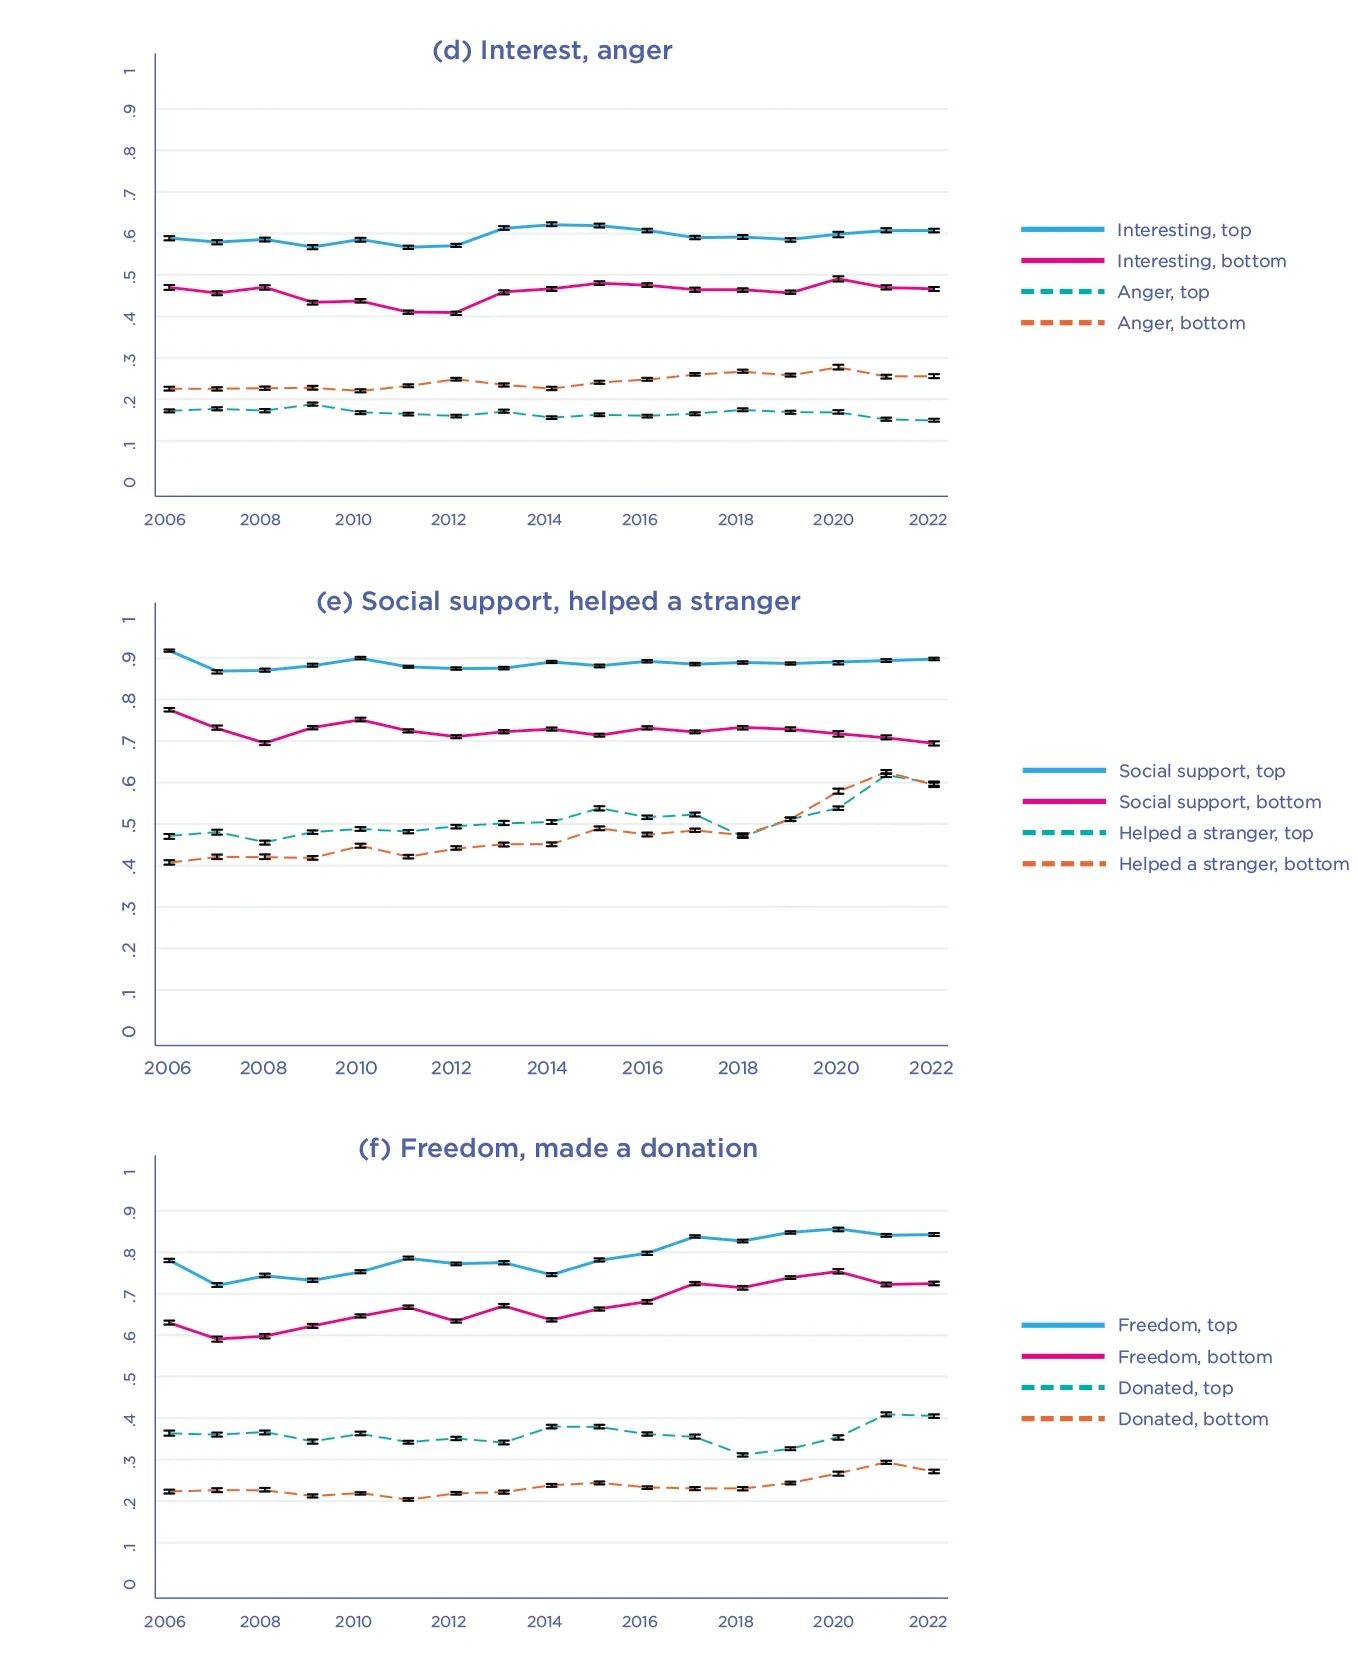
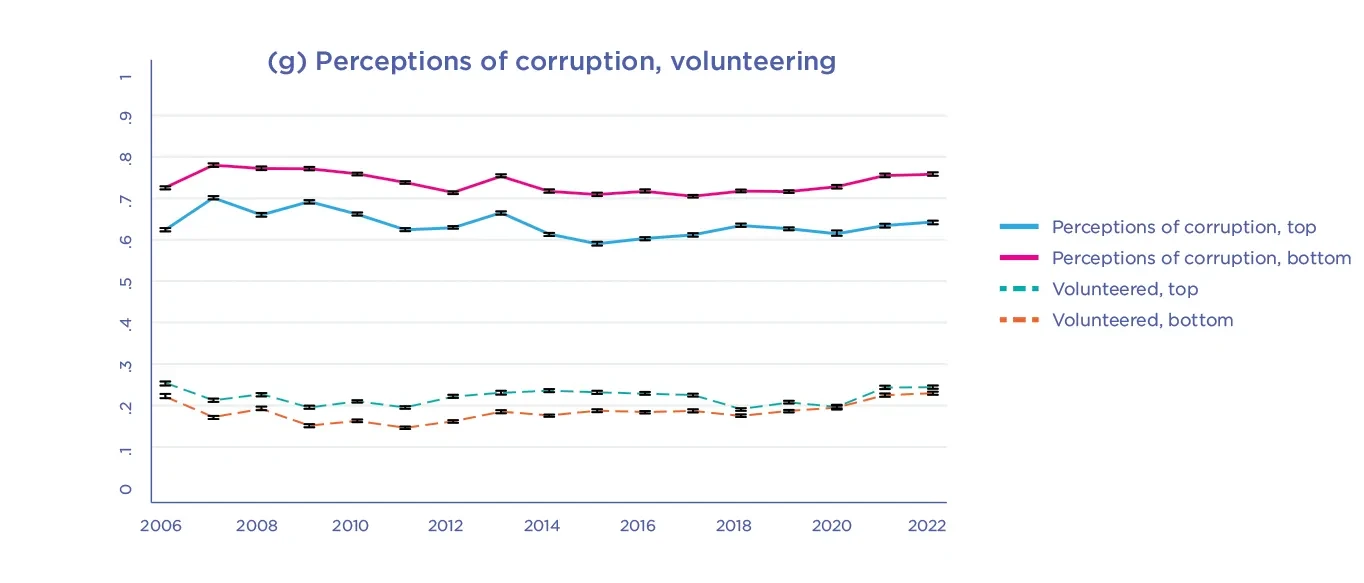
Note: 95% confidence intervals calculated by nonparametric bootstrap (with 200 draws) clustered at the country-year level.
Figure 2.4 disaggregates Figure 2.3 Panel (a) by region to show, for each of ten global regions, the mean life evaluations of the happier 50% and the less happy 50%, and our two measures of misery. The first panels show continued convergence between Western and Eastern Europe, mainly comprising rising life evaluations and falling misery shares in Central and Eastern Europe, with the gaps between the top and bottom halves fairly constant, except for a recent widening of the gap in Western Europe. Among the Asian regions, misery shares have been falling in East Asia, fairly constant in South East Asia and growing in South Asia. Misery shares are lowest in Western Europe and the other group of Western Industrial countries.
There have been numerous studies of how the effects of COVID-19, whether in terms of illness and death or living conditions for the uninfected, have differed among population subgroups. The Gallup World Poll data are not sufficiently fine-grained to separate respondents by their living or working arrangements, but they do provide several ways of testing for different patterns of consequences. In particular, we can separate respondents by age, gender, immigration status, income, unemployment, and general health status. Previous well-being research has shown subjective life evaluations to be lower for those who are unemployed, in poor health, and in the lowest income categories, with the negative effects being less for those living where social trust is perceived to be high (as shown in Figure 2.3 in World Happiness Report 2020). In World Happiness Report 2015, we examined the distribution of life evaluations and emotions by age and gender, finding a widespread but not universal U-shape in age for life evaluations, with those under 30 and over 60 happier than those in between. Female life evaluations, and frequency of negative affect, were generally slightly higher than for males. For immigrants, we found in World Happiness Report 2018 that life evaluations of international migrants tend to move fairly quickly toward the levels of respondents born in the destination country.
Fig. 2.4: Regional trends in life evaluations for the more and less happy halves of each country (population weighted to calculate regional averages)


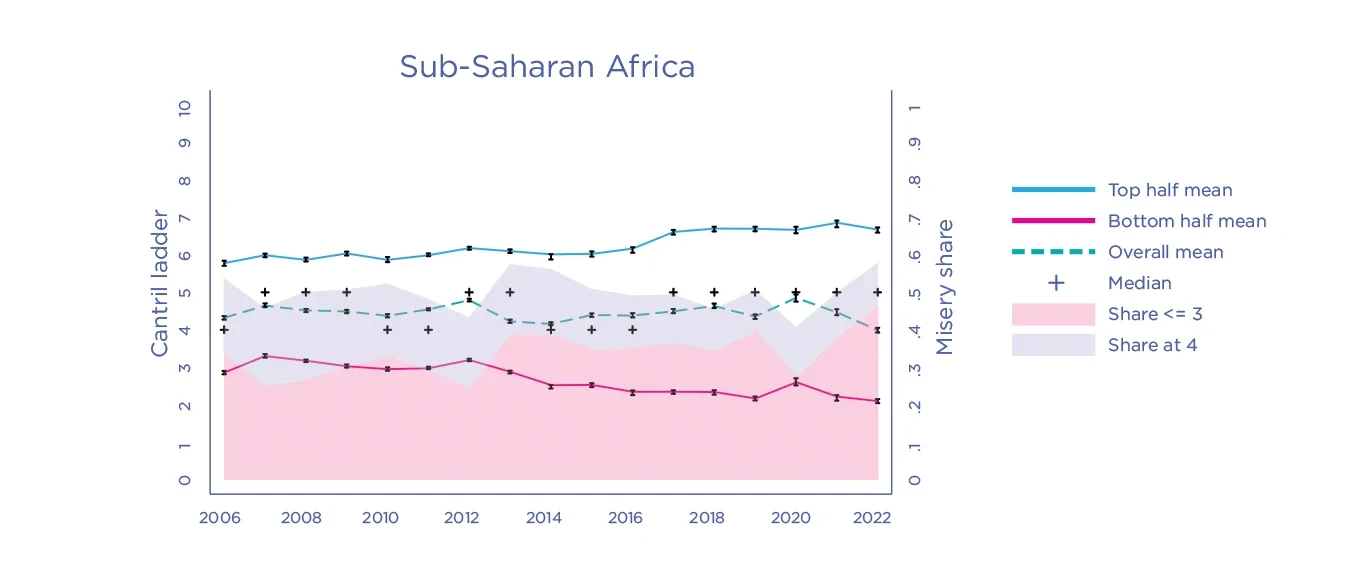
Note: 95% confidence intervals calculated by nonparametric bootstrap (with 200 draws) clustered at the country-year level.
When considering the effects of COVID-19 on equality, it is interesting and important to see how different sub-groups of the population have fared during the pandemic. We did this by estimating an individual-level life evaluation equation using data from more than 560,000 respondents from 2017 through 2022, seeing how pre-pandemic life evaluations (2017-2019) were altered during the three COVID-19 years treated together (2020-2022).[32] As shown in Table 2.2 (where the COVID-19 period effects are shown in the right-hand column) our estimates suggest that COVID-19 tended to continue but not change pre-existing patterns of inequality. Respondents 60 years and older saw COVID-19 era improvements relative to those in the two younger age groups, with a COVID-years increase of 0.105 relative to the middle aged (t=3.7). There was also a significant increase during COVID-19 in the life evaluation gains from having someone to count on in times of trouble (+0.13, t=2.9). Globally, 80% of respondents have someone to count on, so the positive 0.13 COVID-19 interaction effect adds almost one-tenth of a point to average life satisfaction during the pandemic years. We also looked for COVID-19 effects by age, by gender, by gender and age together, by marital status, for the foreign-born, and for those who were unemployed or in ill-health. Despite the large sample size, none of these effects were significant to the 1% level. The only other COVID-19 effect significant at the 5% level or better was health. Those with health problems were approximately 10% more negatively affected by their health problems during the COVID years.[33] This is generally similar to the pattern of results that we found last year for the first two years of COVID-19. Moving to the three-year coverage increased the size and significance of social support and cut the size and eliminated the significance of the unemployment interaction. The general conclusion remains, in the light of three years of pandemic experience, that for the major demographic groups surveyed, the pre-pandemic distributions were unaffected by COVID-19, except as reported above. But it is important to remember that some of those most affected by COVID-19, including the homeless and the institutionalized, are not included in the survey samples.
| Dependent variable: Cantril ladder (0-10) | ||
|---|---|---|
| (1) | ||
| Direct effect | Interaction w/ COVID in same regression (Additional effect 2020-22) | |
| Constant | 1.688*** | 0.115 |
| (0.255) | (0.218) | |
| Log household income | 0.321*** | -0.0315 |
| (0.0262) | (0.0219) | |
| Social support | 0.748*** | 0.131*** |
| (0.0282) | (0.0447) | |
| Unemployed | -0.385*** | -0.0465 |
| (0.0252) | (0.0335) | |
| Freedom to make life choices | 0.485*** | 0.00903 |
| (0.0214) | (0.0320) | |
| College | 0.327*** | -0.0247 |
| (0.0203) | (0.0247) | |
| Married/common-law | -0.0199 | 0.0368 |
| (0.0196) | (0.0266) | |
| Sep., div., wid. | -0.196*** | 0.0245 |
| (0.0273) | (0.0294) | |
| Donation | 0.240*** | -0.00392 |
| (0.0151) | (0.0224) | |
| Foreign-born | -0.0793** | 0.0256 |
| (0.0312) | (0.0328) | |
| Perceptions of corruption | -0.239*** | 0.0352 |
| (0.0281) | (0.0353) | |
| Health problem | -0.459*** | -0.0551** |
| (0.0289) | (0.0250) | |
| Age < 30 | 0.273*** | 0.00528 |
| (0.0305) | (0.0303) | |
| Age 60+ | 0.0688** | 0.105*** |
| (0.0341) | (0.0283) | |
| Female | 0.215*** | -0.00198 |
| (0.0236) | (0.0210) | |
| Age < 30 × female | 0.0171 | -0.00758 |
| (0.0257) | (0.0264) | |
| Age 60+ × female | -0.0730*** | 0.00165 |
| (0.0263) | (0.0291) | |
| Institutional trust | 0.274*** | -0.00267 |
| (0.0211) | (0.0302) | |
| Country fixed effects | Yes | |
| Number of observations | 563,543 | |
| Number of countries | 128 | |
| Adjusted R2 | 0.257 | |
| Root mean squared error | 2.174 | |
Note: Standard errors in parentheses clustered by country. * p<.1, ** p<.05, *** p<.01. Estimates reported in the two columns are from a single regression using individual-level survey data from 2017-2022 using 563,543 respondents from 128 countries. The left column reports the happiness effects of the explanatory variables without COVID-19 influences. The right column shows the extra effects from COVID-19 captured by interactive terms with the indicator variable taking the value 1.0 for all observations in the years 2020-2022.
Should we be sceptical about this relative stability of the distribution of well-being in the face of COVID-19? Is it possible that the relative stability of subjective well-being in the face of the pandemic does not reflect resilience in the face of hardships, but instead suggests that life evaluations are inadequate measures of well-being? In response to this possible scepticism, it is important to remember that subjective life evaluations do change, and by very large amounts, when many key life circumstances change. For example, unemployment, perceived discrimination, and several types of ill-health, have large and sustained influences on measured life evaluations.[34] Perhaps even more convincing is the evidence that the happiness of immigrants tends to move quickly towards the levels and distributions of life evaluations of those born in their new countries of residence, and even towards the life evaluations of others in the specific sub-national regions to which the migrants move.[35] In the next section we shall show that the post-2014 conflict in Ukraine was accompanied by a 2-point increase in the life evaluation gap between Ukraine and Russia. This demonstrates again that life evaluations can indeed shift in the face of material changes.
Further, there is also evidence of increasing levels of pro-social activity during COVID-19, as shown in Figure 2.6 in the next section. As discussed later in Chapter 4 of this report, and in Chapter 2 of World Happiness Report 2022, these increases in benevolence are likely to have cushioned life evaluations during the COVID-19 years.

Trust and benevolence in times of crisis
Many studies of the effects of COVID-19 have emphasized the importance of public trust as a support for successful pandemic responses.[36] We have studied similar linkages in earlier reports dealing with COVID-19 and other national and personal crisis situations. In World Happiness Report 2020, we found that individuals with high social and institutional trust levels were happier than those living in less trusting and trustworthy environments. The benefits of high trust were especially great for those in conditions of adversity, including ill-health, unemployment, low income, discrimination, and unsafe streets.[37] In World Happiness Report 2013, we found that the happiness consequences of the financial crisis of 2007-2008 were smaller in those countries with greater levels of mutual trust. These findings are consistent with a broad range of studies showing that communities with high levels of trust are generally much more resilient in the face of a wide range of crises, including tsunamis,[38] earthquakes,[39] accidents, storms, and floods. Trust and cooperative social norms not only facilitate rapid and cooperative responses, which themselves improve the happiness of citizens, but also demonstrate to people the extent to which others are prepared to do benevolent acts for them and for the community in general. Since this sometimes comes as a surprise, there is a happiness bonus when people get a chance to see the goodness of others in action, and to be of service themselves. Seeing trust in action has been found to lead to post-disaster increases in trust,[40] especially where government responses are considered to be sufficiently timely and effective.[41]
Benevolent acts in 2022 were about one-quarter higher than before the pandemic.
In World Happiness Report 2021 we presented new evidence using the return of lost wallets as a powerful measure of both trust and benevolence. We compared the life satisfaction effects of the expected likelihood of a Gallup World Poll respondent’s lost wallet being returned with the comparably measured likelihood of negative events, such as illness or violent crime. The results were striking, with the expected return of a lost wallet being associated with a life evaluation more than one point higher on the 0 to 10 scale, far higher than the association with any of the negative events assessed by the same respondents.[42]
COVID-19, as the biggest health crisis in more than a century, with unmatched global reach and duration, has provided a correspondingly important test of the power of trust and prosocial behaviour to provide resilience and save lives and livelihoods. Now that we have three years of evidence, we can assess not just the importance of benevolence and trust, but to see how they have fared during the pandemic. The pandemic has been seen by many as creating social and political divisions above and beyond those created by the need to maintain physical distance from loved ones for many months. But some of the evidence noted above shows that large crises can lead to improvements in trust, benevolence, and well-being if they induce people to reach out to help others. This is especially likely if seeing that benevolence comes as a welcome surprise to their neighbours more used to reading of acts of ill-will. Looking to the future, it is important to know whether trust and benevolence have been fostered or destroyed by three years of pandemic. We have not found significant changes in our measures of institutional trust during the pandemic, but did find, as we show below, especially for 2021 and 2022, very large increases in the reported frequency of benevolent acts.
In this section we present several different types of evidence on the importance of trust and benevolence in times of crisis.
First, we update our analysis of COVID-19 death rates to show how the patterns of deaths changed by modelling COVID-19 deaths for 2020 and 2021 combined, and then separately for 2022. This separation enables us to show the great extent to which Omicron variants of COVID-19 have changed the consequences of COVID-19 policy strategies.
Second, we update our measurements of the upsurge of benevolence during COVID-19, showing that the very large increases in 2021 were largely maintained during 2022.
In the third part, we present data on trust, benevolence, and life evaluations in Ukraine and Russia from 2010 to 2022.
Finally, we provide a first look at new data for social connections and loneliness during 2022.
COVID-19: Omicron changed everything except the role of trust
At the core of our original interest in investigating international differences in death rates from COVID-19 was curiosity about the links between variables that support high life evaluations and those that are related to success in keeping death rates low. We found in our two previous World Happiness Reports that institutional and social trust were the only main determinants of subjective well-being that showed a strong carry-forward into success in fighting COVID-19. We are now able to add data for 2022, and thereby show what a different year it has been, with a continued role for institutional trust as almost the only unchanged part of the story. The data for 2022 reveal dramatically how much the combination of Omicron variants, widespread vaccination and changes in policy measures have combined to give a very different international pattern of death rates.
We find continuing evidence that the quality of the social context, which we have previously found so important to explaining life evaluations within and across societies, has also affected progress in fighting COVID-19. Several studies within nations have found that regions with high social capital have been more successful in reducing rates of infection and deaths.[43] Our earlier finding that trust is an important determinant of international differences in COVID-19 death rates has since been confirmed independently for cumulative COVID-19 infection rates extending to September 30, 2021,[44] and we show below that this finding also holds for all of 2021 and for 2022.
We capture these vital trust linkages in two ways. We have a direct measure of trust in public institutions, as described below. We do not have a measure of general trust in others for our large sample of countries, so we make use instead of a measure of income inequality, which has often been found to be a robust predictor of the level of social trust.[45]
Our attempts to explain international differences in COVID-19 death rates divide the explanatory variables into two sets, both of which refer to circumstances likely to have affected a country’s success in battling COVID-19. The first set of variables cover demographic, geographic, and disease exposure circumstances at the beginning of the pandemic. The second set of variables covers several aspects of economic and social structure, also measured before the pandemic, that help to explain the differential success rates of national COVID-19 strategies.
The first set comprises a variable combining the age distribution of each country’s population with the age-specific mortality risks[46] for COVID-19, whether the country is an island, and an exposure index measuring how close a country was in the very early stages of the pandemic (March 31, 2020), to infections in other countries. In World Happiness Report 2022, we used a single measure of the extent to which a country could remember and apply the epidemic control strategies learned during the SARS epidemic of 2003. Countries in the WHO Western Pacific Region were able to build on SARS experiences to develop fast and maintained virus suppression strategies,[47] so we used membership in that region (WHOWPR) as a proxy measure of the likelihood of a country adopting a virus elimination strategy.[48] The trust-related variables include a measure of institutional trust, and the Gini coefficient measuring each country’s income inequality.[49]
The fact that experts and governments in countries distant from the earlier SARS epidemics did not get the message faster about the best COVID-19 response strategy provides eloquent testimony to the power of a “won’t happen here” mindset, illustrated by the death rate impacts of membership of the Western Pacific Region of the WHO, whose members had the most direct experience with the SARS epidemic, and were hence more likely to have learned the relevant lessons.[50] There was very early evidence that COVID-19 was highly infectious, spread by asymptomatic[51] and pre-symptomatic[52] carriers, and subject to aerosol transmission.[53] These characteristics require masks[54] and physical distancing to slow transmission, rapid and widespread testing[55] to identify and eliminate community[56] outbreaks, and effective testing and isolation for those needing to move from one community or country to another. Countries that quickly adopted all these pillar policies were able to drive community transmission to zero. But most countries were not able and willing to remove the virus from community transmission, resulting in the creation of new variants,[57] with the more infectious of them quickly achieving dominance, and rendering ever more difficult the application of a COVID-19 elimination strategy. Omicron led in 2022 to a convergence of death rates, as shown in Panel A of Figure 2.5. Although policy stringency was reduced[58] or removed in all countries, and health authorities largely stopped measuring and reporting the number of infections, death rates were held in check by vaccines and treatments that reduced the frequency of serious illness and deaths.
Previous research covering the first 15 months of the pandemic found that among 15 countries with diverse strategies, the eliminator countries achieved these lower death rates with no net cost in terms of mental health. This was attributed to the timeliness and careful direction of policies resulting in the eliminator countries, on average, requiring less stringent policies.[59] Given the Omicron-induced prevalence of community transmission everywhere in 2022, what can be said about the eventual net national and global benefits of an elimination strategy? Panel B of Figure 2.5 shows that the members of the WHOWPR and the near-eliminator Nordic countries (excluding Sweden) had cumulative COVID-19 deaths for 2020 through 2022 that were significantly below those among the other countries of Western Europe and the rest of the world. If elimination strategies had been quickly enough implemented everywhere, then the genie might have been put back in the bottle and the virus kept out of general circulation. That was the lesson from SARS, where the virus was removed from circulation, and both infections and deaths went quickly to zero. The eliminator countries helped to reduce the space for variants to develop. This global benefit depended on country size, with China as the largest eliminator.[60] But there was clearly enough community spread in the rest of the world to enable the development of variants so transmissible as to make an elimination strategy infeasible everywhere. Now there is a fully global field for the evolution of still further variants, with possibly declining virulence,[61] improved and more widely used vaccines[62] and treatments, better ventilation, and personal hygiene as the main defences available during this new endemic phase.
As expected, the results of our COVID-19 modelling are dramatically different before and after the appearance of Omicron at the end of 2021. Our earlier modelling showed a similar structure for 2020 and 2021. In our new results, we thus combine 2020 and 2021, and compare that to a separate equation for 2022. As shown in Table 2.3, the disappearance of an effective elimination strategy means that there were only two significant variables still in play in 2022. The first is the level of institutional trust, which has retained most of the importance that it had in the first two years of the pandemic. The second is a risk variable based on each country’s age profile, weighted by the estimated age-specific death rates, which are much higher in older populations. To show that these results adequately represent the global population, the results on the right-hand side of the table are weighted by each country’s share of the global population, and produce very similar results, as do estimates making use of estimates of excess deaths from all causes.[63]
| COVID-19 death rate per 100k | One country one vote | Population-weighted | ||||||
|---|---|---|---|---|---|---|---|---|
| (1) | (2) | (3) | (4) | |||||
| VARIABLES | 2020-21 | Std. coef. | 2022 | Std. coef. | 2020-21 | Std. coef. | 2022 | Std. coef. |
| Institutional trust (2017-19) | -220.8*** | -0.321 | -44.67*** | -0.228 | -279.3*** | -0.458 | -71.65*** | -0.461 |
| (38.83) | (11.54) | (39.24) | (12.44) | |||||
| Country is an island | -39.99** | -0.120 | -4.898 | -0.052 | 26.25 | 0.078 | 6.498 | 0.076 |
| (15.51) | (5.824) | (19.53) | (4.314) | |||||
| WHOWPR member | -77.91*** | -0.165 | 15.72 | 0.117 | -110.8*** | -0.479 | -14.05* | -0.238 |
| (29.77) | (13.18) | (14.48) | (7.632) | |||||
| Risk adjusted age profile | -33.35*** | -0.526 | -9.865*** | -0.547 | -37.27*** | -0.564 | -9.707*** | -0.576 |
| (3.773) | (1.235) | (4.540) | (2.269) | |||||
| Exposure to infections in other countries (at Mar 31, 2020) | 30.97*** | 0.295 | 7.196*** | 0.241 | 21.57** | 0.159 | 4.570 | 0.132 |
| (8.477) | (2.587) | (9.467) | (3.452) | |||||
| Gini for income inequality (0-100) | 3.192*** | 0.224 | 0.223 | 0.055 | 4.524*** | 0.307 | 0.177 | 0.047 |
| (0.758) | (0.282) | (1.045) | (0.335) | |||||
| Constant | 107.2** | 48.86*** | 87.22 | 58.27*** | ||||
| (43.54) | (14.00) | (60.46) | (15.80) | |||||
| Number of countries | 154 | 154 | 154 | 154 | ||||
| R-squared | 0.611 | 0.564 | 0.747 | 0.633 | ||||
| Adj. R-squared | 0.595 | 0.546 | 0.736 | 0.618 | ||||
Notes: Robust standard errors are reported in parentheses. ***, **, and * indicate significance at the 1, 5, and 10 percent levels respectively.
Figure 2.5: COVID-19 death rates by world region in different years of the pandemic
Panel B. Total COVID-19 deaths over three years per 100k
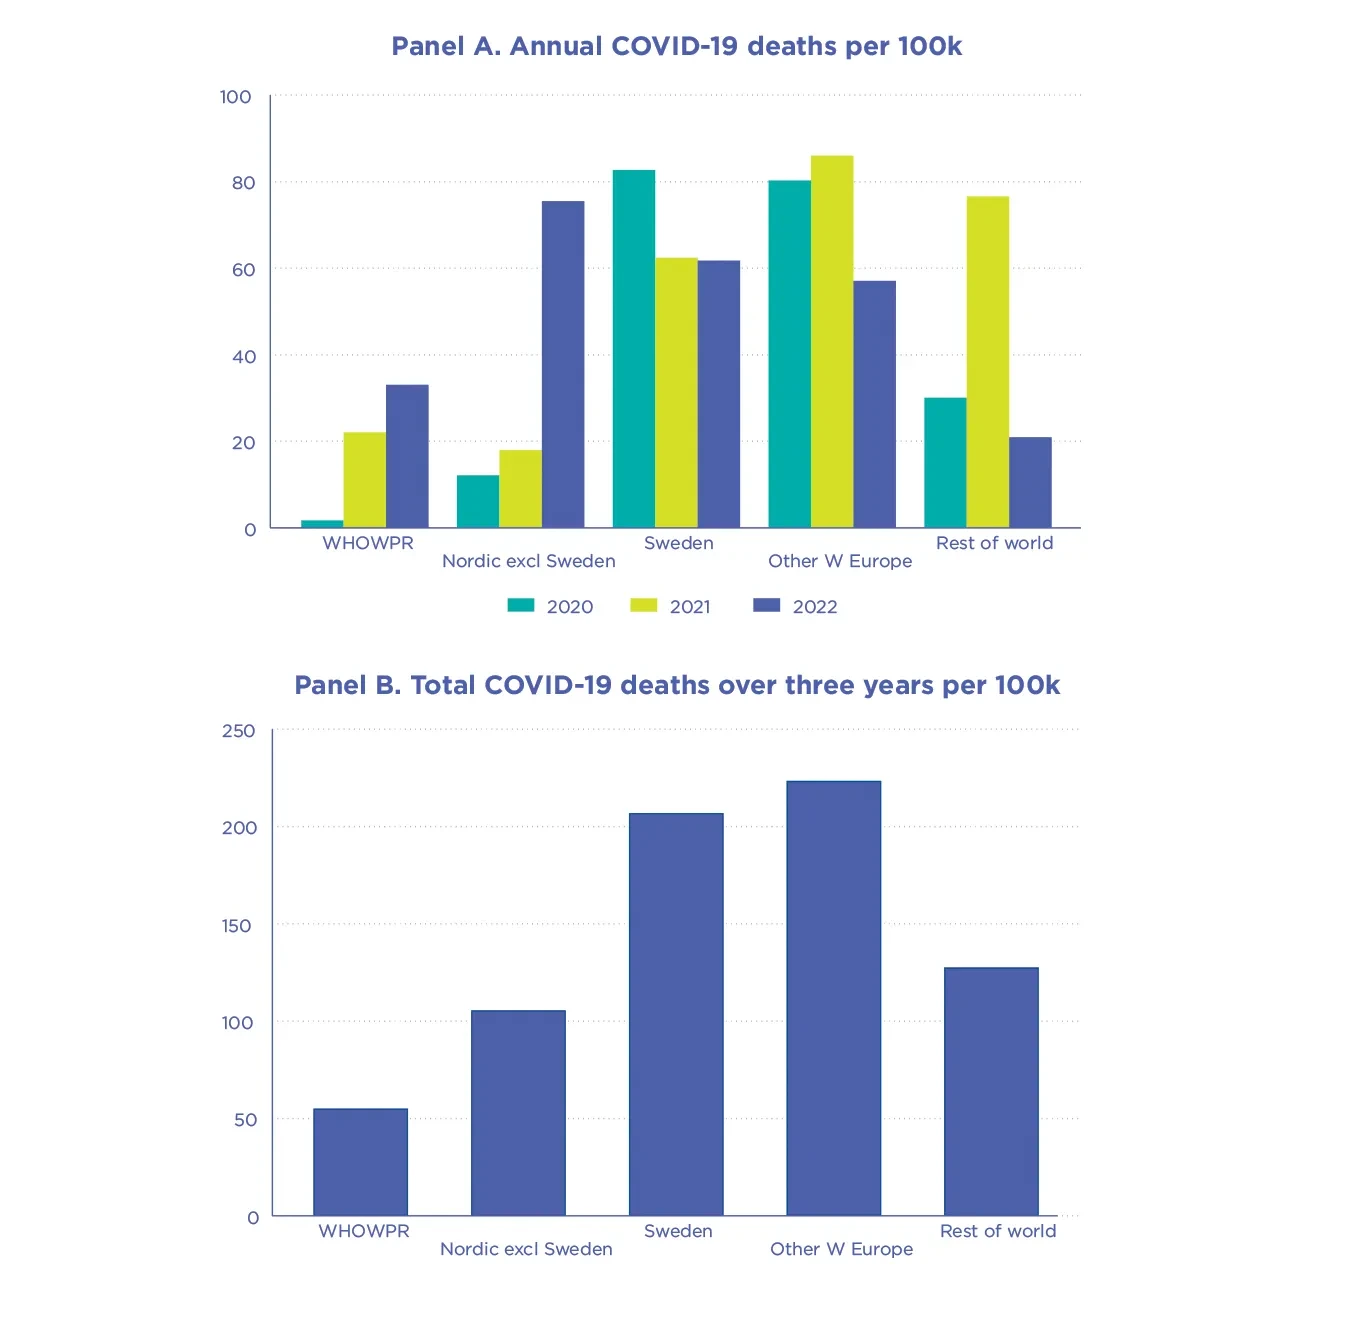
The Nordic countries merit special attention in light of their generally high levels of both personal and institutional trust. They also had COVID-19 death rates only one-third as high as elsewhere in Western Europe during 2020 and 2021, 27 per 100,000 in the Nordic countries compared to 80 in the rest of Western Europe. There is an equally great divide in death rates, but not in trust, when Sweden is compared with the other Nordic countries, as shown in Figure 2.5. This difference shows the importance of a chosen pandemic strategy. Sweden, at the outset, chose[64] not to suppress community transmission, while the other Nordic countries aimed to contain it. As a result, Sweden had much higher death rates in 2020-2021 than the other Nordic countries, while in the end being forced to adopt stringency measures that were on average stricter[65] than in the other Nordic countries. By the end of 2022, however, most countries had similar strategies and similar death rates, reflecting the increasingly endemic nature of the virus.
Growth of benevolence during the pandemic
A striking feature of the benevolence data presented in World Happiness Report 2022 was the sharp increase in the helping of strangers during 2020 and especially 2021, coupled with significant increases in 2021 in both volunteering and donations. Figure 2.6 below now shows these three measures of generosity for each of the three COVID-19 years, in each case compared to the average values 2017-2019. The average of the three measures, labelled ‘prosocial’, is shown by the right-hand set of bars.
Fig 2.6: Percentage of population performing benevolent acts 2020, 2021, and 2022 compared to 2017-2019
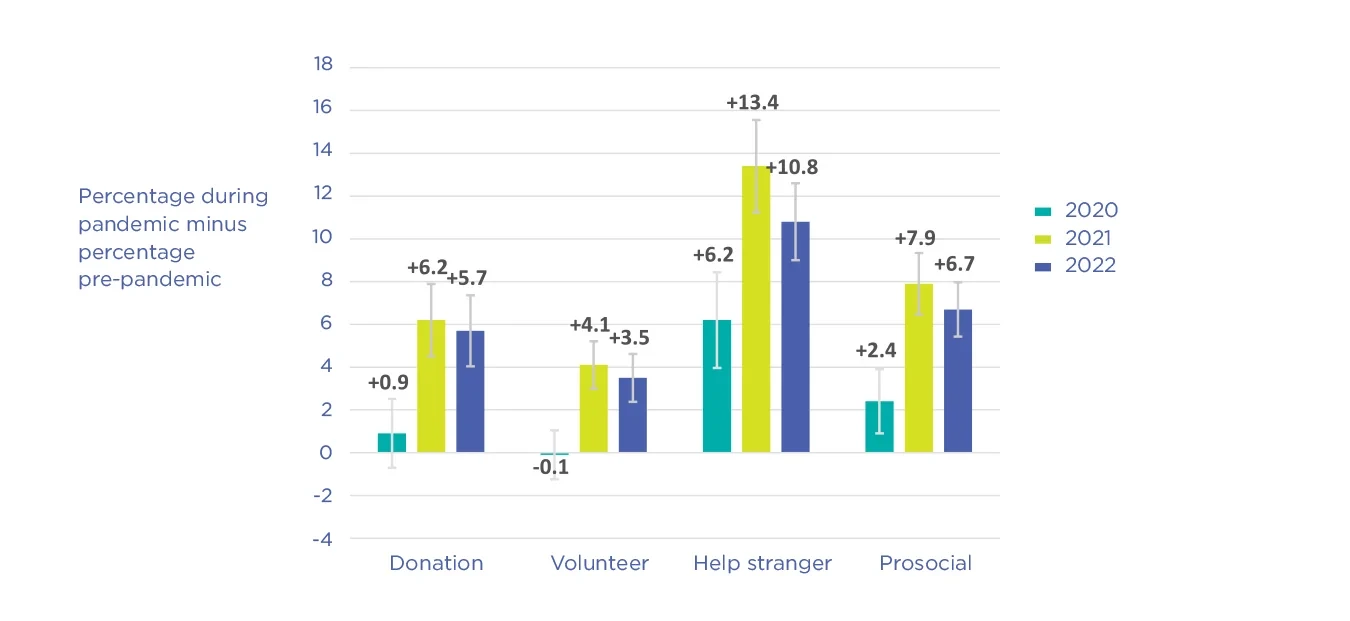
There has been much interest in whether these high levels of benevolence would be maintained in 2022 as the Omicron and other variants gradually shifted COVID-19 from pandemic to endemic status, and many pre-pandemic patterns of life were resumed. Could some part of the 2021 benevolence boost be maintained? The 2022 results in Figure 2.6 show that although benevolent acts have become slightly less frequent than in 2021, they remain significantly higher than pre-pandemic levels, which is the case for all global regions.
There remain some interesting differences among the regions. Before the pandemic, prosociality was significantly higher in Western than in Eastern Europe, averaging 23% in Eastern Europe and 38% in Western Europe. In 2021, prosociality was up by 2% in Western Europe and by 17% in Eastern Europe, erasing the pre-pandemic gap. At the global level, there is a somewhat similar comparison to be made. In 2017-2019 the percentage of the population involved in the selected prosocial acts was 40% in the western industrial countries[66] and 30% in the rest of the world. This gap was substantially closed during the past three years, especially in 2021 and 2022.
Globally, the continued high levels of benevolence likely help to support high happiness,[67] with some added potential for creating a virtuous circle supporting future benevolence.[68]
Ukrainian support for Russia leadership fell to zero in 2020, in all parts of the country.
Ukraine and Russia
Data from the Gallup World Poll permit us to compare life evaluations, trust in governments, emotions and benevolence in Ukraine and Russia from before the annexation of Crimea in 2014 up to and including the Russian invasion of Ukraine in 2022.[69] Crimea has been excluded from all our data because it was not possible to maintain consistent sampling over the past decade.
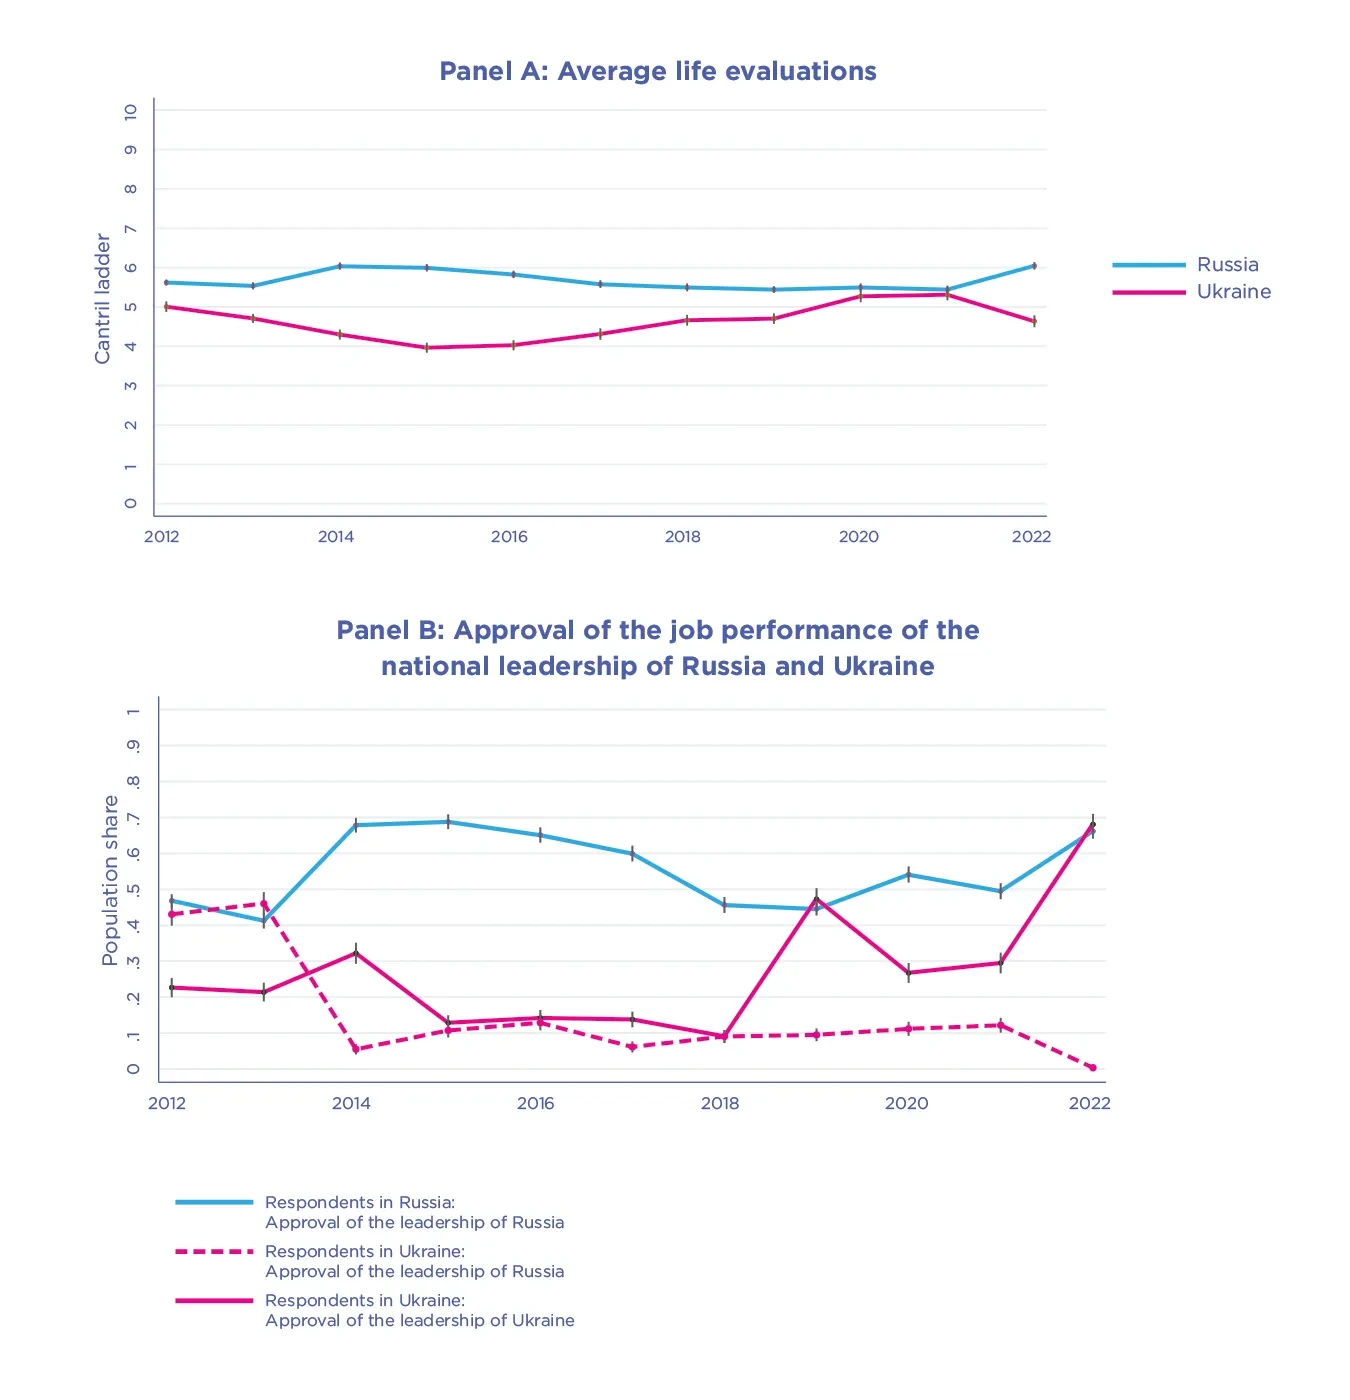
Panel A of Figure 2.7 shows life evaluations in Russia and Ukraine from 2012 through 2022. Life evaluations in Ukraine fell in 2014 by more than a full point on the 0 to 10 scale,[70] while rising by half that much in Russia. This gap gradually narrowed over the rest of the decade, with life evaluations in Ukraine and Russia being the same in 2020 and 2021, subsequent to Zelensky’s election on March 31, 2019. In 2022, life evaluations fell by about three-quarters of a point across Ukraine.
Both the 2014 and the 2022 changes are very large, providing further evidence, should any still be needed, that life evaluations do respond to major changes in the circumstances of life.
Fig 2.7: Trends in Russia and Ukraine from 2012 through 2022
Panel B: Approval of the job performance of the national leadership of Russia and Ukraine
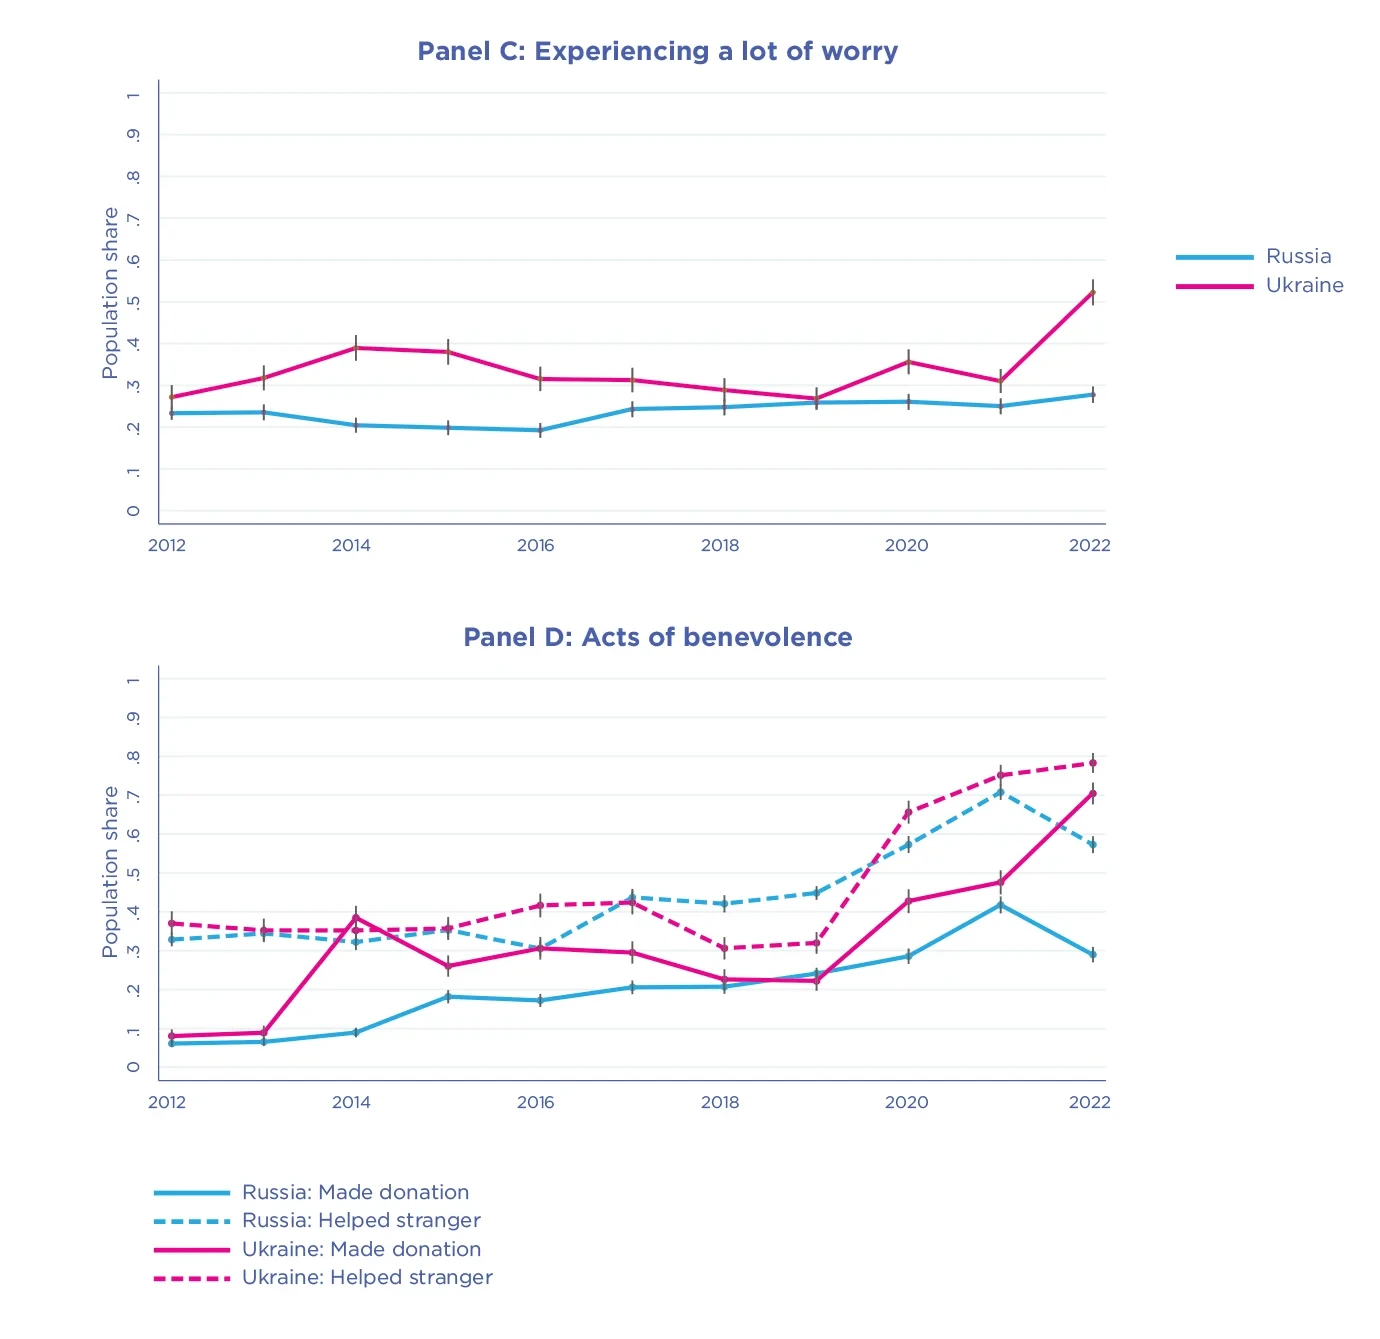
Panel D: Acts of benevolence
Panel B of Figure 2.7 shows approval of each country’s own national leadership, and also the extent to which Ukrainians approved of Russian leadership. The events of 2014 raised Russian evaluations of their country’s leadership, with initially varying effects on Ukrainian evaluations of their national leadership in the different parts of Ukraine. At first, evaluations of the national government were little changed in SE Ukraine[71] while rising sharply elsewhere. In 2015 Ukrainian approval of their national government was down everywhere, while in Russia, approval of the national government remained high in 2015 but then gradually fell. The gap between Russian and Ukrainian evaluations of their own governments closed over the rest of the decade until the election year 2019 when approval ratings rose sharply throughout Ukraine. After falling back somewhat in 2020 and 2021, approval of the national government rose sharply in 2022 in both Ukraine and Russia, but by much more in Ukraine than in Russia, quite different from the 2014 pattern.
Ukrainian approval of Russian leadership fell sharply in 2014 in all parts of the country. This drop was reversed by approximately 10% in the subsequent years before falling essentially to zero in all parts of Ukraine in 2022. Out of 1,000 residents of Ukraine surveyed in September 2022, only two, both in the southeast, approved Russian leadership. That this elimination of any Ukrainian approval of Russian leadership was due to the invasion in March 2022 is confirmed by a Ukrainian survey showing some residual approval of Russian leadership as late as February 2022.[72]
All three negative emotions were more frequent in Ukraine than in Russia in 2014, and again in 2022. The largest increases were for worry, which was experienced by almost 40% of Ukrainian respondents in 2014, and more than 50% in 2022, as shown in Panel C. By contrast, worry was actually less frequent in Russia during the 2014-2016 period, when its frequency was only about half of that in Ukraine. It was also unaffected by the Russian invasion of Ukraine in 2022.
What about benevolent acts in Ukraine and Russia? As shown in panel D of the figure, donations started from an average frequency of 10% in 2013 in both Ukraine and Russia, and in 2014 more than trebled in Ukraine, a far bigger increase than in Russia. Both Ukraine and Russia shared in the general worldwide increase of benevolence during the pandemic years of 2020 and 2021. In 2022, benevolence in Ukraine rose to new record levels, above 70% for both donations and the helping of strangers, while falling significantly in Russia.
Wars are crises that can raise life evaluations if people feel themselves united in a common cause and have trust in their leadership. These factors were more in evidence in Ukraine in 2022 than after 2014. Following the Russian annexation of Crimea in 2014, life evaluations climbed in Russia and fell in Ukraine, with a gap reaching 2 points.[73] This gap was eliminated by 2021, but grew again in 2022, but followed a different pattern. Despite the magnitude of suffering and damage in Ukraine, life evaluations in September 2022 remained higher than in the aftermath of the 2014 annexation, supported by a much stronger sense of common purpose, benevolence and trust in their leadership.
Increased benevolence and trust in government are frequently found in times of crisis, especially if the population is united in a common cause. In the Ukrainian case, both factors[74] helped to limit the overall well-being damage caused by the Russian invasion. Nonetheless, the net effect was to reduce life evaluations by more than two-thirds of a point in Ukraine, as shown in the first panel of Figure 2.7.

New evidence on social connections
In 2022, Gallup, Meta and a group of academic advisors collaborated on the State of Social Connections study, a first-of-its-kind, in-depth look at people’s social connections around the world. The first phase of the study, the State of Social Connections 7-country survey, involved a detailed survey on the quality and quantity of people’s social interactions in a diverse set of seven large countries (Brazil, Egypt, France, Indonesia, India, Mexico, and the United States) spanning six global regions.[75] The resulting data show how connected, socially supported, and lonely people feel in various cultural, economic and technological environments.[76] A second phase of the research, the State of Social Connections Gallup World Poll survey, expanded its global reach by running a select set of the State of Connections study questions on the Gallup World Poll, reaching 140+ countries, and providing the ability to study overall life evaluations and the relative importance of social connections, social support, and loneliness.
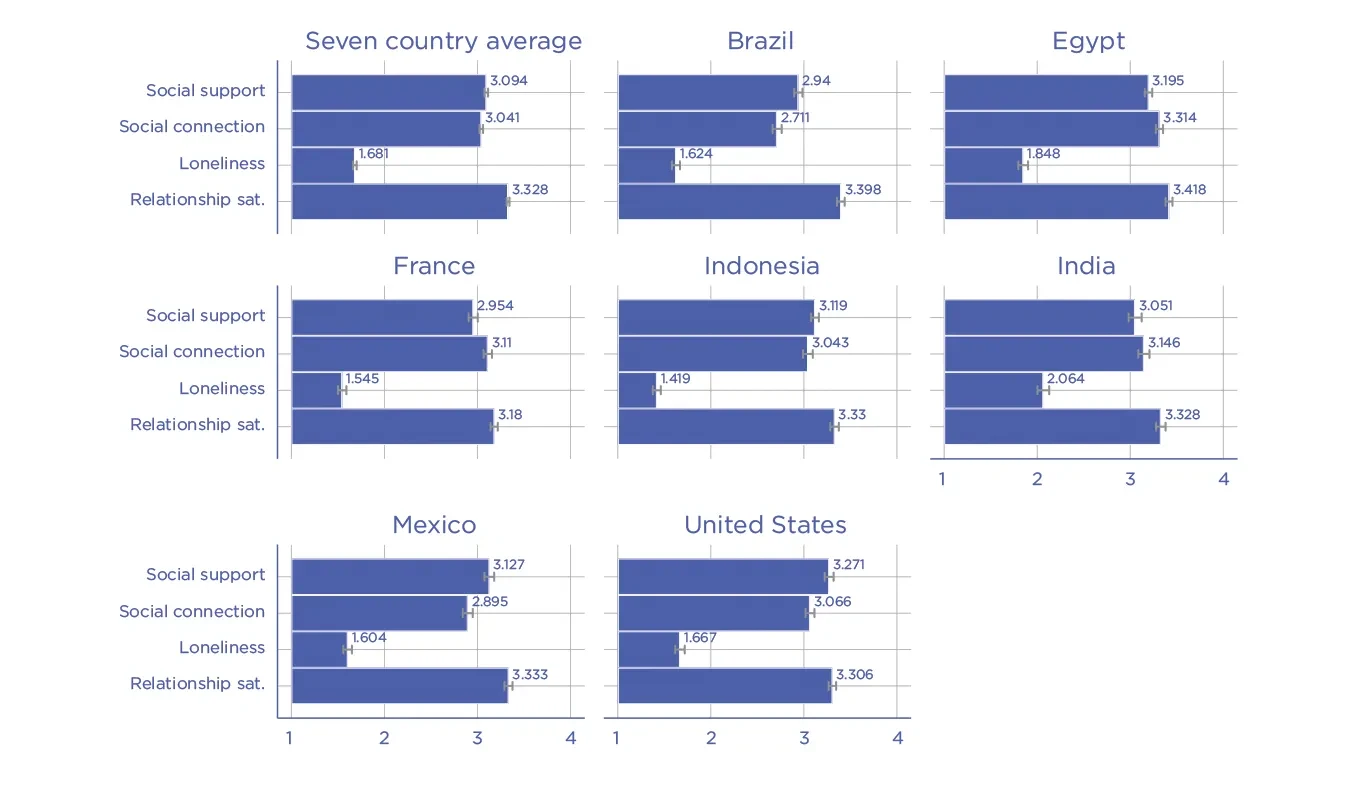
What have we been able to learn from the State of Social Connections 7-country survey? First and perhaps foremost, respondents in all regions reported high levels of social connectedness and social support, generally almost twice as high as reports of loneliness, even during the third year of COVID-19 disruptions to social life. For the 7-countries considered together, using a scale from 1 to 4, where higher numbers indicate more of what is being measured, social connections and social support both average over 3.0, with loneliness less than 1.7. There were relatively small differences among the countries for all three measures, as shown in Figure 2.8.[77] As shown in the bottom bars for each country in Figure 2.8, overall satisfaction with social relationships averaged 3.33 for the seven countries as a group, with the separate national averages all within the range of 3.2 to 3.4.[78] The results were very similar for females and males.
Figure 2.8 Social support, loneliness, and relationship satisfaction in seven countries in 2022
Second, we used data from the State of Social Connections 7-country survey to assess the power of positive social connections to improve self-assessed quality of social relationships. In particular, we compared the effects of positive social connections with the long-recognized adverse effects of loneliness.[79] Although both positive social support and loneliness are important aspects of the quality of the social contexts in which people live, there have previously been few systematic attempts to assess their relative importance, especially on a global basis. Most attention has been focused on loneliness, particularly during the pandemic, with much less attention given to the levels and consequences of positive measures of social support.
What do the results show? As shown in Figure 2.9, and explained in detail in a companion paper,[80] in each of the seven countries the strength of the relationship between the combined measure of social support (equal to the average of the answers to the connectedness and support questions) and overall domain satisfaction was much greater than that between loneliness and social domain satisfaction, even in 2022, the third of three difficult years for social relations.[81]
Figure 2.9: Using loneliness and a combined measure of social connectedness and support to predict relationship satisfaction
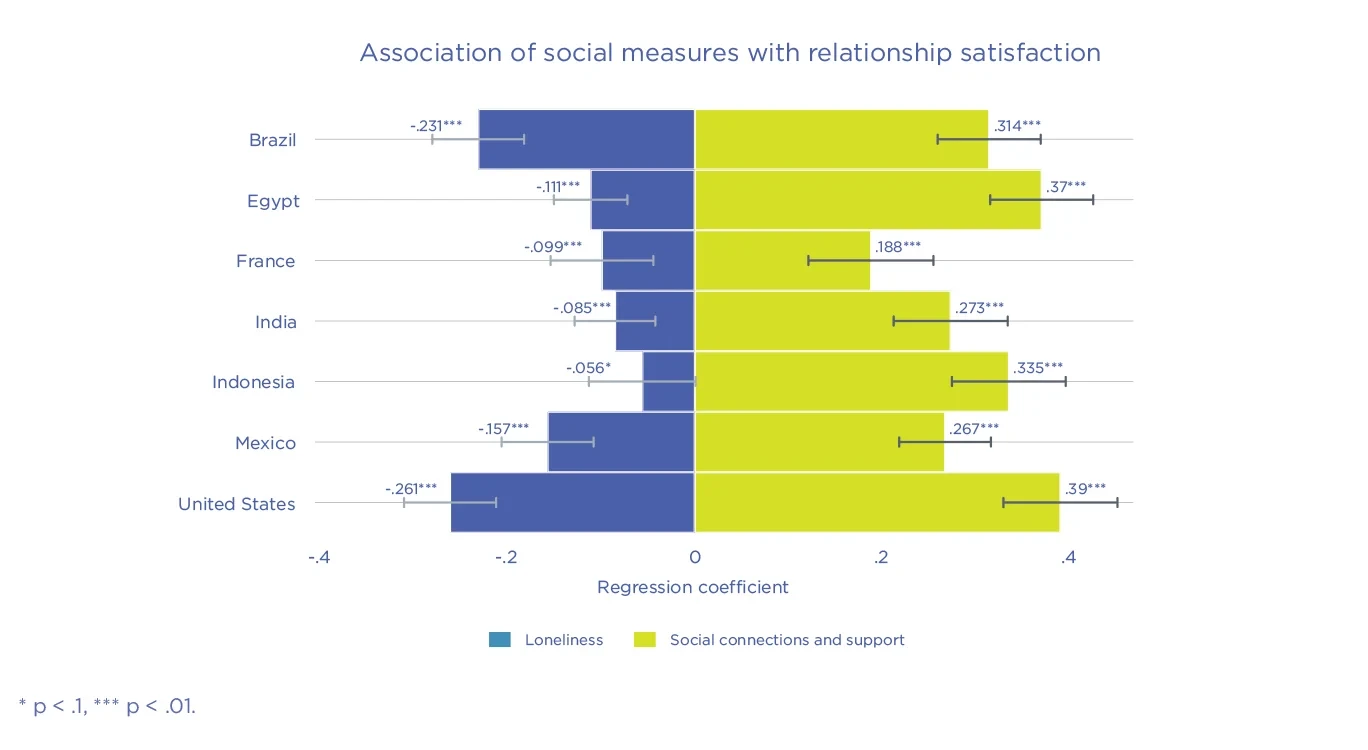
These new data showing that positive social connections and support have larger effects than an important negative factor such as loneliness, help further to explain why life evaluations can remain high even in the face of reported increases in loneliness during the pandemic years.
The Gallup World Poll data for the full set of countries is still being processed, including the set of questions from the State of Social Connections Gallup World Poll survey. However, based on early access to country-level aggregate data for 114 countries, the relative frequency of loneliness is less than that of social support and social connection, as already shown for the State of Social Connections 7-country survey data in Figure 2.8.
We have also been provided with results from pre-registered analyses of the individual level State of Social Connections Gallup World Poll survey data. These analyses allow us to compare results from the State of Social Connections 7-country survey (where relationship satisfaction is used as the outcome) against results from the Gallup World Poll in 114 countries (where well-being is used as the outcome), given that both surveys ask the same questions about social support, connection, and loneliness. To see if the two surveys give consistent data when asked in the same countries, we compared the answers to the three social connections questions in the same seven countries. The results are very reassuring, as for the three survey questions within the seven countries that are common to both the State of Social Connections 7-country and Gallup World Poll surveys, the distributions of responses among the answer options are almost identical.[82] This high comparability of the two surveys makes us confident that any differences we find in the relative power of social connections and loneliness variables when we are comparing the Gallup World Poll and the 7-country survey reflects the use of a different dependent variable.
Figure 2.9 uses relationship satisfaction as the outcome, whereas the Gallup World Poll has the broader Cantril ladder life evaluation used elsewhere in this Chapter but does not have a social domain satisfaction variable. Despite this important change in the dependent variable from domain satisfaction to the broader life evaluation, we find that for more than half of surveyed countries the loneliness and combined social support variables both have statistically significant links to life evaluations at the 10% level, and for most countries the social support effects are larger than those of loneliness. There is some slight evidence also that loneliness may weigh more heavily on life evaluations than on domain satisfaction with social relations. Thus the individual level data from the State of Social Connections Gallup World Poll survey tell a very consistent story with that appearing in the 7-country survey.
Given the larger number of countries, it is interesting to see if these new social variables contribute to explaining cross-national differences in life evaluations. Preliminary evidence suggests that they do have significant explanatory power when considered on their own, but not when added to the Table 2.1 aggregate equation that makes use of a simpler binary social support variable.[83] This encourages continued reliance on the social support variable we have long been using. Within each country, we have found strong evidence that social connections and especially social support are important correlates of well-being, and generally more than is the case for loneliness.

Summary
Life evaluations have continued to be remarkably resilient, with global averages in the COVID-19 years 2020-2022 just as high as those in the pre-pandemic years 2017-2019. Finland remains in the top position, for the sixth year in a row. Lithuania is the only new country in the top twenty, up more than 30 places since 2017. War-torn Afghanistan and Lebanon remain the two unhappiest countries in the survey, with average life evaluations more than five points lower (on a scale running from 0 to 10) than in the ten happiest countries.
This year’s report uses three measures to study the inequality of happiness. The first is the happiness gap between the top and the bottom halves of the population. This gap is small in countries where almost everyone is very unhappy, and in the top countries where almost no one is unhappy. More generally, people are happier living in countries where the happiness gap is smaller. Happiness gaps globally have been fairly stable, although there are growing gaps in Africa. The second and third are measures of misery—the share of the population having life evaluations of 4 and below, and the share rating the lives at 3 and below. Globally, both of these measures fell slightly during the three COVID-19 years.
The rest of the chapter helps to explain this resilience using four examples to suggest how trust and social support can support happiness during crises.
COVID deaths. In 2020 and 2021, countries attempting to suppress community transmission had lower death rates without incurring offsetting costs elsewhere. Not enough countries followed suit, thus enabling new variants to emerge, such that in 2022, Omicron made elimination infeasible. While policy strategies, infections and death rates are now much alike in all countries, our new modelling shows that trust continues to be correlated with lower death rates, and total deaths over the three years are still much lower in the eliminator countries.
Benevolence. One of the striking features of World Happiness Report 2022 was the globe-spanning surge of benevolence in 2020 and especially 2021. Data for 2022 show that prosocial acts are still about one-quarter more frequent than before the pandemic.
Ukraine and Russia. Confidence in their national governments grew in 2022 in both countries, but much more in Ukraine than in Russia. Ukrainian support for Russian leadership fell to zero in all parts of Ukraine in 2022. Both countries shared the global increases in benevolence during 2020 and 2021. During 2022, benevolence grew sharply in Ukraine but fell in Russia. Despite the magnitude of suffering and damage in Ukraine, life evaluations in September 2022 remained higher than in the aftermath of the 2014 annexation, supported by a much stronger sense of common purpose, benevolence and trust in Ukrainian leadership.
Social support. New data show that positive social connections and support in 2022 were twice as prevalent as loneliness in seven key countries spanning six global regions. They were also strongly tied to overall ratings of how satisfied people are with their relationships with other people. The importance of these positive social relations helps further to explain the resilience of life evaluations during times of crisis.
References
Aknin, L. B., Dunn, E. W., & Norton, M. I. (2011). Happiness runs in a circular motion: Evidence for a positive feedback loop between prosocial spending and happiness. Journal of Happiness Studies, 13(2), 347–355.
Aknin, L. B., Andretti, B., Goldszmidt, R., Helliwell, J. F., Petherick, A., De Neve, J. E., .… & Zaki, J. (2022). Policy stringency and mental health during the COVID-19 pandemic: a longitudinal analysis of data from 15 countries. The Lancet Public Health, 7(5), e417–e426.
Aldrich, D. P. (2011). The externalities of strong social capital: Post-tsunami recovery in Southeast India. Journal of Civil Society, 7(1), 81–99.
Bartscher, A. K., Seitz, S., Siegloch, S., Slotwinski, M., & Wehrhöfer, N. (2021). Social capital and the spread of Covid-19: Insights from European countries. Journal of Health Economics, 80, 102531.
Besley, T. & Dray, S., (2021). Institutions, Trust and Responsiveness: Patterns of Government and Private Action During the COVID-19 Pandemic. LSE Public Policy Review, 1(4), p.10. DOI: http://doi.org/10.31389/lseppr.30
Bilalić, M., & McLeod, P. (2014). Why good thoughts block better ones. Scientific American, 310(3), 74–79.
Bloem, J. R., & Oswald, A. J. (2022). The analysis of human feelings: a practical suggestion for a robustness test. Review of Income and Wealth, 68(3), 689-710.
Bond, T. N., & Lang, K. (2019). The sad truth about happiness scales. Journal of Political Economy, 127(4), 1629–1640.
Chen, C., Lee, S. Y., & Stevenson, H. W. (1995). Response style and cross-cultural comparisons of rating scales among East Asian and North American students. Psychological Science, 6(3), 170–175.
Chernozhukov, V., Kasahara, H., & Schrimpf, P. (2021). Causal impact of masks, policies, behavior on early covid-19 pandemic in the US. Journal of Econometrics, 220(1), 23–62.
Claeson, M., & Hanson, S. (2021). The Swedish COVID-19 strategy revisited. The Lancet, 397(10285), 1619.
Cohen, S., Doyle, W. J., Turner, R. B., Alper, C. M., & Skoner, D. P. (2003). Emotional style and susceptibility to the common cold. Psychosomatic Medicine, 65(4), 652-657.
Coupe, T., & Obrizan, M. (2016). The impact of war on happiness: The case of Ukraine. Journal of Economic Behavior & Organization, 132, 228–242.
COVID-19 National Preparedness Collaborative, (2022) Pandemic preparedness and COVID-19: An exploratory analysis of infection and fatality rates, and contextual factors associated with preparedness in 177 countries, from Jan 1, 2020, to Sept 30, 2021. The Lancet, 399(10334), 1489–1512.
Danner, D. D., Snowdon, D. A., & Friesen, W. V. (2001). Positive emotions in early life and longevity: Findings from the nun study. Journal of Personality and Social Psychology, 80(5), 804–813.
De Neve, J. E., Diener, E., Tay, L., & Xuereb, C. (2013). The objective benefits of subjective well-being. In J. F. Helliwell, R. Layard, & J. Sachs (Eds.), World Happiness Report 2013 (pp. 54–79). New York: SDSN.
Dolan, P., Krekel, C., Shreedhar, G., Lee, H., Marshall, C., & Smith, A. (2021). Happy to help: The welfare effects of a nationwide micro-volunteering programme. IZA Discussion Paper 14431.
Doyle, W. J., Gentile, D. A., & Cohen, S. (2006). Emotional style, nasal cytokines, and illness expression after experimental rhinovirus exposure. Brain, Behavior, and Immunity, 20(2), 175-181.
Dussaillant, F., & Guzmán, E. (2014). Trust via disasters: The case of Chile’s 2010 earthquake. Disasters, 38(4), 808–832.
Emery, J. C., Russell, T. W., Liu, Y., Hellewell, J., Pearson, C. A., Knight, G. M., … & Houben, R. M. (2020). The contribution of asymptomatic SARS-CoV-2 infections to transmission on the Diamond Princess cruise ship. Elife, 9, e58699.
Ferrer‐i‐Carbonell, A., & Frijters, P. (2004). How important is methodology for the estimates of the determinants of happiness?. The Economic Journal, 114(497), 641–659.
Folk, D., Helliwell, J.F., Norton, M., & Tov, W. (2023) Comparing the Effects of Loneliness, Social Support, and Social Connections on Relationship Satisfaction in Seven Countries. In preparation.
Fraser, T., & Aldrich, D. P. (2020). Social ties, mobility, and covid-19 spread in Japan. https://assets.researchsquare.com/files/rs-34517/v1/07ba6a97-bafb-44fc-979a-4c4e06519d56.pdf
Fredrickson, B. L. (2001). The role of positive emotions in positive psychology: The broaden-and-build theory of positive emotions. American Psychologist, 56(3), 218–226.
Gallup/Meta (2022). The State of Social Connections study. https://dataforgood.facebook.com/dfg/docs/2022-state-of-social-connections-study
Gandhi, M., Yokoe, D. S., & Havlir, D. V. (2020). Asymptomatic transmission, the Achilles’ heel of current strategies to control COVID-19. The New England Journal of Medicine. April 24 Editorial., 2158–2160.
Godri Pollitt, K. J., Peccia, J., Ko, A. I., Kaminski, N., Dela Cruz, C. S., Nebert, D. W., .… & Vasiliou, V. (2020). COVID-19 vulnerability: the potential impact of genetic susceptibility and airborne transmission. Human Genomics, 14, 1–7.
Goff, L., Helliwell, J. F., & Mayraz, G. (2018). Inequality of subjective well‐being as a comprehensive measure of inequality. Economic Inquiry, 56(4), 2177–2194.
Grimes, A., Jenkins, S. P., & Tranquilli, F. (2023). The relationship between subjective wellbeing and subjective wellbeing inequality: An important role for skewness. Journal of Happiness Studies, 24, 309-330.
Hale, T., Angrist, N., Goldszmidt, R., Kira, B., Petherick, A., Phillips, T., .… & Tatlow, H. (2021). A global panel database of pandemic policies (Oxford COVID-19 Government Response Tracker). Nature human behaviour, 5(4), 529-538.
Helliwell, J. F., & Wang, S. (2011). Trust and well-being. International Journal of Wellbeing, 1(1), 42–78.
Helliwell, J. F., Aknin, L. B., Shiplett, H., Huang, H., & Wang, S. (2018). Social capital and prosocial behavior as sources of well-being. In E. Diener, S. Oishi, & L. Tay (Eds.), Handbook of well-being. (pp. 528–543). Salt Lake City, UT: DEF Publishers. DOI:nobascholar.co
Helliwell, J. F., Shiplett, H., & Bonikowska, A. (2020). Migration as a test of the happiness set‐point hypothesis: Evidence from immigration to Canada and the United Kingdom. Canadian Journal of Economics/Revue canadienne d’économique, 53(4), 1618–1641.
Helliwell, J. F., Norton, M. B., Wang, S., Aknin, L. B., & Huang, H. (2021). Well-being analysis favours a virus-elimination strategy for COVID-19 (No. w29092). National Bureau of Economic Research.
Heuveline, P., & Tzen, M. (2021). Beyond deaths per capita: comparative COVID-19 mortality indicators. BMJ Open, 11(3), e042934.
Holt-Lunstad, J., Smith, T. B., Baker, M., Harris, T., & Stephenson, D. (2015). Loneliness and social isolation as risk factors for mortality: a meta-analytic review. Perspectives on Psychological Science, 10(2), 227–237.
Kaiser, C., & Oswald, A. J. (2022). The scientific value of numerical measures of human feelings. Proceedings of the National Academy of Sciences, 119(42), e2210412119. Chicago
Kang, S. H., & Skidmore, M. (2018). The effects of natural disasters on social trust: Evidence from South Korea. Sustainability, 10(9), 2973.
Kiev International Institute of Sociology (2022) Attitude of the population of Ukraine to Russia and to what the relations between Ukraine and Russia should be, February 2022. Press release February 17, 2022.https://www.kiis.com.ua/?lang=eng&cat=reports&id=1102&page=10
Kislaya, I., Machado, A., Magalhães, S., Rodrigues, A. P., Franco, R., Leite, P. P., .… & Nunes, B. (2022). COVID-19 mRNA vaccine effectiveness (second and first booster dose) against hospitalisation and death during Omicron BA. 5 circulation: cohort study based on electronic health records, Portugal, May to July 2022. Eurosurveillance, 27(37), 2200697.
Krueger, A. B., & Schkade, D. A. (2008). The reliability of subjective well-being measures. Journal of Public Economics, 92(8-9), 1833–1845.
Lavezzo, E., Franchin, E., Ciavarella, C., Cuomo-Dannenburg, G., Barzon, L., Del Vecchio, C., .… & Abate, D. (2020). Suppression of a SARS-CoV-2 outbreak in the Italian municipality of Vo’. Nature, 584 (7821), 425–429.
Leigh-Hunt, N., Bagguley, D., Bash, K., Turner, V., Turnbull, S., Valtorta, N., & Caan, W. (2017). An overview of systematic reviews on the public health consequences of social isolation and loneliness. Public Health, 152, 157–171.
Li, R., Pei, S., Chen, B., Song, Y., Zhang, T., Yang, W., & Shaman, J. (2020). Substantial undocumented infection facilitates the rapid dissemination of novel coronavirus (SARS-CoV-2). Science, 368(6490), 489–493. https://science.sciencemag.org/content/368/6490/489.abstra
Liotta, G., Marazzi, M. C., Orlando, S., & Palombi, L. (2020). Is social connectedness a risk factor for the spreading of COVID-19 among older adults? The Italian paradox. PLOS ONE, 15(5), e0233329. https://journals.plos.org/plosone/article?id=10.1371/journal.pone.0233329
Lorenzo-Redondo, R., Ozer, E. A., & Hultquist, J. F. (2022). Covid-19: Is omicron less lethal than delta?. BMJ, 378, 1806.
Louie, J. K., Scott, H. M., DuBois, A., Sturtz, N., Lu, W., Stoltey, J., .… & Aragon, T. (2021). . Lessons from mass-testing for COVID-19 in long term care facilities for the elderly in San Francisco. Clinical Infectious Diseases, s, 72(11), 2018–2020.
Lyke, K. E., Atmar, R. L., Islas, C. D., Posavad, C. M., Szydlo, D., Chourdhury, R. P., .… & Patel, M. (2022). Rapid decline in vaccine-boosted neutralizing antibodies against SARS-CoV-2 Omicron variant. Cell Reports Medicine, 3(7), 100679.
Ma, A., & Parry, J. (2022). When Hong Kong’s “dynamic zero” covid-19 strategy met omicron, low vaccination rates sent deaths soaring. BMJ, 377, 980.
Mahase, E. (2021) Covid-19: What new variants are emerging and how are they being investigated? BMJ, 372,158 http://dx.doi.org/10.1136/bmj.n158
Miyazawa, D., & Kaneko, G. (2020). Face mask wearing rate predicts country’s COVID-19 death rates. medRxiv.
Moghadas, S. M., Fitzpatrick, M. C., Sah, P., Pandey, A., Shoukat, A., Singer, B. H., & Galvani, A. P. (2020). The implications of silent transmission for the control of COVID-19 outbreaks. Proceedings of the National Academy of Sciences, 117(30), 17513–17515. https://www.pnas.org/content/pnas/117/30/17513.full.pdf
Mogstad, M. Romano J.P., Shaikh, A. & Wilhelm D., (2020). Inference for Ranks with Applications to Mobility across Neighborhoods and Academic Achievement across Countries, NBER Working Papers 26883, National Bureau of Economic Research, Inc .(forthcoming in Review of Economic Studies, 2023).
O’Loughlin, J., Toal, G., & Kolosov, V. (2017). Who identifies with the “Russian World”? Geopolitical attitudes in southeastern Ukraine, Crimea, Abkhazia, South Ossetia, and Transnistria. Eurasian Geography and Economics, 57(6), 745–778.
Ollila, H. M., Partinen, M., Koskela, J., Savolainen, R., Rotkirch, A., & Laine, L. T. (2020). Face masks prevent transmission of respiratory diseases: a meta-analysis of randomized controlled trials. medRxiv.
Osiichuk, M., & Shepotylo, O. (2020). Conflict and well-being of civilians: The case of the Russian-Ukrainian hybrid war. Economic Systems, 44(1), 100736.
Ray, J. (2022) Ukrainians denounce Russia, pivot towards US. https://news.gallup.com/poll/403490/ukrainians-denounce-kremlin-pivot.aspx
Ray, J. & Esipova, N.(2014) Ukrainians seek stability after Crimean crisis. https://news.gallup.com/poll/180209/ukrainians-seek-stability-crimean-crisis.aspx
Rojas, M. (2018). Happiness in Latin America has social foundations. In J. F. Helliwell, R. Layard, & J. Sachs (Eds.), World happiness report 2018 (pp. 114–145). New York: SDSN.
Rosella, L. C., Wilson, K., Crowcroft, N. S., Chu, A., Upshur, R., Willison, D., .… & Goel, V. (2013). Pandemic H1N1 in Canada and the use of evidence in developing public health policies–a policy analysis. Social Science & Medicine, 83, 1–9.
Rothstein, B., & Uslaner, E. M. (2005). All for all: Equality, corruption, and social trust. World Politics., 58(1), 41–72.
Savvides, C., & Siegel, R. (2020). Asymptomatic and presymptomatic transmission of SARS-CoV-2: A systematic review. medRxiv. Doi: 10.1101/2020.06.11.20129072
Setti, L., Passarini, F., De Gennaro, G., Barbieri, P., Perrone, M. G., Borelli, M., .… & Miani, A. (2020). Airborne transmission route of COVID-19: Why 2 meters/6 feet of inter-personal distance could not be enough. International Journal of Environmental Research and Public Health, 17(8), 2932.
Tamilina, L. (2022). Key Features and Factors behind Social Trust Formation in Ukraine. East European Politics and Societies, 08883254221115303.
Toya, H., & Skidmore, M. (2014). Do natural disasters enhance societal trust?. Kyklos, 67(2), 255–279.
Wang, J., & Du, G. (2020). COVID-19 may transmit through aerosol. Irish Journal of Medical Science, 189(4), 1143–1144.
Wang, C., Liu, B., Zhang, S., Huang, N., Zhao, T., Lu, Q. B., & Cui, F. (2022). Differences in incidence and fatality of COVID‐19 by SARS‐CoV‐2 Omicron variant versus Delta variant in relation to vaccine coverage: A world‐wide review. Journal of Medical Virology, 95(1), e28118.
Wei, W. E., Li, Z., Chiew, C. J., Yong, S. E., Toh, M. P., & Lee, V. J. (2020). Presymptomatic Transmission of SARS-CoV-2—Singapore, January 23–March 16, 2020. Morbidity and Mortality Weekly Report, 69(14), 411.
World Health Organization (2017) Asia Pacific strategy for emerging diseases and public health emergencies (APSED III): advancing implementation of the International Health Regulations (2005): working together towards health security https://iris.wpro.who.int/bitstream/handle/10665.1/13654/9789290618171-eng.pdf
Wu, C. (2021). Social capital and COVID-19: a multidimensional and multilevel approach. Chinese Sociological Review, 53(1), 27–54. https://www.tandfonline.com/doi/pdf/10.1080/21620555.2020.1814139
Yamamura, E., Tsutsui, Y., Yamane, C., Yamane, S., & Powdthavee, N. (2015). Trust and happiness: Comparative study before and after the Great East Japan Earthquake. Social Indicators Research, 123(3), 919–935.
Yu, X., & Yang, R. (2020). COVID‐19 transmission through asymptomatic carriers is a challenge to containment. Influenza and Other Respiratory Viruses, 14(4), 474–475.
Yu, H., Cai, J., Deng, X., Yang, J., Sun, K., Liu, H., .… & Ajelli, M. (2022). Projecting the impact of the introduction of SARS-CoV-2 Omicron variant in China in the context of waning immunity after vaccination. DOI: 10.21203/rs.3.rs-1478539/v1
Endnotes
A country’s average answer to the Cantril ladder question is exactly equivalent to a notion of average underlying satisfaction with life under an assumption of “cardinality:” the idea that the difference between a 4 and a 3 should count the same as the difference between a 3 and a 2, and be comparable across individuals. Some social scientists argue that too little is known about how people choose their answer to the Cantril ladder question to make this assumption and that if it is wrong enough, then rankings based on average survey responses could differ from rankings based on underlying satisfaction with life (Bond & Lang, 2019). Other researchers have concluded that answers to the Cantril ladder question are indeed approximately cardinal (Bloem & Oswald, 2022; Ferrer-i-Carbonell & Frijters, 2004; Kaiser & Oswald, 2022; Krueger & Schkade, 2008). ↩︎
For any pair of countries, the confidence intervals for the *means (*depicted in Figure 2.1 as whiskers) can be used to gauge which country’s mean is higher than the other, accounting for statistical uncertainty in the measurement of each. The confidence interval for a country’s rank (given in Figure 2.1 as text) represents a range of possible values for the ranking of their mean among all countries, accounting for uncertainty in the measurement of all of the means (following Mogstad et al., 2020). The ranges are constructed so that the chance that the range does not contain the country’s true rank is no more than 5%. ↩︎
Not every country has a survey every year. The total sample sizes are reported in Statistical Appendix 1, and are reflected in Figure 2.1 by the size of the 95% confidence intervals for the mean, indicated by horizontal lines. The confidence intervals are naturally tighter for countries with larger samples. ↩︎
Countries marked with an * do not have survey information in 2022. Their averages are based on the 2020 and/or 2021 surveys. ↩︎
This can be seen as part of a more general Baltic phenomenon. The increase in Estonia’s rank was even larger, from 66th in 2017 to 31st in 2023. Latvia’s increase was also significant, but smaller, from 54th in 2017 to 41st in 2023. These increases reflect the general increases in life evaluations in Central and Eastern Europe shown in Figure 2.3, with the Baltic countries converging faster than average toward Western European levels. ↩︎
The statistical appendix contains alternative forms without year effects (Appendix Table 9), and a repeat version of the Table 2.1 equation showing the estimated year effects (Appendix Table 8). These results continue to confirm that inclusion of the year effects makes no significant difference to any of the coefficients. In these aggregate equations, adding regional or country fixed effects would lower the coefficients on relatively slow moving variables where most of the variance is across countries rather than over time, such as healthy life expectancy and the log of GDP. With equations based on individual observations, such as in Table 2.2 of World Happiness Report 2022, where income and health are measured by individual-level variables, adding country fixed effects makes little difference to any of the coefficients. ↩︎
The definitions of the variables are shown in Technical Box 2, with additional detail in the online data appendix. ↩︎
The model’s predictive power is little changed if the year fixed effects in the model are removed, with adjusted R-squared falling only from 0.757 to 0.752. ↩︎
For example, unemployment responses at the individual level are available in most waves of the Gallup World Poll. While they show an effect size similar to that found in other research, the coefficient has never been significant, and its inclusion does not influence the size of the other coefficients. ↩︎
Below, we use the term “effect” when describing the coefficients in these regressions; some caveats to this interpretation are discussed later in this section. ↩︎
In the equation for negative affect, healthy life expectancy takes a significant positive coefficient, despite its positive simple correlation with life evaluations in this aggregate dataset. ↩︎
This influence may be direct, as many have found, e.g. De Neve et al. (2013). It may also embody the idea, as made explicit in Fredrickson’s broaden-and-build theory (Fredrickson, 2001), that good moods help to induce the sorts of positive connections that eventually provide the basis for better life circumstances. ↩︎
See, for example, the well-known study of the longevity of nuns, Danner et al. (2001). ↩︎
See Cohen et al. (2003), and Doyle et al. (2006). ↩︎
The prevalence of these feedbacks was documented in Chapter 4 of World Happiness Report 2013, De Neve et al. (2013). ↩︎
We expected the coefficients on these variables (but not on the variables based on non-survey sources) to be reduced to the extent that idiosyncratic differences among respondents tend to produce a positive correlation between the four survey-based factors and the life evaluations given by the same respondents. This line of possible influence is cut when the life evaluations are coming from an entirely different set of respondents than are the four social variables. The fact that the coefficients are reduced only very slightly suggests that the common-source link is real but very limited in its impact. ↩︎
The coefficients on GDP per capita and healthy life expectancy were affected even less, and in the opposite direction in the case of the income measure, being increased rather than reduced, once again just as expected. The changes were very small because the data come from other sources, and are unaffected by our experiment. However, the income coefficient does increase slightly, since income is positively correlated with the other four variables being tested, so that income is now able to pick up a fraction of the drop in influence from the other four variables. We also performed an alternative robustness test, using the previous year’s values for the four survey-based variables. Because each year’s respondents are from a different random sampling of the national populations, using the previous year’s average data also avoids using the same respondent’s answers on both sides of the equation. This alternative test produced similarly reassuring results as shown in Table 13 of Statistical Appendix 1 in World Happiness Report 2018. The Table 13 results are very similar to the split-sample results shown in Tables 11 and 12, and all three tables give effect sizes very similar to those in Table 2.1 in the main text. Because the samples change only slightly from year to year, there was no need to repeat these tests with this year’s sample. ↩︎
Actual and predicted national and regional average 2020-2022 life evaluations are plotted in Figure 37 of Statistical Appendix 1. The 45-degree line in each part of the Figure shows a situation where the actual and predicted values are equal. A predominance of country dots below the 45-degree line shows a region where actual values are below those predicted by the model, and vice versa. Southeast Asia provides the largest current example of the former case, and Latin America of the latter. ↩︎
See Rojas (2018). ↩︎
If special variables for Latin America and East Asia are added to the equation in column 1 of Table 2.1, the Latin American coefficient is +0.51 (t=5.4) while that for East Asia is -0.17 (t=1.7). ↩︎
See Chen et al. (1995) for differences in response style, and Chapter 6 of World Happiness Report 2022 for data on regional differences in variables thought to be of special importance in East Asian cultures. Those data do not explain the slightly lower rankings for East Asian countries, as the key variables, including especially feeling one’s life is in balance and feeling at peace with life, are more prevalent in the ten happiest countries, and especially the top-ranking Nordic countries, than they are in East Asia. However, as also shown in Chapter 6 of World Happiness Report 2022, balance, but not peace, is correlated more closely with life evaluations in East Asia than elsewhere, so that the low actual values may help to partially explain the negative residuals for East Asia. ↩︎
One slight exception is that the negative effect of corruption is estimated to be slightly larger (0.86 rather than 0.71), although not significantly so, if we include a separate regional variable for Latin America. This is because perceived corruption is worse than average in Latin America, and its happiness effects there are offset by stronger close-knit social networks, as described in Rojas (2018). The inclusion of a special Latin American variable thereby permits the corruption coefficient to take a higher value. ↩︎
As represented by Western European countries, the United States, Australia, New Zealand and Canada. ↩︎
More precisely, the test vehicle is the equation in column 1 with no year fixed effects, given our wish to compare the three COVID-19 years to the three preceding years. ↩︎
These results are presented and explained on pages 26-34 of World Happiness Report 2022. ↩︎
Standard errors for happiness gaps (and the associated rank confidence intervals) in Figure 2.2 are computed by nonparametric bootstrap with 500 replications. ↩︎
Allison and Foster (2004) show that even if life evaluations are interpreted as containing ordinal information only, a distribution of responses is more “spread-out” than a second distribution if and only if the gap in top/bottom means in the first distribution is greater than of the second distribution, for any assignment of values to the categories. Thus when the ranking of distributions by top-minus-bottom mean spread is unambiguous, it represents the correct ranking of inequality. ↩︎
See Goff et al. (2018) for evidence that equality of happiness is correlated with happiness levels, even using a purely ordinal measure of equality. Grimes et al. (2023) report further evidence on this front, specifically that a concentration of individuals at the unhappy end of the ladder creates a negative externality that brings down happiness levels overall. ↩︎
WEIRD=Western Educated Industrial Rich Democracies, represented in our data by Western Europe and the mixed group including the United States, Australia, New Zealand, and Canada. ↩︎
The latter measure was the focus of chapter 5 of World Happiness Report 2015, on the sources of happiness and misery. ↩︎
Splitting a country into more and less happy halves requires a rule to assign survey respondents at the country’s median ladder rung to one or the other half. To calculate means for life evaluations in each half, we simply split the median respondents in the proportions necessary to produce two halves of equal size. To Calculate top- and bottom-half means of emotions, social pillars of well-being, and benevolent behaviours, we use predicted life evaluations for each respondent to split the respondents at a country’s median based on how they rank by these predicted values. The regression used to fit the predictions is an individual-level analogue of the specification in the first column of Table 2.1 with a specification akin to that used in Table 2.2 of World Happiness Report 2022. We run this regression on the entire global sample of individual responses from 2005 through 2022, with country and year fixed effects, and use the estimated coefficients to calculate predicted life evaluations for each respondent. Those at a country’s median are assigned to the more or less happy half of their country on the basis of this ranking in the proportions necessary to achieve equal halves. This means that among respondents at the median, the social pillars of well-being are higher for those assigned to the top half than for those assigned to the bottom half, by design. Respondents at values other than the country’s median are assigned to the top or bottom half on the basis of their actual life evaluation, regardless of the life evaluation predicted by their other survey responses. ↩︎
We included individuals in all countries where there was at least one survey in 2017-2019 and in 2020-2022, producing a sample of 563,543 individuals in 128 countries. The structure of the equation matched very closely that in column 3 of Table 2.4 in World Happiness Report 2022, with the addition this year of an interaction between age and gender for young respondents. We eliminated this year all respondents who reported zero household income, which substantially raised the income effect and also removed any significant change during COVID-19. ↩︎
The pre-pandemic effect of having a health problem was -0.459 (t=15.9), and the additional effect during 2020-2022 was -0.055 (t=2.2). ↩︎
See, for example, Table 2.3 in World Happiness Report 2020. ↩︎
See several chapters of World Happiness Report 2018, and Helliwell, Shiplett and Bonikowska (2020). ↩︎
See Fraser and Aldrich (2020) and Bartscher et al. (2021) for national and regional evidence. Using a large global set of countries and data from the first year of the pandemic, Besley and Dray (2021) find that COVID-19 death rates in 2020 were lower in countries where respondents had greater confidence in their governments. ↩︎
See Helliwell et al. (2018) and Table 2.3 in Chapter 2 of World Happiness Report 2020. ↩︎
See Aldrich (2011). ↩︎
See Yamamura et al. (2015) and Dussaillant and Guzmán (2014). ↩︎
See Toya and Skidmore (2014) and Dussaillant and Guzmán (2014). ↩︎
See Kang and Skidmore (2018). ↩︎
See Figure 2.4 in Chapter 2 of World Happiness Report 2021. ↩︎
Fraser and Aldrich (2020), looking across Japanese prefectures, found that those with greater social connections initially had higher rates of infection, but as time passed they had lower rates. Bartscher et al. (2021) use within-country variations in social capital in several European countries to show that regions with higher social capital had fewer COVID-19 cases per capita. Wu (2021) finds that trust and norms are important in influencing COVID-19 responses at the individual level, while in authoritarian contexts compliance depends more on trust in political institutions and less on interpersonal trust. ↩︎
See COVID-19 National Preparedness Collaborative (2022). ↩︎
See Rothstein and Uslaner (2005). ↩︎
This mortality risk variable is the ratio of an indirectly standardized death rate to the crude death rate, done separately for each of 154 countries. The indirect standardization is based on interacting the US age-sex mortality pattern for COVID-19 with each country’s overall death rate and its population age and sex composition. Data from Heuveline and Tzen (2021). Our procedure is described more fully in Statistical Appendix 2 of World Happiness Report 2021. ↩︎
See World Health Organization (2017). ↩︎
An earlier version of this model was explained more fully and first applied in chapter 2 of World Happiness Report 2021. In the 2021 report we also used a second SARS-related variable based on the average distance between each country and each of the six countries or regions most heavily affected by SARS (China mainland, Hong Kong SAR, Canada, Vietnam, Singapore, and Taiwan). The two variables are sufficiently highly correlated that we can simplify this year’s application by using just the WHOWPR variable, as has also been done in other research investigating the success of alternative COVID-19 strategies. See Helliwell et al. (2021) and Aknin et al. (2022). ↩︎
See Statistical Appendix 2 of Chapter 2 of World Happiness Report 2021, and Helliwell et al. (2021) for a later application making use of the same mortality risk variable we are using here. ↩︎
There is experimental evidence that chess players at all levels of expertise are subject to the Einstellung (or set-point) effect, which limits their search for better solutions. The implications extend far beyond chess. See Bilalić and McLeod (2014) and also Rosella et al. (2013). ↩︎
See Emery et al. (2020), Gandhi et al. (2020), Li et al. (2020), Savvides et al. (2020), and Yu and Yang (2020). ↩︎
See Wei et al. (2020), Savvides et al. (2020), and Moghadas et al. (220). ↩︎
See, for example, Godri Pollitt et al. (2020), Setti et al. (2020), and Wang & Du (2020). ↩︎
See Chernozhukov et al. (2021) for causal estimates from US state data, Ollila et al. (2020) for a meta-analysis of controlled trials, and Miyazawa and Kaneko (2020) for cross-country analysis of the effectiveness of masks. ↩︎
See Louie et al. (2021). ↩︎
For an early community example from Italy, see Lavezzo et al. (2020). ↩︎
See Mahase (2021) for a discussion of the emergence of early variants. ↩︎
Rodrigo Furst has kindly used the latest data from the Oxford COVID-19 Government Response Tracker (Hale et al., 2021) to show that at the beginning of 2022, regional average stringency scores ranged from 40-60 out of 100 among their six global regions, while by the end of the year the range had fallen to 15-20. ↩︎
See Aknin et al. (2022). The policy stringency measures are from Hale et al. (2021) ↩︎
China then faced correspondingly larger infections when the elimination strategy was no longer feasible. See Yu et al (2022). On a smaller scale, Hong Kong, another eliminator overcome by Omicron, faced similar problems. See Ma & Parry (2022). ↩︎
See Wang et al (2022) for a review of evidence showing reduced case fatality rates under Omicron. ↩︎
Kislaya et al. (2022) show continuing vaccine effectiveness under Omicron, while Lkke et al (2022) find rapid decline in vaccine-boosted neutralizing antibodies against SARS-CoV-2 Omicron variant. ↩︎
When a version of Panel B of Figure 2.5 is used to compare total directly reported COVID-19 deaths in 2020-2021 with all-cause excess deaths for the same years, the results are very similar for the four country groups at the left hand side of the Figure. These are all countries with relatively high quality measurements for both direct COVID-19 deaths and all-cause excess death rates. For the rest of the world, excess death rates, where they are available, appear to be significantly higher than the report COVID-19 death rates… ↩︎
See Claeson and Hanson (2021). ↩︎
See Aknin et al. (2022). ↩︎
This group, sometimes referred to as WEIRD, for Western, Educated, Industrial, Rich, and Democratic, is represented in our data by regions 0 and 7. Region 0 is Western Europe, and region 7 includes the United States, Canada, Australia, and New Zealand. ↩︎
See Dolan et al.(2021), for UK experimental evidence from a large-scale volunteering programme. ↩︎
See, for example, Aknin et al (2011) and Chapter 4 of this report. ↩︎
The Ukrainian data were collected mainly during September 2022. See also the earlier analysis of the Gallup data in Ray (2022). For Ukrainian attitudes towards the Crimean annexation and its implications see Ray and Esipova (2014) and O’Loughlin et al. (2017). ↩︎
Osiichuk & Shepotylo (2021) examined health and financial well-being during the post-2014 period, and found negative effects to be much greater for those living closer to the zones of conflict. ↩︎
This includes the data for eight oblasts: Dnipropetrovsk, Donetsk, Zaporizhzhya, Luhansk, Kharkiv, Kherson, Mykolayiv, and Odessa. ↩︎
See Kiev International Institute of Sociology (2022). ↩︎
Ukrainian survey research in 2015 found that the happiness reductions were concentrated in the Donbas Oblasts of Donetsk and Luhansk. See Coupe & Obrizon (2016). ↩︎
Tamilina (2022) finds that the war with Russia, but not war worries, predicted higher social trust in Ukraine using data from two rounds of the World Values Survey. ↩︎
See Gallup/Meta (2022). The State of Social Connections study, by Gallup & Meta (Meta-commissioned study of at least 2,000 people ages 15+ in Brazil, Egypt, France, India, Indonesia, Mexico, and the United States), April-June 2022. ↩︎
The three social connection questions included measures of support (“In general, how supported do you feel by people? By supported, I mean how much you feel cared for by people.”), connection (“In general, how connected do you feel to people? By connected, I mean how close you feel to people emotionally.”), and loneliness (“In general, how lonely do you feel? By lonely, I mean how much you feel emotionally isolated from people.”). All response options were on a 4-point scale that ranged from “Not at all [supported/connected/lonely]” to "Very [supported/connected/lonely]. The social domain satisfaction question available in the 7-country poll is “In general, how satisfied are you with your relationships with people”. The four answers offered are very satisfied, somewhat satisfied, somewhat dissatisfied and very dissatisfied. The Gallup World Poll subset does not include this social domain satisfaction variable, but the Cantril ladder is asked elsewhere of all respondents, on a scale from 0 to 10, and provides a more general umbrella measure with which to value different aspects of social relations. ↩︎
For social connections, the seven-country average was 3.04 with the significant departures being Brazil and Mexico lower (by 0.33 and 0.15, respectively), Egypt higher by 0.28, and France and India above the average by smaller amounts (0.07 and 0.11 respectively). For social support, the seven-country mean was 3.09 with significant departures being Egypt and the US higher (by 0.10 and 0.17 respectively) and Brazil and France lower (by 0.15 and 0.14 respectively). For loneliness the seven-country average was 1.68, with Egypt and India being higher (by 0.17 and 0.38 respectively) and Brazil, France, Indonesia and Mexico lower, (by 0.05, 0.13, 0.26, and 0.08 respectively). ↩︎
For the umbrella measure of social domain satisfaction, the countries fell in a fairly narrow band, with the only significant departures being Brazil and Egypt higher by 0.07 and 0.09, respectively, and France lower by 0.15. ↩︎
For example, as reviewed by Holt-Lunstad et al. (2015) and Leigh-Hunt et al (2017). ↩︎
See Folk et al. (2023). ↩︎
These are coefficients drawn from an equation using the combined social support variable and loneliness to predict satisfaction with social connections. See Folk et al. (2023) for details. ↩︎
In both the deep-dive and Gallup World Poll surveys, there are four answer options for each of three social connections questions in the seven countries appearing in both surveys. If we treat the deep dive survey’s share of responses in each of these 84 country-question-response bins as observations of one random variable, and the Gallup World Poll shares as a second random variable observed for the same 84 bins, the Pearson correlation of the two survey variables is 0.983. Within individual countries, the correlation of the 12 observations is consistently greater than .975, from a low of 0.976 in Egypt to a high of 0.995 in Indonesia. ↩︎
We found that none of the three variables added significant explanatory power, whether or not we included our existing social support variable. This may reflect the relatively small sample size (104 countries) and no doubt also reflects the fact that the international share of total variance is much greater for life evaluations than for social context variables, as shown in Figure 2.1 of World Happiness Report 2013. ↩︎