Well-being and State Effectiveness
Acknowledgments
We are grateful for detailed and perceptive comments by Lara Aknin, Jan-Emmanuel De Neve, John Helliwell, and Richard Layard. We also thank the Gallup World Poll for generous sharing of data and Max Norton for assistance in combining the data across chapters in this report. Sharon Paculor, John Stislow, and Ryan Swaney kindly helped us get the chapter ready for print.

Introduction
In a long tradition – from Jeremy Bentham’s “greatest happiness principle” and onwards – many observers have argued that governments should aspire to raise the happiness of their citizens. Yet, experience suggests that it is a huge challenge to orient the government towards this goal and ensure that it can effectively deliver on it. A key reason is that even benevolent-minded policymakers who would like to pursue a happiness goal may not have the capability to do so. Thus, maintaining internal security and peaceful resolution of domestic conflicts is problematic in many places – between 2006-2016, around 78 percent of the global population lived in countries that experienced civil conflicts, or where individuals were subjected to state repression.[1] As for protecting or raising citizens’ well-being, many states fail to provide effective social protection, build necessary infrastructure, and ensure availability of services such as universal healthcare or basic education. So if we are to understand whether a government can effectively pursue happiness as a goal of public policy, we need to appreciate what drives government effectiveness.
Early history provides examples of remarkable government achievements – mainly infrastructure investments, like in Mesopotamian irrigation, Egyptian pyramids, Incan temples, or Holy Roman Empire buildings – but effective states with wide-ranging responsibilities only appeared in the past century and a half. The twentieth century saw a remarkable transformation of some states towards a new form of cohesive capitalism, where markets and states came to coexist and promote prosperity and well-being. In contrast to earlier history, many countries not only created benchmarks for state effectiveness, but also became politically open, with competitive contests for power and universally enjoyed political rights and freedoms. For those who would like to promote human happiness, it is thus key to understand the scaffolding that supports the building of such effective states.
In the chapter, we show how evidence of overlapping clusters of effective states emerge from the data. We also show how these clusters extend to state activities and levels of well-being. In particular, the beginning of the chapter explores the forces that have shaped the emergence of effective states in two core dimensions: (i) establishing peace and security and (ii) building capacities to enforce laws and regulate markets alongside capacities to fiscally fund programs with universal benefits. Later in the chapter, we argue that focusing on these core dimensions gives useful insights into the link between effective government and well-being.
If we are to understand whether a government can effectively pursue happiness as a goal of public policy, we need to appreciate what drives government effectiveness.
Although effective states today may share key features, we do not argue that these emerged from a common ideal path. Each functioning state has its own unique history, leading to its current circumstances. However, we do highlight certain features, namely institutions, norms, and values that foster political cohesiveness. All societies have cleavages based on different incomes, social classes, regions of residence, religions, or ethnicities. For a state to govern successfully in the presence of such cleavages, it must find ways of bringing citizens together to recognize their common interests and reconcile their conflicting priorities.
Institutional arrangements, such as legislatures and independent courts, create a platform for managing conflicting policy interests. Norms of respect and reciprocity can help those in charge of making policy decisions to reach equitable and sustainable compromises. Certain organizational and institutional structures entail weaker incentives to engage in political violence and stronger incentives to expand state capacities – e.g., to build armies or police forces or train cadres of lawyers, doctors, or educators.
Following Besley and Persson,[2] we label such states as common-interest states. The basic analytical framework presented by these authors illuminates how institutions and norms/values can galvanize universal interests. Aligned interests promote the incentives for building the capacities of the state needed to support a rich array of welfare-enhancing policy interventions as well as a flourishing market economy. Together these state capacities promote peace, prosperity, and happiness. The approach that we suggest also emphasizes that looking solely at links between policy and well-being misses a crucial intermediate step, namely the conditions for the delivery of welfare-enhancing policies. It also stresses that political institutions are vital, not only because they play a key role in policy choice, but also because they can help to sustain state capacities in the long run.
Besley and Persson’s framework spells out a theory, which does not rely on simple one-way causation. Its stress of two-way processes and feedback effects makes it difficult to tell a simple story in terms of ultimate drivers, as we explain in the discussion to follow. One of the key ideas is the emergence of development clusters – i.e., different aspects of state effectiveness that tend to appear together. In particular, the data suggest that there are three broad clusters of states in the world today. We order these clusters in a hierarchy and label them (from the top down) as common-interest states, special-interest states, and weak states.
Based on this typology and our earlier discussion, we frame the key long-run challenge to promote well-being as the challenge of transitioning to a common-interest state. However, the difficulty of making such a transition cannot be underestimated, given the complementary elements that maintain the three clusters. Indeed, such transitions are extremely rare.
The chapter is organized as follows. In the next section, we discuss the two key dimensions of state effectiveness – peace and security and high state capacities – in greater detail. Then we discuss the underlying processes that promote state effectiveness. We pull this analysis together in the section after that. In the final section, we develop the implications for well-being, and also make an empirical connection with the results that were presented in Chapter 2.

Elements of State Effectiveness
We begin by discussing the two core dimensions of state effectiveness introduced above: the ability to establish peace and to build state capacities.
Рeace and social order: The Weber doctrine One core function of an effective state is to limit the use of violence and maintain law and order. Since Max Weber first enunciated the idea,[3] it is widely accepted that a key feature of an effective state is to establish a monopoly on the legitimate use of coercive force in the territory over which it has jurisdiction. Of course, what constitutes “legitimate” in this context is not obvious. But it is generally accepted that this term refers to a state where the citizens accept such coercion and trust the state to use its power to coerce in a responsible manner. It is not enough for the state to coerce by depriving their citizens of basic political rights in the name of establishing order, although this remains extremely common. The Weberian approach unambiguously rules out political violence by non-state actors, as occurs during civil wars where citizens from different groups use violent means to compete for power. It is useful to begin with an empirical overview.[4]
Civil wars remain today: standard data sources suggest that 22 countries out of 170 had at least one year of civil war during the period 2006-16. Such wars are more common in poorer countries with 13 of the 22 being low income, 7 middle income, and only 2 high income.[5] Low income can be both a cause and a consequence of such violence. But political conditions matter as well. A standard measure of such conditions, discussed in more detail below, is whether executive power is subject to legislative and judicial constraints. According to a standard measure of strong executive constraints,[6] 20 out of the 22 countries with a civil war in 2006-16 never had strong executive constraints over this period. The frequency of civil wars peaked in the 1980s and 1990s, and the proportion of countries with internal conflict has been steadily declining thereafter. The prevalence of civil war has now leveled out at around 10 percent.[7]
A country not having an outright civil war does not imply that political violence is absent. It may just reflect that the incumbent regime uses its monopoly on violence to repress any political opposition. Such a state may appear to be effective in a Weberian sense, but violence here is “one-sided” as rulers lock up opposition groups and stamp out protests. Historically, coercive repression was the main method for sustaining political power, rather than winning elections. But it remains prevalent today with 76 countries experiencing state repression in at least one year between 2006-16. While the share of countries engaging in repression fell from 30-40 percent in the 1950s to near zero by the late 1990s/early 2000s, it has been on an upward trend since 2006, with almost 10 percent of countries carrying out some form of political purges. This is linked to a democratic recession over this period, with the populations of Brazil, the Philippines, Russia, Thailand, Turkey, and Venezuela all seeing higher repression.[8]
There are thus good reasons to think about repression and civil war as two sides of the same coin – i.e., as substitutes. Indeed, over the post-war period, repression has generally declined while civil war has been on the rise. Moreover, repression generally occurs in a higher portion of the world income distribution than does civil war. Of the 76 countries with repression in 2006-16, 37 were low income, 26 were middle income, and 9 were high income. Moreover, 53 did not have strong executive constraints in this period.
The presence of political violence has important implications for investment in education as well as for the kinds of private investment needed to create jobs and prosperity. Civil conflict has negative consequences for income, as it typically involves uncoordinated violence among multiple parties, which leads to widespread economic disruption and significant destruction of physical and human capital. In this way, a state can enter a vicious cycle with lower income levels reducing the cost of fighting, which further reduces income.
Effective and entrenched repression can create a form of political stability, such as the one we see in China, or the Middle-East monarchies. While there is always a risk that incumbents use their arbitrary power to expropriate the returns to investment, it may be feasible for repressive states to pursue long-term economic goals that are credible in the eyes of investors. In this way, repressive regimes can enjoy some economic success at the cost of limited political rights. As corrupt practices that negate economic results may be hard to control, rulers in stable repressive dictatorships who recognize this can have self-serving incentives to control corruption and promote prosperity.
State capacities: The Tilly doctrine State capacities can support an effective state by strengthening the ability to identify and deliver efficient policies, or by lowering their cost. For example, to work well an income tax requires investment in infrastructure for monitoring and compliance. The term state capacity was coined by the historical sociologist Charles Tilly to describe the power to tax.[9] But it is helpful to think of state capacity in wider domains. Besley and Persson[10] suggest three key dimensions of state capacities: fiscal, legal, and collective. They present both cross-sectional and time-series evidence on how state capacities have been built in each of these three dimensions.
Fiscal capacity refers to the power to tax. Being able to tax effectively requires having systems for tracking incomes and contributions to social security programs, and promoting compliance with tax laws by firms and individuals. Fiscal capacity is also built by ensuring that tax bases are broad: indeed taxes on income and value added – rather than, say border taxes – finance the bulk of state spending in modern economies.
Legal capacity refers to the power to adjudicate and implement laws. Having an effective legal system requires a range of investments in legal institutions, courts, and regulatory bodies. These enable the protection of property rights and enforcement of contracts to encourage trade and investment. Legal capacity can also support economic, political, and civil rights, for example, by making it possible to limit discrimination or enforce minimum-wage laws.
Collective capacity refers to the power to deliver a range of public services. This requires organizational structures that enable effective provision of public health and education. Examples include building statistical agencies to plan service provision and developing systems for lifetime interactions between the state and citizens. Investment in intangible capital is hugely important in finding ways of keeping and maintaining records and ensuring delivery of medicines and other supplies.
State capacities can be thought of as a form of capital. They often involve public buildings, but they also rely on what is nowadays often referred to as “intangible capital” rather than physical infrastructure.
Measuring state capacities is not straightforward and there are no standard, agreed-upon metrics. By way of illustration, we use three crude measures. For fiscal capacity, we use the share of total tax revenues raised by income taxes in 2016. Compared to, say, border taxes, income taxes generally require more extensive bureaucratic infrastructures – e.g., for withholding – to collect taxes or facilitate compliance with tax rules. For legal capacity, we use the 2016 value of the World Bank’s contract enforcement index (from the Doing Business Project).[11] For collective capacity, finally, we construct a basic index that takes the average of educational attainment (from Barro and Lee’s dataset[12]) and life expectancy (from the World Development Indicators).[13]
These three forms of state capacity are highly correlated across countries and are positively related to income per capita. The patterns in the data are illustrated in a three-dimensional plot (Figure 3.2) in Besley and Persson.[14] Although state capacities are related to income, it is not because income causes higher levels of state capacity, nor indeed the other way round. Our preferred framework for understanding state capacities stresses a web of mutually interdependent factors which eschews a simple causal story. This strong correlation between a range of outcomes across countries creates development clusters.

Origins of Peace and State Capacity
Whether peaceful political orders are established and whether state capacities are built both depend on how leaders purposefully allocate resources towards uses that have future consequences. It is useful to conceptualize these as forward-looking investments by the state.
The key role of investments Political violence can be seen as an attempt to invest resources with the purpose to acquire or establish political control, or to remove incumbent groups from power. A peaceful social and political order requires systems of conflict resolution, such that no group finds it necessary to invest in violence for these purposes. Indeed, peaceful transitions of power are perhaps the most remarkable achievement of democratic systems. Repression is a form of investment where state power is deployed to enable autocrats to stay in place. This is frequently achieved by the extensive use of secret police and military force against civilians. Civil wars can be thought of arising as a consequence of two-sided investments in violence, where one side is the opposition that most often organizes as anti-state militias. To understand how peaceful societies come about, we thus have to investigate the conditions under which it is unattractive to invest in political violence.
A similar, but reverse, line of argument applies to state-capacity building. Consider, for example, fiscal capacity. Setting up a tax system requires monitoring and compliance systems to be built involving organizational structures with tax inspectors and auditing. States that make such investments look to the future revenues that can be generated. Building legal structures, health systems, and social security systems similarly take time and thus requires forward-looking decisions to invest in the required institutions. To understand how state capacities come about, we thus have to understand under which conditions it is attractive to invest in them.
Institutions and norms are crucial supporting structures for the promotion of investments in state capacities and/or limiting investments in political violence. In either case, leaders need to be reassured about the future. Let us give two examples to illustrate this. First, consider a case where citizens comprising the opposition believe that a disputed leader who loses an election will indeed step down. This will weaken motives to invest in political violence. Second, consider a case where incumbent leaders believe that future additional revenues from investments in the tax system will be used for expenditures with common benefits. They will then have a stronger incentive to invest in building fiscal capacity as their own group will benefit regardless of who holds power in the future.
Cohesive institutions When we speak of “cohesive institutions,” we have in mind a whole set of arrangements that constrain state power towards pursuing common interests. Over the course of history, parliamentary oversight has become an increasingly important constraint on executive power, as has the legal principle that political leaders are also subject to the law. These constraints have been further reinforced as states have created independent judiciaries who uphold the law and apply justice impartially to all citizens, whether or not they are part of a political or social elite. Many states have deployed a range of institutional arrangements, which ensure that leaders cannot silence the media and that citizens can express critical opinions with impunity.
A good starting point for building cohesive institutions is a broad social consensus on the rules and limits to government power. These can be enshrined in written documents, such as constitutions. But they can also be sustained by tacit agreement on taking a long-term view, understanding that corruption or nepotism by incumbent policy-makers can have damaging long-term consequences. The bedrock of cohesiveness is a shared understanding that the benefits from collective action are not zero-sum, meaning that citizens have strong motives to work together to achieve collective benefits.
The political history of the past two hundred years shows that creating some kinds of cohesion is a real possibility as manifested in the transition to peaceful social orders. Indeed, many countries forged their politics in response to periods of violent conflict and turmoil. But how far it is possible to leave historical conflicts behind and move on is far from clear.
To create empirical measures of cohesive institutions is not straightforward. In the results presented in this chapter, we use data from the V-Dem project to measure the strength of executive constraints; specifically, we take a simple average of two V-Dem variables: (i) executive constraints by the judiciary and (ii) executive constraints by the legislature and government agencies.[15] In our opinion, this measure is preferable to broader indicators of whether a country is deemed to be democratic, as it stresses whether existing political institutions allow for checks on executive power which are more likely to create cohesive policy outcomes. This aspect of democracy has generally evolved more slowly than open contests for power using elections.
The way political institutions aggregate preferences and distribute political power is also an important determinant of state-capacity investments. Besley and Persson[16] formalize the political mechanics by highlighting a specific, but important, policy cleavage: how state revenue is split between broadly targeted and more narrowly targeted programs.[17] In their stylized model, this decision is made without commitment by policymakers who look out for the interests of their own group. Absent any institutional constraints on executive behavior, this favors excessive spending on narrow programs targeted to the special interests of the ruling group. Classic examples would include spending on tertiary education by a wealthy and well-educated ruling elite, or public programs targeted to the home region of the ruling group. However, executive power can be constrained by institutional forces: electoral systems inducing the ruling group to gain wide appeal to be (re)elected, rules for legislative decision-making motivating executives to seek broad agreements, or independent judiciaries enforcing rules for minority protection. Transparency in decision-making supported by free media may also make it harder for executives to get away with using their power to narrowly target benefits toward their own groups. Besley and Persson[18] argue that cohesive political institutions that induce greater spending on common-interest public goods may also support common interests in other ways. For example, they may ensure that property rights are extended broadly to all citizens, without discrimination towards groups that are not connected to the ruling group.
The bottom line is that more cohesive institutions create a stronger interest in investing in an effective state. Less cohesive institutions allow the state to be run more in the interest of a narrow segment of the population, which weakens the motive to improve the core functions of revenue collection, market augmentation, and market support. Nevertheless, governing groups in such special-interest states may decide to invest in state capacities if these support the ruling group’s specific ambitions. Cohesive political institutions are an important common driver of all three kinds of state capacity. Moreover, building legal capacity and infrastructure will also support economic development and hence higher income.
Рolitical turnover The length of political horizons affects state capacity investments more in states that lack cohesive political institutions since such investments are more valuable to an incumbent group that expects to hold onto power rather than one that expects to be ousted. As incumbency brings greater control rights over policy, a wider set of policies is most valuable when a group can control their use. This suggests a positive link between political stability and state-capacity investments, as emphasized in Besley and Persson[19]. However, political turnover also interacts with cohesive institutions. An incumbent government constrained by cohesive institutions has more circumscribed control rights, and can therefore tolerate higher expected political turnover without compromising the incentive to invest. High political turnover is therefore likely to damage state-capacity investment the most when political institutions are non-cohesive, as the policies chosen by any incumbent will be less reflective of common interests.
Traditionally, the best hope for state-capacity building was to have rulers with long time horizons. Ruling elites would have incentives to build functioning states not just to buttress their chances of staying in power, but to placate citizens who might otherwise grow concerned about political inequalities. In such cases, investments in state capacity become akin to investments in private capital. To pick an example among today’s states, some entrenched monarchies in the Middle East resemble family firms, with opaque distinctions between private assets of the ruling dynasty and collective state assets.
However, political longevity is rarely a product of voluntary consent even though many elites try to foster benevolence myths - or appeals to divine rights - to justify their right to rule. But the reality is that state repression is almost always the tool used to maintain power. Such repression can wax and wane depending on events. For example, periods of high growth when the state can increase the quality of public services can stave off the need for intensive repression. But the threat of civil conflict is rarely far away if a substantial group of citizens decides to challenge the elite, either to establish local control over a particular terrain or the national state. The state may also face threat if a substantial prosperous and educated middle class emerges that demands political rights. Whether this results in greater repression or outright conflict is not so clear. But where it does lead to a prospect of conflict it can lead to greater political instability, with rulers reallocating resources from investments in state capacity to investments in coercive power.
Norms and values In broad terms, norms and values comprise what is often referred to as “civic cultures.” A large body of work in political science and political sociology already stresses how norms and values may underpin state effectiveness.[20] This research argues that norms and values may foster prosocial forms of behavior directly, or indirectly by coordinating beliefs on the benefits of prosociality. To be more concrete, norms and values may determine whether a public official will refuse to take a bribe, whether a citizen will pay her taxes, or whether she will obey the law. Similarly, norms and values about good citizenship may limit people’s willingness to use violence against fellow citizens. Those who wield coercive power may therefore serve as a check on state coercion as well as a propagator of it.
The role of norms in regulating behavior came to the fore during the recent pandemic determining willingness to wear a face mask, to engage in social distancing, or to become vaccinated. In times of war, values may shape a citizen’s willingness to volunteer for active duty. Social norms can motivate people to seek occupations that stress selfless public service. Choosing to vote or to participate in political activities can also reflect socially oriented values.[21]
Some have argued that norm-following can arise purely from self-interest if individuals fear social sanctions or ostracism for disobeying a norm. Thus, politicians who pursue the public good may do so for purely self-interested reasons, because they care about their social reputations.
Alternatively, norms can be internalized in values that are learned at a formative age from parents, peers, or educators. Such norms often become “second nature” rather than being the result of calculating behavior. The strength of such values can be assessed in survey data like those assembled in the World Values Survey (WVS). This survey and its many followers contain a number of questions about attitudes and show how much these attitudes, and the values they reflect, differ across individuals, both within and between countries. Nonetheless, looking across waves of surveys, as well across cohorts in the same survey, there is strong evidence of persistence. Moreover, values strongly correlate with education attainment, volunteering, and other forms of civic behavior that are more common among the more educated.[22]
Aside from these general properties, values and norms can be important in fostering state effectiveness, both directly and indirectly.
Directly, they can help to underpin the motives to invest in state capacity. A clear example is a higher perceived return to building legal capacity in the form of a court system when judicial norms have evolved to support the rule of law. Another example concerns the returns to building fiscal capacity. Levi[23] argues that trust in the state is important for the building of a tax system, as the power to tax is part of a social contract where tax paying becomes a quasi-voluntary act encouraged by a belief that the state promotes common interests. A culture of tax compliance can also emerge based on principles of reciprocity between the state and the citizen.[24]
Indirectly, norms and values can help make institutional arrangements more cohesive and hence increase incentives for investment in state capacity. Norms saying that the state should be used for the public good can thus help underpin commitments to universal public programs. Analogously, norms saying that incumbents should be electorally rewarded for delivering universal benefits can be important, although they do require citizens to turn out and vote in the prescribed way, despite any private costs of doing so.
Complementarities The conceptual framework we have just sketched gives us good reasons to expect that state capacities, peace, and income will cluster together. In one part, this prediction reflects an expectation that these outcomes have common drivers in the form of cohesive norms, values, and institutions. In another part, it reflects a coevolution due to positive feedback loops among the three outcomes over time.
To illustrate the coevolution, consider investments in fiscal capacity. These will tend to be greatest when the formal economy is most developed, something that will be reinforced by a strong legal system. Having a social-security system funded by an income tax will also tend to broaden the tax base – and hence stimulate investments in fiscal capacity – by pulling people into the formal economy, where they are subject to taxation. Cohesive institutions which ensure that tax revenues are used to fund the social-security system also provides reassurance to citizens. Likewise, a contribution-based social security system fosters norms of reciprocity between citizens and the state. The fact that such programs are universalistic means that political control is less important. Hence the incentives are weaker for each group to invest in violence so as to capture the state. The increased expectation of peaceful resolution of conflicts fosters private investment and raises incomes. And so on.

Рutting the Рieces Together
State Spaces Based on our discussion in the previous sections, we can now succinctly describe the characteristics of the three stylized forms of states suggested by the theoretical approach in Besley and Persson.[25]
Common-interest States Revenue is spent largely for the common good. Political institutions are sufficiently cohesive, with strong constraints on the executive to drive outcomes closer to this one. These institutions constrain the political power of incumbents, which gives them powerful incentives to invest in state capacity with long-term benefits, knowing that future rulers will continue to govern in the collective interest. Common-interest states tend to have effective systems of revenue collection with broad-based taxation, strong collective provision using universal programs for health, education, and retirement. They also have legal and regulatory systems which provide the foundations for a strong market economy. While common-interest states are heterogenous, they are concentrated in western Europe and North America.
Special-interest States These states are run to favor the interests of a ruling group which is weakly constrained by political institutions. However, ruling elites are often entrenched in power, possibly due to high levels of repression, which foster a form of political stability. State capacities primarily serve the interests of the ruling group. But this limits the domain of the state and weakens the motives to invest in state capacity compared to common-interest states (all else equal). Special-interest states, too, are heterogeneous and include oil-rich states such as Kuwait or Saudi Arabia, as well as some one-party autocracies such as China. Special-interest states can have a focus on raising income levels when this suits the interests of the ruling elite or is seen as a way to keep the populace quiescent.
Weak States Like special-interest states, weak states lack strong constraints on the ruling group. However, unlike redistributive states, they are politically unstable, giving frail incentives for incumbent groups to invest in state capacity. As a consequence, the abilities to raise revenue, protect property rights and support markets, or to deliver welfare services are limited. Political instability is often the result of violent contests for state power, as seen, e.g., in Afghanistan. Low state capacity and pervasive conflict limit the incentives for private investment, which may lead to a vicious cycle of poverty and conflict.
The Рillars of Рrosperity Indeх To get an empirical handle on these two core dimensions of state effectiveness – peaceful resolution of conflict and high state capacity – along with a more conventional approach based on income differences, Besley and Persson[26] suggested a Pillars of Prosperity index. This index was constructed as the simple average of three measures which all range between zero and one. The first component is itself an index of the three components of state capacity which we introduced above, i.e., fiscal, legal, and collective capacity; the second component is an index of peacefulness, based on the prevalence of civil war and repression;[27] while the third component is a measure of income per capita.[28] Figure 3.1 shows how this measure is related to the two factors highlighted in our discussion of the origins of peaceful orders and high state capacity. One is simply the measure of constraints on executive power (from V-Dem) that we discussed above. The other is an index of civic values (from the WVS). Specifically, the civic values index aggregates five variables: confidence in government, general trust in people, attitudes to complying (not to cheat) on taxes, confidence in the justice system/courts, and attitudes (not being justified) to accepting bribes.[29]
Figure 3.1: Pillars of Prosperity Index vs. Executive Constraints and Civic Values
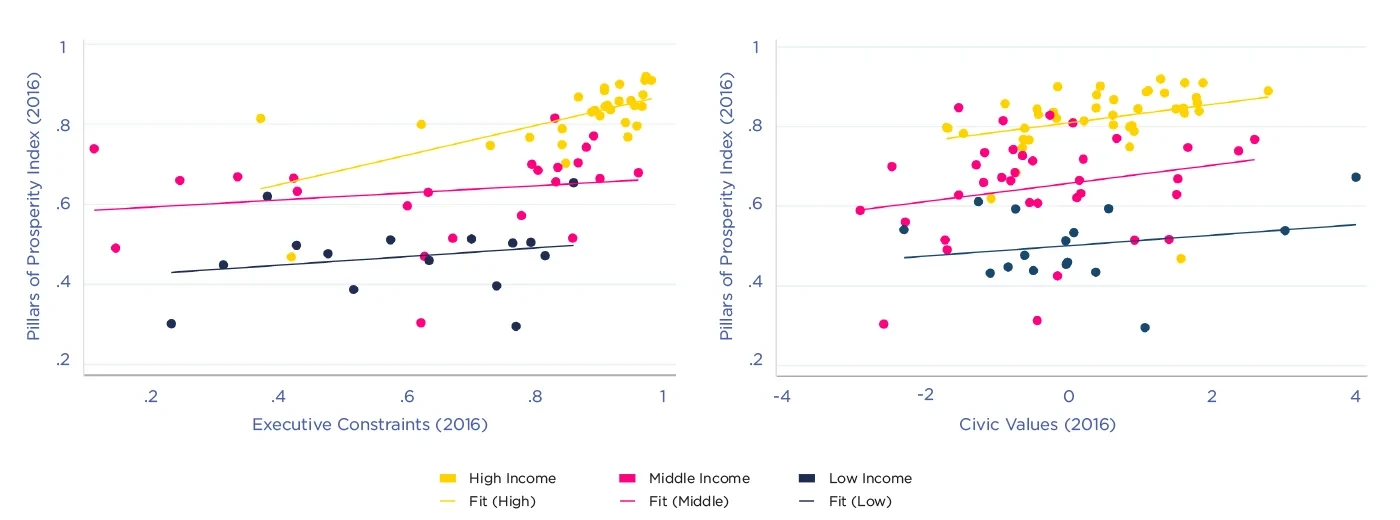
Figure 3.1 shows a strong positive correlation between the Pillars of Prosperity index and the history of executive constraints (left graph) and civic values (right graph). Each dot represents a country and the color of that dot indicates which third of the world income distribution that country is in. As both graphs show, the positive correlation is present not only across all countries but also more narrowly within each income group.
Clusters The evidence in Figure 3.1 relies on a more or less arbitrary amalgamation of various indicators into a single index. Because of the positively correlated indicators, we prefer to think in terms of clusters of countries. We now show, using our data, that positive and negative attributes tend to cluster together, just as we would expect if the components of social peace and state capacity were the result of common causes and complementarities (recalling the discussion at the end of the previous section).
Specifically, we undertake a ‘cluster analysis’ using a fairly standard statistical algorithm that uses machine learning to find groupings of similar countries based on a set of observable attributes. The algorithm used also “decides” how many groups are needed to best fit the data.[30]
The core variables that are used to construct these clusters are the same as those that go into the Pillars of Prosperity index that we constructed above.[31] As illustrated in Figure 3.2, we find that allowing two distinct dimensions of heterogeneity across countries does a reasonably good job of describing the data. The first dimension (along the x-axis of the figure) broadly captures differences in state capacity and income, while the second dimension (along the y-axis of the figure) captures political violence.[32] The clustering algorithm identifies three distinct clusters of countries as illustrated in Figure 3.2, where we have shaded the three groups in distinct colors and identified each country by its standard three-letter country code.
Figure 3.2: Clustering of Attributes Across Countries
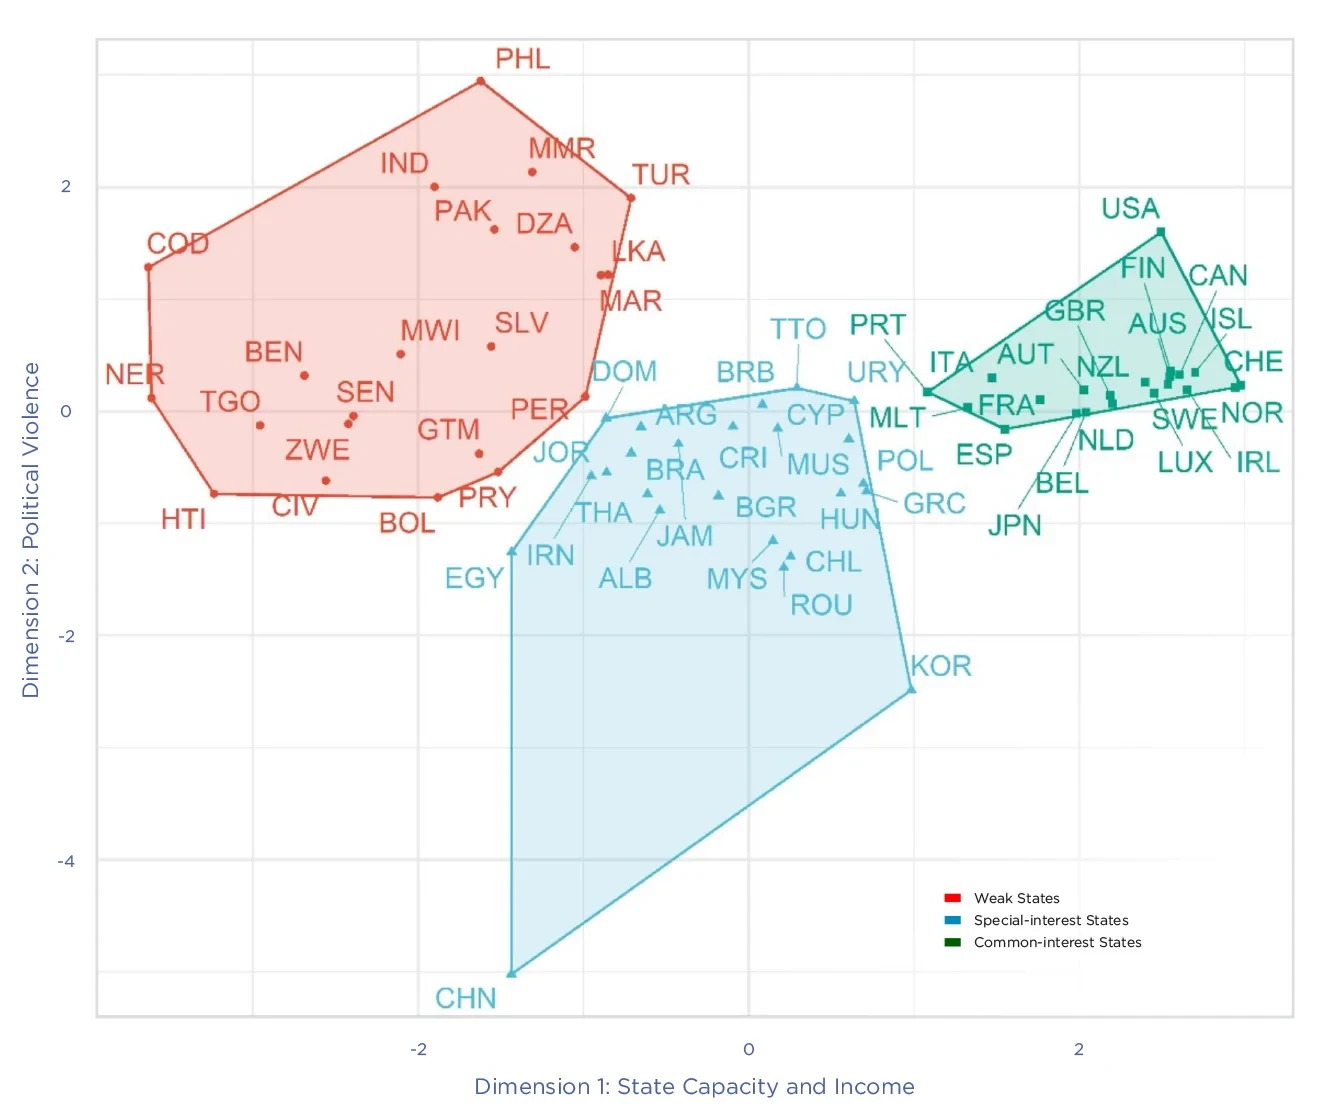
It is striking that these three clusters correspond neatly to the groupings suggested by our theoretical approach to state effectiveness, as summarized at the beginning of this section. The weak states in the figure are those shaded in orange and positioned in the negative orthant of Dimension 1 (state capacity/income) and positive orthant of Dimension 2 (civil war). This rhymes well with the idea that they have relatively high levels of civil war and low levels of state capacity and income.
Special-interest states are shaded in blue and have intermediate levels of state capacity and income. These countries are situated in the negative orthant of Dimension 2, which represents high levels of repression. China is a particular outlier in this dimension, with exceptionally high repression.
Common-interest states are shaded in green and form a particularly tight cluster. Countries in this cluster belong to the positive orthant of Dimension 1 (state capacity/income) and they have values on Dimension 2 (conflict) that hover around zero, which represents low levels of repression as well as civil war.
The highest values for the three state-capacity measures and the highest values of life satisfaction are found in the green-colored common-interest states.
Implications for Well-being – Theory and Evidence
In this section, we draw out the implications of the preceding analysis for well-being. Moreover, we show that these implications are consistent with the patterns in the data, when we measure well-being with life satisfaction data from the Gallup World Poll. Finally, we relate these empirical patterns directly to the determinants of well-being highlighted in Chapter 2.
Effective states and well-being Our two-dimensional approach to state effectiveness gives ample a priori reasons to believe that peaceful states with larger state capacities are conducive to higher well-being for their residents. Living in an environment with peace conveys direct benefits, even more so when such peace is not dependent on state repression. Below, we connect this to the themes developed in Chapter 2. Strong state capacities may mean higher taxation. But we expect this to be the case only when cohesive institutions and/or values encourage public spending on common interest programs for the provision of healthcare, education, or infrastructure. Similarly, high legal capacity may help to promote freedom, serve as a bulwark against discrimination, enhance economic opportunities for disadvantaged groups, and prevent abuse of market power or raise product and workplace safety.
We expect this pattern to manifest itself in cross-country comparisons. That said, looking at cross-country data is more of a suggestive exercise than a method to pin down convincing causal relations. Moreover, if the elements of effective states cluster together, it would be hazardous to give too much prominence to any single element of state capacity or peacefulness. This would amount to treating better performance in that particular dimension as a kind of silver bullet for well-being. Instead, the presence of development clusters emphasizes that many state features go hand in hand in effective states.
In drawing conclusions from our analysis of well-being differences across countries, we should also be realistic about time frames. Besley, Dann, and Persson[33] stress that clustering patterns are very stable over long periods, as almost every country remains in the same cluster over several decades. Even though some institutions can change fairly quickly – as we see from time to time, when countries shift towards more democratic institutions – investments underpinning state effectiveness may take a long time to bear fruit. Moreover, supporting values and norms are likely to change even more slowly than institutions.
Although we include it in the Pillars of Prosperity index, our approach suggests how it may be misleading to look only at income when comparing country patterns in well-being since income itself may (partly) be the product of an effective state. Moreover, effective states may permit human flourishing on a wider range of outcomes than income. For instance, China’s astonishing economic progress over the past forty years has not been coupled with freedom of expression or political rights.
Our study of clustering suggests that the real challenge in promoting well-being is finding the ingredients needed to become a common-interest state. Two centuries ago, the world had no such states. But it is no better to tell countries outside the common-interest cluster that they need to be more like Denmark, than it is to tell an athlete that she will win an Olympic medal by running faster. Norms, values, and institutions are the scaffolding that supports the construction of common-interest states. Neither are simple prescriptions on the need for a democratic transition credible and useful, especially when interpreted merely as greater openness in access to power. If free elections are not combined with cohesive institutions and values, they may just generate political instability associated with transitions into violence.
Life satisfaction and measures of state effectiveness These broad lessons regarding state effectiveness and well-being turn out to correspond well with patterns in the data. To see this, consider the measure of life satisfaction used in Chapter 2, namely the Cantril Ladder scores from the Gallup World Poll. Recall that these reflect subjective expressions of the respondent’s life satisfaction, when the best possible life is scored by 10 and the worst possible life by 0. We average these scores at the country level, possibly after conditioning on a range of individual characteristics that have been claimed to drive individual well-being (age, income, gender, health, employment status, and marital status).
Figure 3.3 relates these adjusted country-level happiness scores to the Pillars of Prosperity index. To connect to the clustering theme, we color the dots for every country by the cluster it belongs to in Figure 3.2: orange for weak states, blue for special-interest states, and green for common-interest states.[34]
Figure 3.3: Country-level Life Satisfaction (average Cantril Ladder scores) vs. Pillars of Prosperity Index, by State Clusters
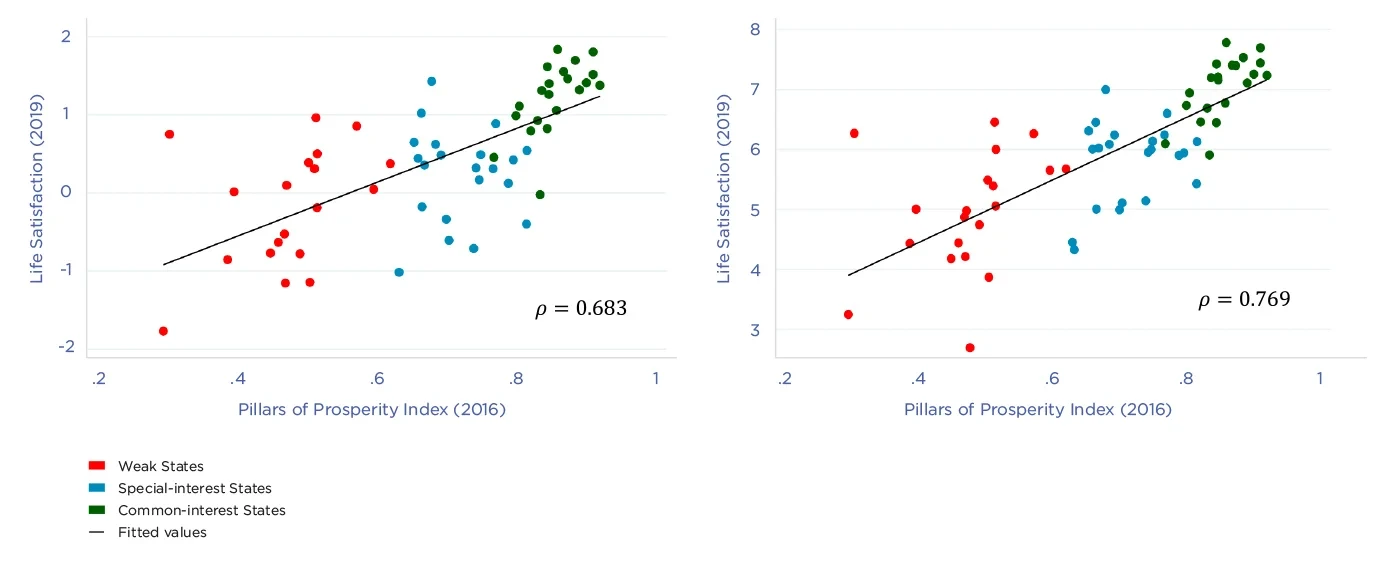
Note: Left graph holds constant individual age, income, gender, health, employment, and marital status. Right graph shows unconditional correlation.
The left-hand graph controls for differences in survey respondents’ age, income, gender, health, employment, and marital status (which are well established correlates of life satisfaction) before computing the country-average scores, while the right-hand graph shows the average raw scores without such controls. In line with our expectation, life satisfaction is strongly positively correlated with the Pillars of Prosperity index in both cases. Moreover, the figure clearly illustrates how life satisfaction is aligned expectedly with the three state clusters identified in Figure 3.2 – clearly highest among common-interest states and lowest in weak states.
The value added of our approach is now laid bare. The headline story from the data is that residing in a common-interest state – with its specific configuration of state capacities, and with peace that is not upheld by repression – appears to be strongly related to a high level of life satisfaction. Although many factors are certainly at work, our narrative about drivers of state effectiveness rhymes very well with the data. This underscores our earlier argument that it is vital to understand the forces that can support the building of common-interest states, such as investing in cohesive institutions and fostering norms and values that are conducive to political cohesion.
Figure 3.4 offers a more disaggregated take on our core finding and shows how country-level, life-satisfaction scores correlate with each one of our three measures of state capacities (fiscal, legal, and collective) and our two measures of peacefulness (absence of civil war and repression). Each one of these measures of effective states correlates with life satisfaction, with (total) correlation coefficients that range between 0.55 and 0.7 for the state capacities and 0.3 and 0.35 for the absent-violence measures.
Moreover, Figure 3.4 makes eminent sense in view of the clustering patterns in Figure 3.2. The highest values for the three state-capacity measures and the highest values of life satisfaction are found in the green-colored common-interest states. Moreover, the lowest values of the two peacefulness measures and the lowest values of life satisfaction are found in special-interest states and in weak states, with the main variation in repression coming from the special-interest cluster, and the main variation in civil war coming from the weak-state cluster.
Figure 3.4: Country-level Life Satisfaction (average Cantril Ladder scores) vs. Three State Capacities, Absence of Civil War and Absence of Repression, by State Clusters (unconditional)
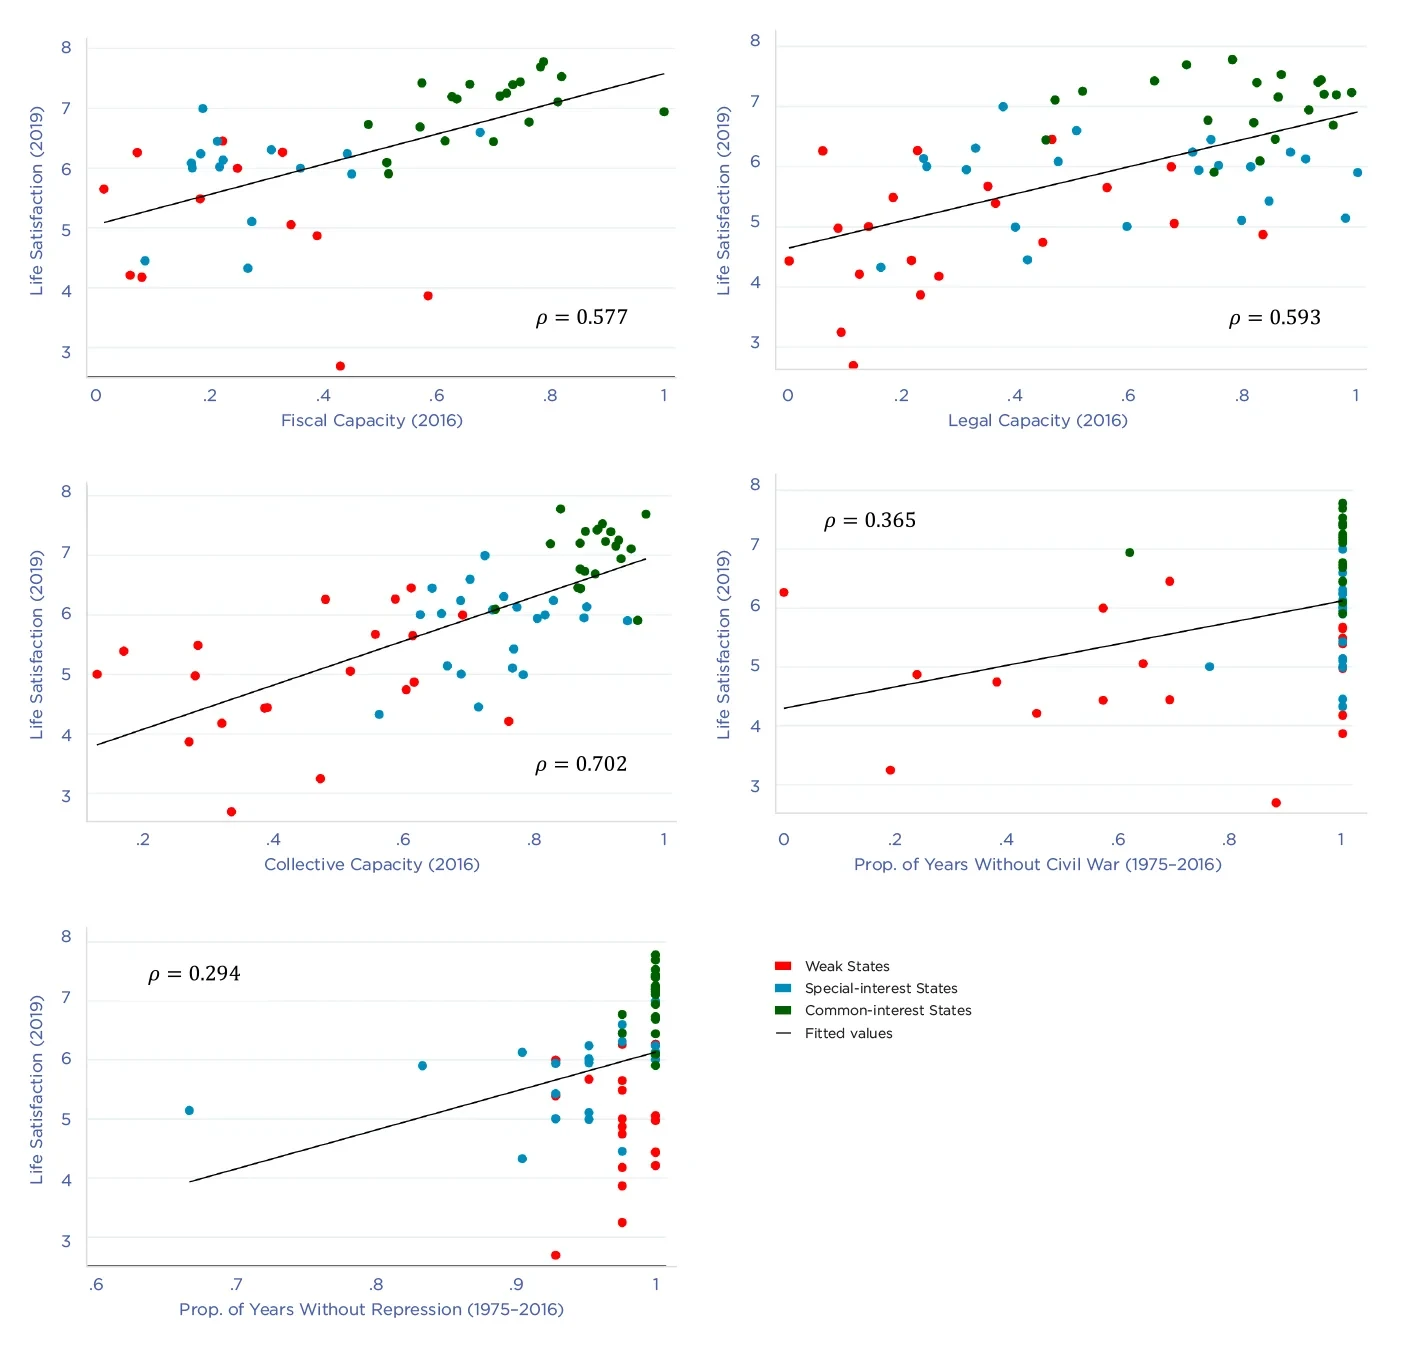
The five graphs in Figure 3.4 show the total correlation between average life satisfaction and each one of the five components of effective states --i.e., we do not hold the other components of state effectiveness constant. It is tempting to ask whether each one of these measures independently helps explain life satisfaction. However, as we have already stressed, this is a very hazardous exercise.
With this caveat in mind, we now show the partial – rather than total – correlations between life satisfaction and each measure of state effectiveness. Specifically, we show the results from a regression, which includes all measures of state effectiveness simultaneously. The regression coefficients for the five measures in Figure 3.4 (together with their 95% confidence intervals with standard errors clustered by country) appear in the left-hand graph of Figure 3.5. All the estimates are positive, as expected, but only two of the partial correlations – those for collective capacity and absence of repression – are significantly different from zero.
Figure 3.5: Regressions of Average Life Satisfaction on Separate Components of State Effectiveness (left) and on Dummies for State Clusters (right)
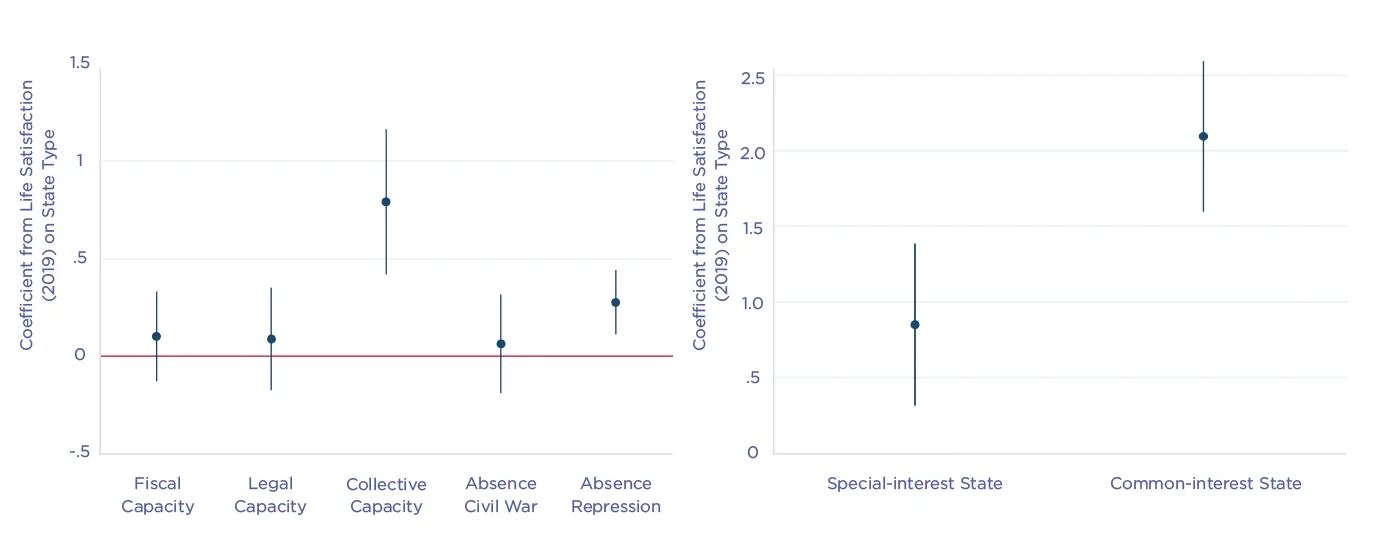
To us, these results do not represent evidence against the theory. In fact, the feedback effects as well as the common drivers we have stressed throughout the chapter mean that we cannot learn much from the individual variation in different aspects of state effectiveness.
A better approach is to use state types as a summary of state effectiveness showing that average happiness levels in countries are related to the assignment of a country to a state type. In this spirit, the right-hand graph of Figure 3.5 shows the results from a regression of average life satisfaction on two dummies, one for special-interest states and another for common-interest states (weak states being the left-out category). The classification is derived from our clustering analysis in Figure 3.2 and also corresponds to the coloring of the observations in Figures 3.3 and 3.4. As expected from those figures, both coefficients are positive and statistically significant. Moreover, they are substantial in magnitude. Living in a special-interest state, rather than a weak state, is associated with almost a full point higher score on the 10-point Cantril Ladder, while living in a common-interest state is associated with more than 2 points higher life satisfaction.[35]
This finding summarizes, in a nutshell, the main message of the chapter: a set of mutually occurring and reinforcing attributes of state performance work together to support the well-being of citizens. Moreover, although marginal improvements in state capacity and peace can be valuable, the big picture is making the transition to a common-interest state with all of its positive attributes, a transition we believe is supported by cohesive norms and institutions.
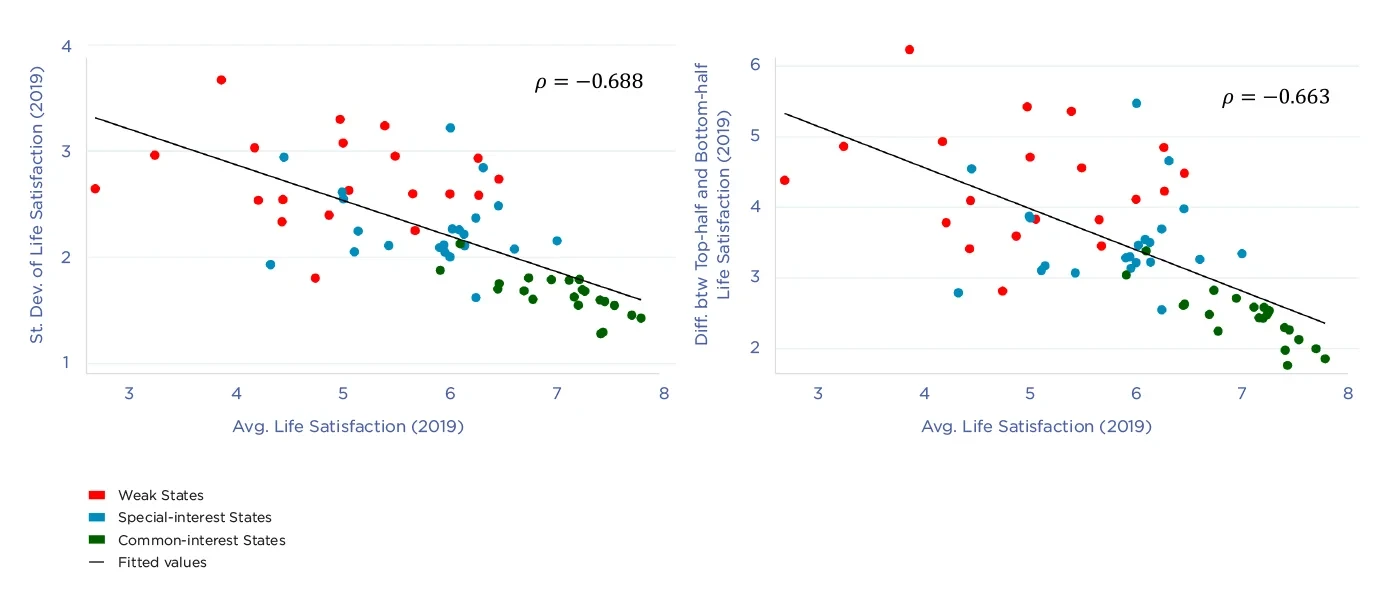
The level versus the disperion of happiness An additional implication of the theory is that we would expect the dispersion, and not just the level, of life satisfaction to vary systematically with the effectiveness of the state. This is because the cohesiveness of institutions and norms that underpins common-interest states should bring the focus on common-interest rather than special-interest benefits. This focus should show not just in the level of life satisfaction, but in a smaller dispersion of life satisfaction across people within a country. Figure 3.6 confronts this prediction with the data on life satisfaction.
The two panels in the figure plot average life satisfaction against two measures of dispersion: the standard deviation of the individual scores (to the left) and the difference between the averages in the upper and lower halves of the individual scores (to the right). Again, we color the individual country markers by the color of the cluster to which it was assigned in Figure 3.2. The figure shows the expected pattern. When average life satisfaction is high its dispersion is low, and vice versa. Further, in each one of the graphs, we find the common-interest states systematically located in the lower right corner with high levels and less inequality in life satisfaction. This finding dovetails well with the observation in Goff et al.[36] that levels of life satisfaction are negatively correlated with dispersion.
Figure 3.6: Within-Country Spread of Life Satisfaction vs. Mean Life Satisfaction (average Cantril Ladder score), by State Clusters (unconditional)
Chapter 2 redux Finally, to tie our discussion to the more conventional analysis of happiness, we now explore how our measures of state effectiveness relate to the determinants of life satisfaction discussed in Chapter 2. Specifically, consider the six determinants of life satisfaction, which are included as right-hand-side variables in the regressions underlying Table 2.1. These variables are GDP per capita, social support, healthy life expectancy, freedom to make life choices, freedom from corruption, and generosity (we refer the reader to Chapter 2 for precise definitions).
Figure 3.7: Chapter 2’s Determinants of Well-being vs. Index of State Effectiveness, by State Clusters (unconditional)
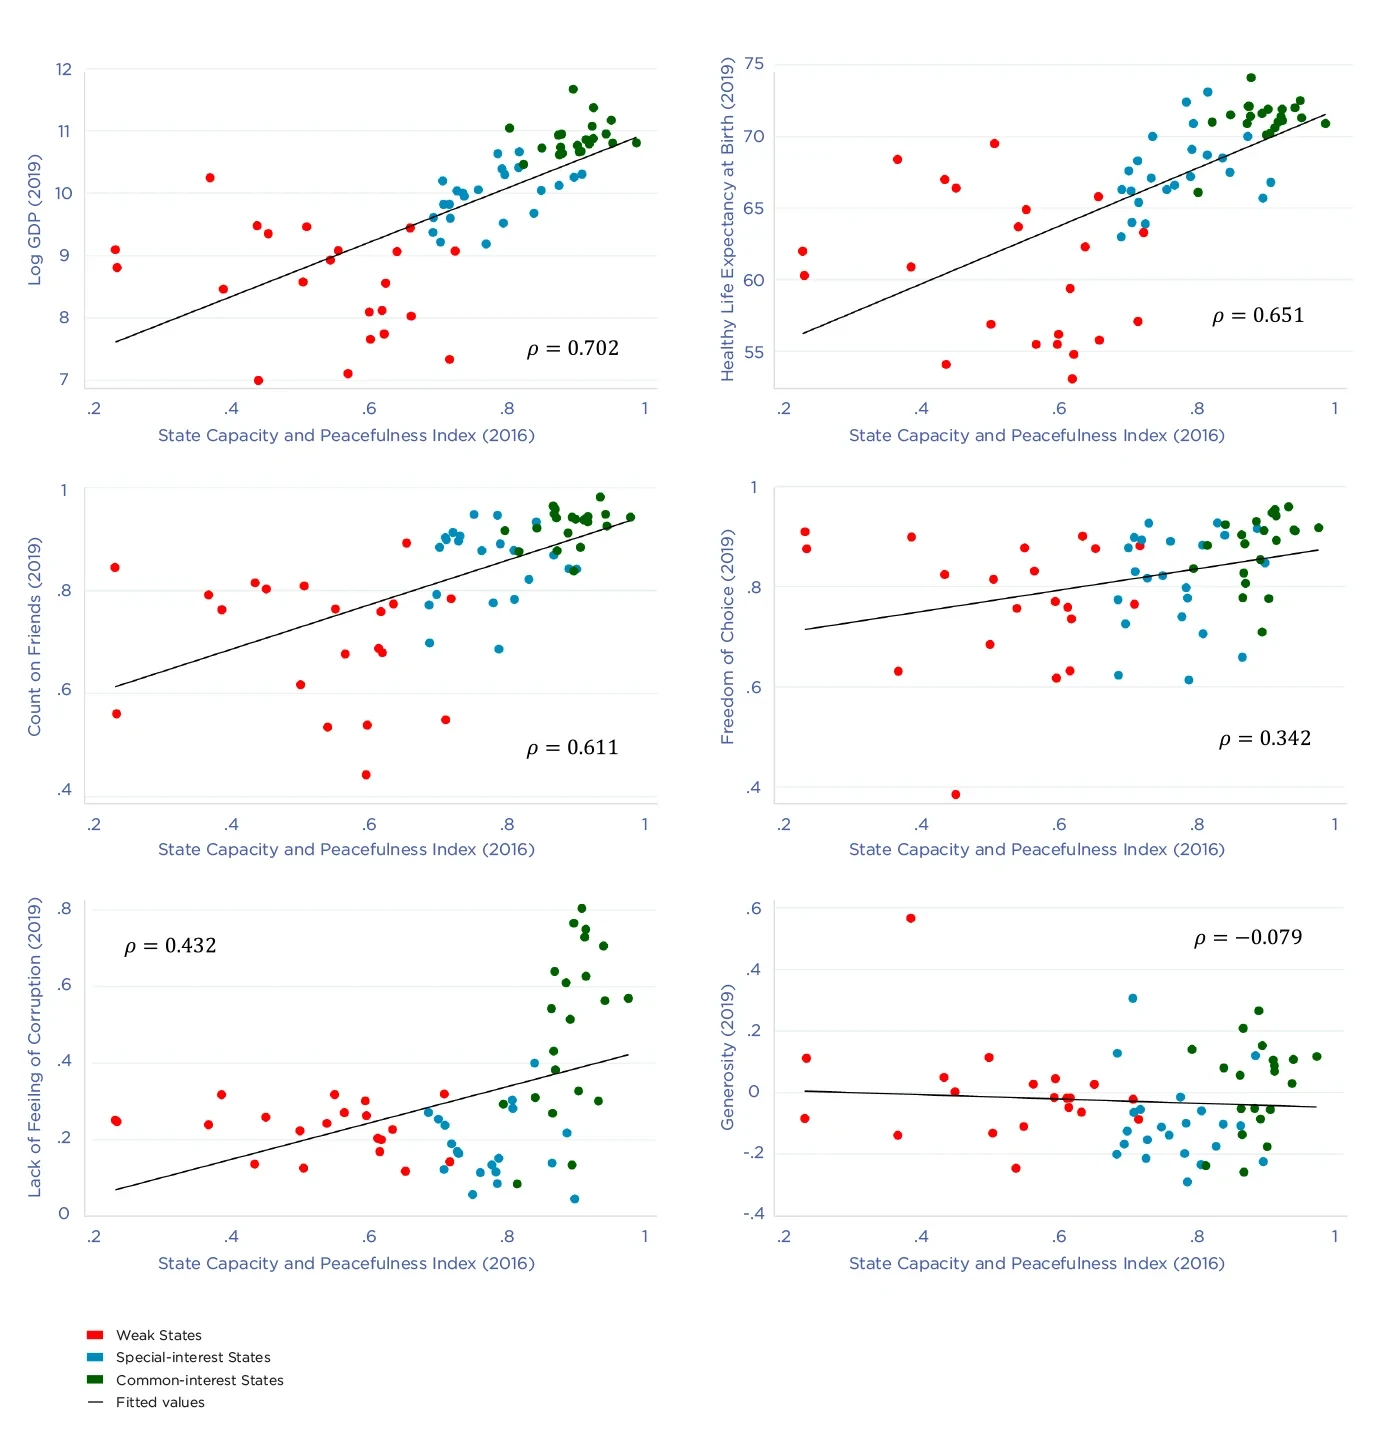
Figure 3.7 shows the relationships between, on the one hand, the average country score for each of the six Chapter 2 life-satisfaction determinants and, on the other hand, an index of state effectiveness. The latter includes our three measures of state capacities and our measure of peacefulness – thus, it coincides with our Pillars of Prosperity Index, except that we now exclude GDP per capita.[37]
The six graphs show a positive relationship with our measure of state effectiveness for five of the life-satisfaction determinants from Chapter 2, the exception being generosity (measured by private donations).[38] The positive correlation coefficients range from 0.35 to 0.7. This exercise does not take into account the fact that different aspects of state effectiveness may correlate more or less strongly with different life-satisfaction determinants. This becomes clearly visible when we disaggregate the state-effectiveness index into its subcomponents. In that case, we find that the life-satisfaction determinants relate most strongly to our measures of collective capacity and fiscal capacity.[39]
Little else is required to carry a state to the highest degree of opulence from the lowest barbarism, but peace, easy taxes, and a tolerable administration of justice; all the rest being brought about by the natural course of things" (Adam Smith, 1755).
Concluding Comments
This chapter has focused on the building blocks of effective states and their support for peace, prosperity, and happiness. This links an extensive literature in political economics with studies on the determinants of well-being. We have argued that investments in state capacities and achieving peace without repression are central elements in the creation of effective states. We have also seen that the underpinnings of those states - especially when it comes to common-interest states – appear to be conduits of life satisfaction.
Although we can pinpoint a number of factors that shape effective states, there is no magic formula; each polity has to build a solution that works in its own historical and cultural context. The cross-cutting cleavages supplied by history can be helpful or harmful in making progress. But institutions, norms, and values can help to foster common interests. However, there are few examples of progress based on external advice or conditions, no matter how well-meaning external actors may be in their attempts to help. The common-interest states that we have identified here as having the highest levels of life satisfaction have largely been crafted from the toil and vision of their own citizens.
Even though many challenges are global, it is hard to dispel the idea that nation-states remain the basic building block by which governments support the well-being of their citizens. That said, it is undeniable that judicious decentralization in some federations may offer further support for well-being. In the other direction, government action to support well-being beyond the nation-state is, at best, work in progress. Even though many things have been effectively organized in the European Union, core state capacities – like the ability to defend the territory and to raise taxes – have not. It is also difficult to identify strong supranational cohesive institutions, despite the existence of acute global challenges such as the climate problem. While the future may see more global cooperation, the basic architecture of state effectiveness is therefore likely to remain at the national level for some time to come.
References
Almond, G. A., & Verba, S. (1963). The civic culture: Political Attitudes and Democracy in Five Nations. Princeton university press.
Barro, R. J., & Lee, J. W. (2013). A new data set of educational attainment in the world, 1950–2010. Journal of development economics, 104, 184-198.
Besley, T. (2020). State Capacity, Reciprocity, and the Social Contract. Econometrica, 88(4), 1307-1335.
Besley, T., Dann, C., & Persson,T. (2021). Pillars of Prosperity: A Ten-Year Update, CEPR Discussion Paper, No. 16256.
Besley, T., & Persson, T. (2010). State Capacity, Conflict, and Development. Econometrica, 78(1), 1-34.
Besley, T., & Persson, T. (2011). Pillars of prosperity. In Pillars of Prosperity. Princeton University Press.
Besley, T., & Persson, T. (2014). The Causes and Consequences of Development Clusters: State capacity, Peace, and Income. Annual Review of Economics[, 6(1), 927-949.
Blais, A. (2006). What Affects Voter Turnout?. Annual Review of Political Science, 9, 111-125.
De Mesquita, B. B., Smith, A., Siverson, R. M., & Morrow, J. D. (2005). The Logic of Political Survival. MIT press.
Goff, L., Helliwell, J. F., & Mayraz, G. (2018). Inequality of Subjective Well-being as a Comprehensive Measure of Inequality. Economic Inquiry, 56(4), 2177-2194.
Hastie, T., Tibshirani, R., Friedman, J. H., & Friedman, J. H. (2009). The Elements of Statistical Learning: Data Mining, Inference, and Prediction (Vol. 2, pp. 1-758). Berlin: Springer.
Levi, M. (1989). Of Rule and Revenue, Berkeley: University of California Press.
Persson, T., & Tabellini, G. (2005). The Economic Effects of Constitutions. MIT press.
Nanetti, R. Y., Leonardi, R., & Putnam, R. D. (1994). Making democracy work: Civic traditions in modern Italy. Princeton: Princeton University Press.
Tilly, C. (1990). Coercion, Capital, and European states, AD 990-1992 (p. 70). Oxford: Blackwell.
Weber, M. (1919), “Politics as a Vocation,” reprinted in Hans Gerth and C. Wright Mills (eds) From Мax Weber, New York: Free Press.
Willeck, C., & Mendelberg, T. (2022). Education and Political Participation. Annual Review of Political Science, 25, 89-110.
Endnotes
Classifications come from UCDP/PRIO Armed Conflict Dataset version 19.1. ↩︎
Besley, T., & Persson, T. (2011) ↩︎
See Weber, M. (1919) ↩︎
See Besley, T., Dann, C., & Persson,T. (2021) for a discussion of data sources. The frequency of civil wars is measured using the UCDP/PRIO Armed Conflict dataset and repression is measured by the presence of political purges in the Banks Cross-National Time-Series (CNTS) Data Archive. ↩︎
The latter according to the UCDP/PRIO data are Israel and the USA. ↩︎
Namely, if V-Dem’s executive constraints variable is greater than 0.8 (corresponding to roughly the top third of the global distribution). ↩︎
See Figure 9 in Besley, T., Dann, C., & Persson,T. (2021) ↩︎
See Figure 9 in Besley, T., Dann, C., & Persson,T. (2021) ↩︎
See, for example, Tilly, C. (1990) ↩︎
See Besley, T., & Persson, T. (2014) ↩︎
https://www.worldbank.org/en/programs/business-enabling-environment/doing-business-legacy ↩︎
See Barro, R. J., & Lee, J. W. (2013) ↩︎
https://databank.worldbank.org/source/world-development-indicators ↩︎
See Besley, T., & Persson, T. (2014) ↩︎
Both these variables take on values between 0 and 1 (with higher values capturing stronger constraints). We create a binary indicator, which we set equal to 1 if the average of V-Dem’s two executive-constraints measures is greater than or equal 0.8, and 0 otherwise. Having an average greater than 0.8 corresponds to being roughly in the top third of the distribution. ↩︎
Besley, T., & Persson, T. (2011) ↩︎
This is also the focus of Bueno de Mesquita et al. (2005) and Persson, T., & Tabellini, G. (2005) ↩︎
Besley, T., & Persson, T. (2011) ↩︎
Besley, T., & Persson, T. (2010) ↩︎
See, for example, Almond, G. A., & Verba, S. (1963); Levy (1989); and Putnam et al. (1994) ↩︎
See Blais, A. (2006) for an overview of the literature on voter turnout and the factors that shape it. ↩︎
Willeck, C., & Mendelberg, T. (2022) for a review and discussion. ↩︎
See Levi, M. (1989) ↩︎
Besley, T. (2020) ↩︎
Besley, T., & Persson, T. (2011) ↩︎
Besley, T., & Persson, T. (2011) ↩︎
This is constructed as one minus the proportion of years a country has been in repression but not civil war since 1975 (multiplied by one half) and the proportion of years that a country is in civil war (but not repression) since 1975. Thus the index gives half as much weight to repression as it gives to civil war. ↩︎
Here we use a min-max normalization so it lies between zero and one. ↩︎
Besley, T., Dann, C., & Persson,T. (2021) for details on the construction of this variable. ↩︎
We use a hierarchical clustering method based on principal components (HCPC) which has two core steps; see Hastie et al. (2009, section 14.3) for further details. First, we use the raw data to create principal components of the variables of interest. This reduces the “dimensionality” of the data so as to find the number of dimensions needed to summarize the underlying variables. Second, we employ an agglomerative hierarchical clustering algorithm (Ward’s criterion) to identify clusters based on the principal components. To confirm the number of principal components, Kaiser’s criterion and the “elbow test” indicate that two components are optimal. ↩︎
As a reminder, these are income tax as a share of total tax intake, legal quality index, collective capacity index, proportion of years in repression since 1975, proportion of years in civil war since 1975, and GDP per capita. ↩︎
To understand the figure, note that the clustering analysis first takes into account the variation in civil war, repression, income, fiscal capacity, legal capacity, and collective capacity. It then uses a principal-component analysis to construct two core dimensions. One of these distinct clustering dimensions (dimension 2 in the figure) combines civil war and repression into a single component. But it also identifies civil war and repression as distinct factors, giving negative values to repression, positive values to civil war, and values around 0 to peace. ↩︎
Besley, T., Dann, C., & Persson,T. (2021) ↩︎
The weak states are: Algeria, Benin, Bolivia, Côte d’Ivoire, El Salvador, Guatemala, India, Malawi, Morocco, Myanmar, Niger, Pakistan, Paraguay, Peru, Philippines, Senegal, Sri Lanka, Togo, and Turkey. The special-interest states are: Albania, Argentina, Brazil, Bulgaria, Chile, China, Costa Rica, Cyprus, Dominican Republic, Egypt, Greece, Hungary, Iran, Jamaica, Malaysia, Mauritius, Poland, Romania, South Korea, Thailand, and Uruguay. The common-interest states are: Australia, Austria, Belgium, Canada, Finland, France, Iceland, Ireland, Italy, Japan, Luxembourg, Malta, Netherlands, New Zealand, Norway, Portugal, Spain, Sweden, Switzerland, United Kingdom, United States. ↩︎
We have tested the robustness of this core finding by redoing the clustering analysis without including income per capita as a variable. A clear cluster of common interest states still emerges and there is a strong, and statistically significant correlation between being in this group and the average level of life satisfaction. ↩︎
Goff et al. (2018) ↩︎
Of course, we need to remove GDP per capita from the Pillars of Prosperity Index here to see the relationship between state effectiveness and income in the top-left panel of Figure 3.7. ↩︎
Arguably this is not too surprising if common states look after the needs of their citizens to a point where private donations are less necessary. In the online appendix, we consider an alternative measure of (perceived) generosity: whether citizens believe a lost wallet would be returned to them by a neighbor, stranger, or the police. For example, donation rates are low in Finland, but citizens are highly likely to expect lost wallets to be returned. With this measure of generosity, we find a strong positive correlation with state effectiveness as in the other panels of Figure 3.7. ↩︎
We do not include these figures in the chapter but they are available in the online appendix. ↩︎