Towards Well-Being Measurement with Social Media Across Space, Time and Cultures: Three Generations of Progress
Acknowledgments
This research was supported by the Stanford Institute for Human-Centered Artificial Intelligence and NIH/NSF Smart and Connected Health R01 R01MH125702 and a Grant from NIH-NIAAA R01 AA028032. The work was further funded by the Swedish Research Council (2019-06305). We thank the reviewers and the World Happiness Report (WHR) team for their thoughtful comments.
Summary Abstract
Social media data has become the largest cross-sectional and longitudinal dataset on emotions, cognitions, and behaviors in human history. To use social media data, such as Twitter, to assess well-being on a large-scale promises to be cost-effective, available near real-time, and with a high spatial resolution (for example, down to town, county, or zip code levels).
The methods for assessment have undergone substantial improvement over the last decade. For example, the cross-sectional prediction of U.S. county life satisfaction from Twitter has improved from r = .37 to r = .54 (when training and comparing against CDC surveys, out-of-sample),[1] which exceeds the predictive power of log. income of r = .35.[2] Using Gallup phone surveys, Twitter-based estimation reaches accuracies of r = .62.[3] Beyond the cost-effectiveness of this unobtrusive measurement, these “big data” approaches are flexible in that they can operate at different levels of geographic aggregation (nations, states, cities, and counties) and cover a wide range of well-being constructs spanning life satisfaction, positive/negative affect, as well as the relative expression of positive traits, such as empathy and trust.[4]
Perhaps most promising, the size of the social media datasets allows for measurement in space and time down to county–month, a granularity well suited to test hypotheses about the determinants and consequences of well-being with quasi-experimental designs.
In this chapter, we propose that the methods to measure the psychological states of populations have evolved along two main axes reflecting (1) how social media data are collected, aggregated, and weighted and (2) how psychological estimates are derived from the unstructured language.
For organizational purposes, we argue that (1) the methods to aggregate data have evolved roughly over three generations. In the first generation (Gen 1), random samples of tweets (such as those obtained through Twitter’s random data feed) were aggregated – and then analyzed. In the second generation (Gen 2), Twitter data is aggregated to the person-level, so geographic or temporal language samples are analyzed as a sample of individuals rather than a collection of tweets. More advanced Gen 2 approaches also introduce person-level weights through post-stratification techniques – similar to representative phone surveys – to decrease selection biases and increase the external validity of the measurements. We suggest that we are at the beginning of the third generation of methods (Gen 3) that leverage within-person longitudinal designs (i.e., model individuals over time) in addition to the Gen 2 advances to achieve increased assessment accuracy and enable quasi-experimental research designs. Early results indicate that these newer generations of person-level methods enable digital cohort studies and may yield the greatest longitudinal stability and external validity.
The size of the social media datasets allows for measurement in space and time down to county–month
Regarding (2) how psychological states and traits are estimated from language, we briefly discuss the evolution of methods in terms of three levels (for organizational purposes), which have been discussed in prior work.[5] These are the use of dictionaries and annotated word lists (Level 1), machine-learning-based models, such as modern sentiment systems (Level 2), and large language models (Level 3).
These methods have iteratively addressed most of the prominent concerns about using noisy social media data for population estimation. Specifically, the use of machine-learning prediction models applied to open-vocabulary features (Level 2) trained on relatively reliable population estimates (such as random phone surveys) allows the language signal to fit to the “ground truth.” It implicitly addresses (a) self-presentation biases and social desirability biases (by only fitting on the signal that generalizes), as evidenced by high out-of-sample prediction accuracies. The user-level aggregation and resultant equal weighting of users in Gen 2 reduce the error due to (b) bots. Through weighting, (c) selection biases are addressed. Lastly, through tracking within-user changes in Gen 3, (d) social media estimates can yield stable longitudinal estimates beyond cross-sectional analyses, and (e) provide more nuanced methodological design control (such as through difference-in-difference or instrumental variable designs).
Taken together, social media-based measurement of well-being has come a long way. Around 2010, it started as technological demonstrations that applied simple dictionaries (designed for different applications) to noisy and unstabilized random feeds of Twitter data yielding unreliable time series estimates. With the evolution across generations of data aggregation and levels of language models, current state-of-the-art methods produce robust cross-sectional regional estimates of well-being.[6] They are just maturing to the point of producing stable longitudinal estimates that allow for the detection of meaningful changes in well-being and mental health of countries, regions, and cities.
A lot of the initial development of these methods has taken place in the U.S., mainly because most well-being survey data for training and benchmarking of the models have been collected there. However, with the maturation of the methods and reproduction of the findings by multiple labs, the approach is ready to be implemented in different countries around the world, as showcased by the Instituto Nacional de Estadística y Geografía (INEGI) of Mexico building a first such prototype.[7]
The Biggest Dataset in Human History
The need for timely well-being measurement
To achieve high-level policy goals, such as the promotion of well-being as proposed in the Sustainable Development Goals,[8] policymakers need to be able to evaluate the effectiveness of different implementations across private and public sector institutions and organizations. For that, “everyone in the world should be represented in up-to-date and timely data that can be used to measure progress and make decisions to improve people’s lives.”[9] Specifically, ongoing data about people’s well-being can help to evaluate policy, provide accountability, and help close feedback loops about what works and what does not. For such ongoing evaluation, well-being estimates are needed at higher than annual and national levels of temporal and geographic aggregation. Particularly with an eye towards under-resourced contexts and developing economies, it would be ideal if such estimates could be derived unobtrusively and cost-effectively by analyzing digital traces that populations naturally produce on social media.
The potential of social media data for population health and well-being
As perhaps the most prominent of such data sources, social media data has become the largest cross-sectional and longitudinal dataset on human emotions, cognitions, behaviors, and health in human history.[10] Social media platforms are widely used across the globe. In a survey conducted in 11 emerging economies and developing countries across a wide range of global regions (e.g., Venezuela, Kenya, India, Lebanon), social media platforms (such as Facebook) and messaging apps (such as WhatsApp) were found to be widely used. Across studied countries, a median of 64% of surveyed adults report currently using at least one social media platform or messaging app, ranging from 31 % (India) to 85% (Lebanon).[11]
Over the last decade, a literature has developed – spanning computational linguistics, computer science, the social sciences, public health, and medicine – that mines social media to understand human health, progress, and well-being. For example, social media has been used to measure mental health, including depression,[12] health behaviors, including excessive alcohol use,[13] more general public health ailments (e.g., allergies and insomnia),[14] as communicable diseases, including the flu[15] and H1N1 influenza,[16] as well as the risk for non-communicable diseases,[17] including heart disease mortality.[18]
Over the last decade, a body of research has developed – spanning computational linguistics, computer science, the social sciences, public health, and medicine – that mines social media to understand human health, progress, and well-being.
The measurement of different well-being components
Well-being is widely understood to have multiple components, including evaluative (life satisfaction), affective (positive and negative emotion), and eudaimonic components (purpose; OECD, 2013). Existing methods in the social sciences and in Natural Language Processing have been particularly well-suited to measuring the affective/emotional component of well-being. Namely, in psychology, positive and negative emotion dictionaries are available, such as those provided by the widely-used Linguistic Inquiry and Word Count (LIWC) software.[19] In Natural Language Processing, “sentiment analysis”, which aims to measure the overall affect/sentiment of texts, is widely studied by different research groups that routinely compare the performance of sentiment prediction systems on “shared tasks.”[20] As a result, social media data has typically been analyzed with emotion dictionaries and sentiment analysis to derive estimates of well-being. In reviewing the early work of well-being estimates from social media, these affect-focused analyses in combination with simple random Twitter sampling techniques, led some scholars to conclude that well-being estimates “provide satisfactory accuracy for emotional experiences, but not yet for life satisfaction.”[21]
Other researchers recently reviewed studies using social media language to assess well-being.[22] Of 45 studies, six used social media to estimate the aggregated well-being of geographies, and all of them relied on Twitter data and on emotional and sentiment dictionaries to derive their estimates. However, because life satisfaction is generally more widely surveyed than affective well-being, five of the six studies used life satisfaction as an outcome against which the language-based (affect) estimates were validated; only one study[23] also included independent positive and negative affect measures to compare the language measures against (at the county level, from Gallup).
Thus, taken together, there is a divergence in this nascent literature on geographic well-being estimation between the predominant measurement methods that foreground affective well-being (such as modern sentiment systems) and available data sources for geographic validation that often rely on evaluative well-being. This mismatch between the well-being construct of measurement and validation is somewhat alleviated by the fact that – particularly under geographic aggregationaffective and evaluative well-being inter-correlate moderately to highly.
As we will discuss in this chapter, recent methodological advancements have resulted in high convergent validity also for social-media-predicted evaluative well-being (e.g., see Fig. 5.5). If social media data is first aggregated to the person-level (before geographic aggregation) and a language model is specifically trained to derive life satisfaction, the estimates show higher convergent validity with survey-reported life satisfaction than with survey-reported affect (happiness). Thus, specific well-being components should ideally be measured with tailored language models, which can be done based on separately collected training data.[24]
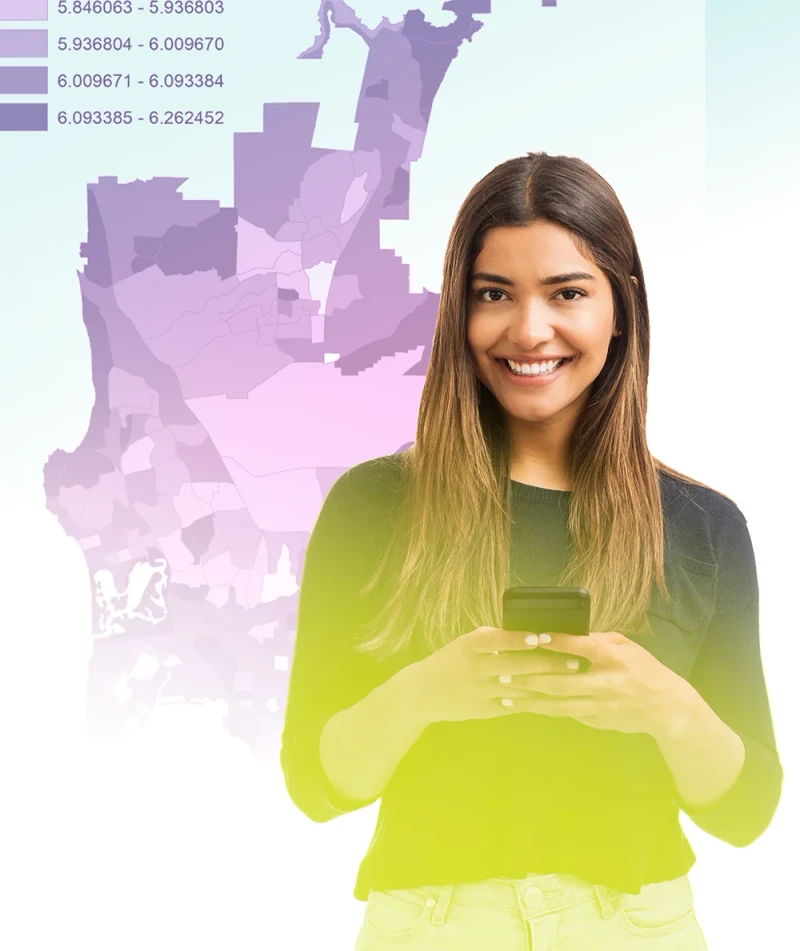
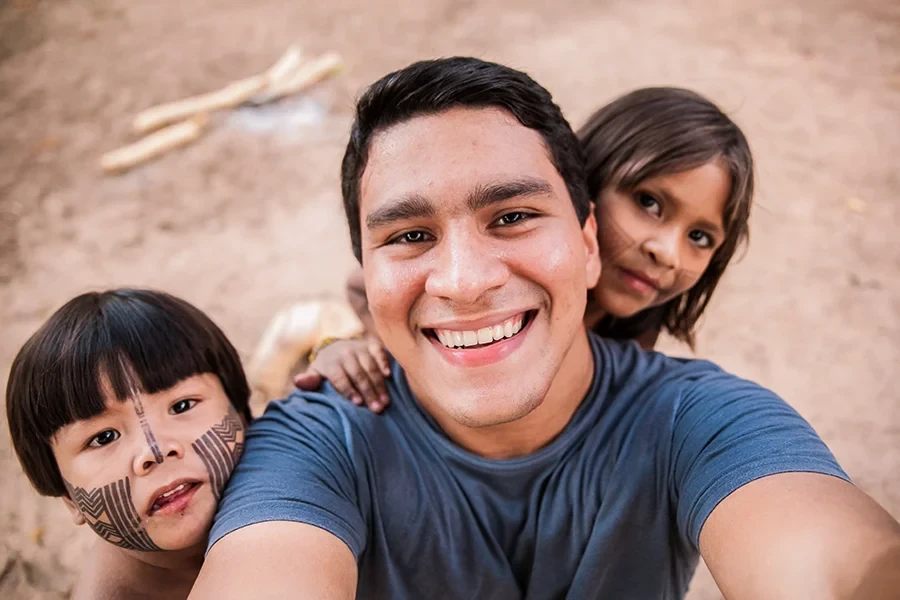
Figure 5.1: Scalable population measurement of well-being through Twitter
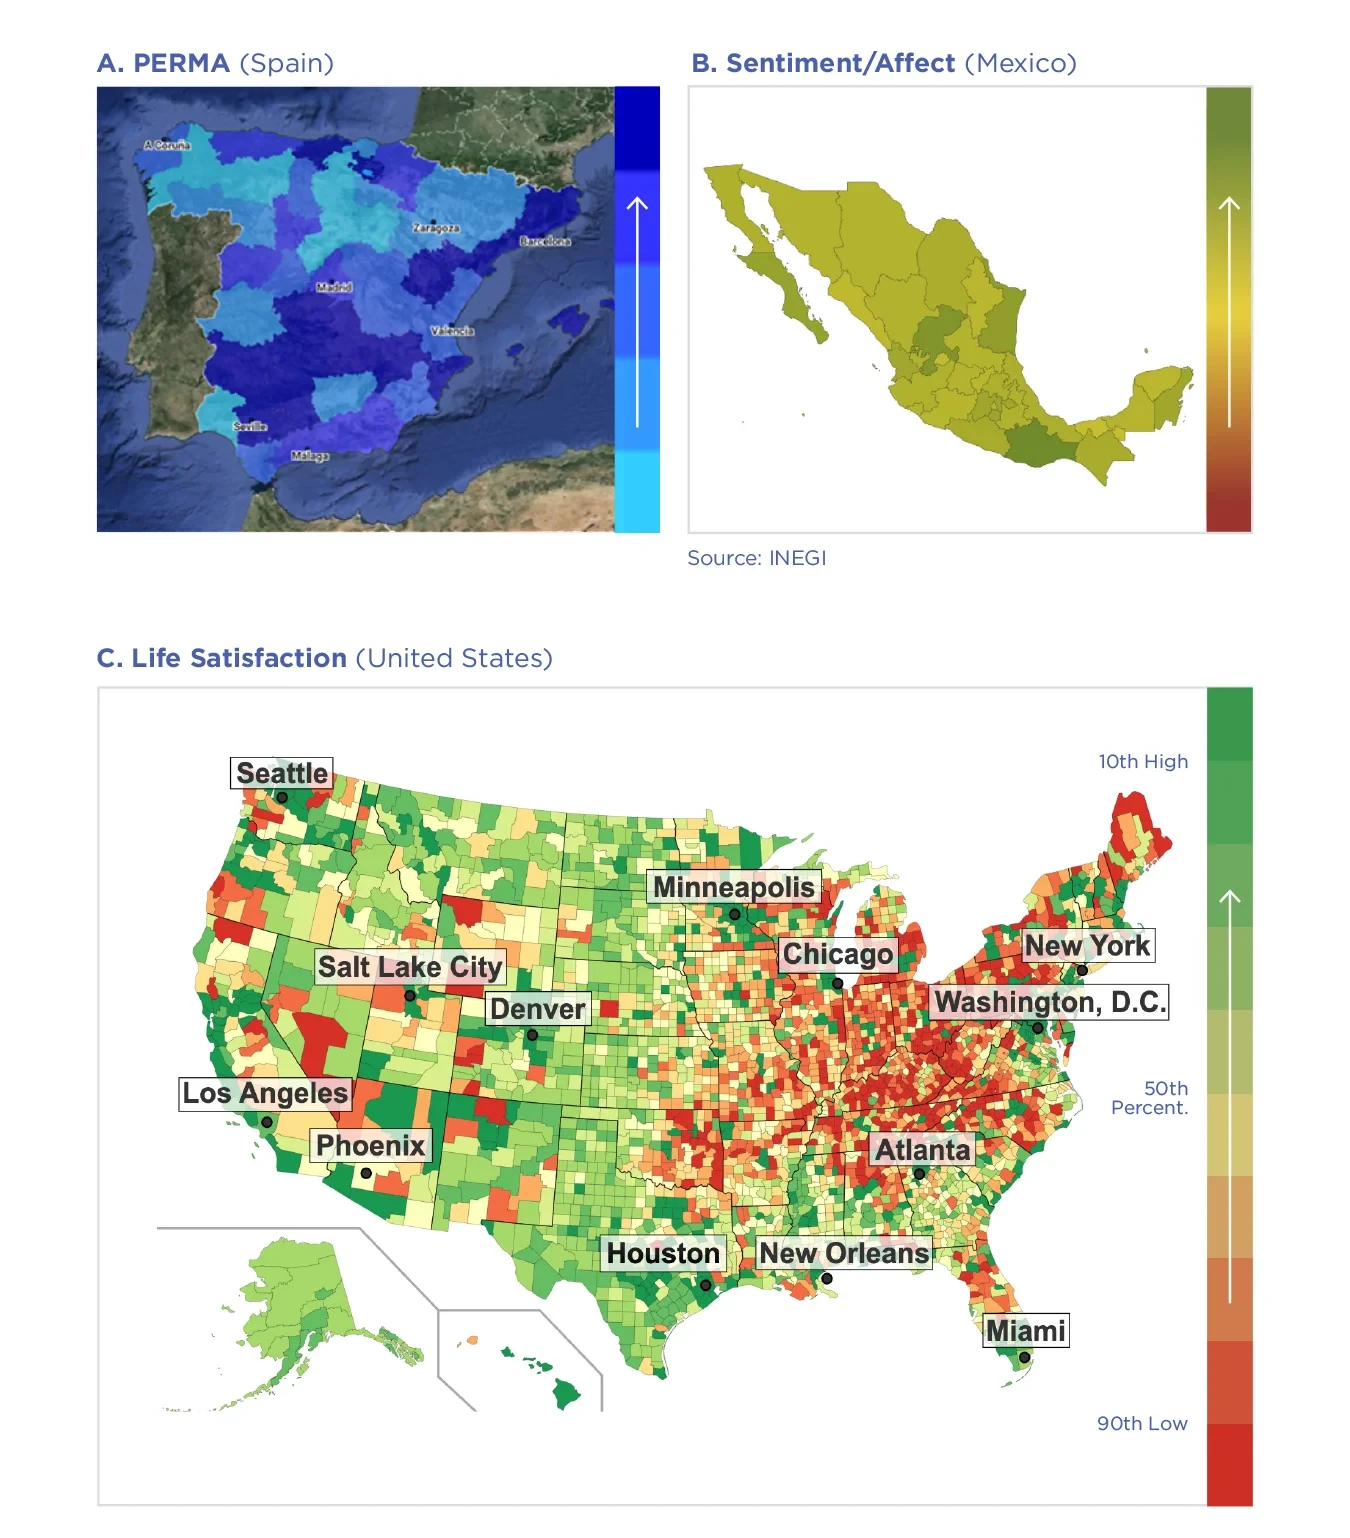
Figure. 5.1 showcases international examples in which different well-being components were predicted through Twitter language, including a “PERMA” well-being map for Spain estimating levels of Positive Emotions, Engagement, Relationships, Meaning, and Accomplishment,[25] a sentiment-based map for Mexico,[26] and a life-satisfaction map for the U.S.[27]
Figure 5.1: Scalable population measurement of well-being through Twitter. A: in Spain, based on 2015 Twitter data and Spanish well-being language models measuring PERMA: Positive Emotions, Engagement, Relationships, Meaning, and Accomplishment based on custom dictionaries,[28] B: in Mexico, built on Spanish sentiment models and provided by a web dashboard through Mexico’s Instituto Nacional de Estadística y Geografía,[29] and C: for U.S. counties,[30] with interpolation of missing counties provided through a Gaussian process model using demographic and socioeconomic similarity between counties.[31]
The advantages of social media: “retroactive” measurement and multi-construct flexibility
Social media data have the advantage of being constantly “banked,” that is, stored unobtrusively. This means that it can be accessed at a later point in time and analyzed retroactively. This data collection is done, at minimum, by the tech companies themselves (such as Twitter, Facebook, and Reddit), but the data may also be accessible to researchers, such as through Twitter’s academic Application Programming Interface (an automatic interface). This means that when unpredictable events occur (e.g., natural disasters or a mass unemployment event), it is not only possible to observe the post-event impact on well-being for a given specific geographic area but, in principle, to derive pre-event baselines retroactively for comparison. While similar comparisons may also be possible with extant well-being survey data, such data are rarely available with high spatial or temporal resolution and are generally limited to a few common constructs (such as Life Satisfaction).
Language is a natural way for individuals to describe complex mental states, experiences, and desires.
Second, language is a natural way for individuals to describe complex mental states, experiences, and desires. Consequently, the richness of social media language data allows for the retrospective estimation of different constructs, extending beyond the set of currently measured well-being dimensions such as positive emotion and life satisfaction. For example, a language-based measurement model (trained today) to estimate the new construct of “balance and harmony”[32] can be retroactively applied to historical Twitter data to quantify the expression of this construct over the last few years. In this way, social-media-based estimations can complement existing survey-data collections with the potential for flexible coverage of additional constructs for specific regions for present and past periods. This flexibility inherent in the social-media-based measurement of well-being may be particularly desirable as the field moves to consider other conceptualizations of well-being beyond the typical Western concepts (such as life satisfaction), as these, too, can be flexibly derived from social media language.[33]
Data sources such as Twitter and Reddit have different selection and presentation biases and are generally noisy, with shifting patterns of language use over time.
The Evolution of Social Media Well-Being Analyses
Analyzing social media data is not without challenges. Data sources such as Twitter and Reddit have different selection and presentation biases and are generally noisy, with shifting patterns of language use over time. As data sources, they are relatively new to the scientific community. To realize the potential of social media-based estimation of well-being constructs, it is essential to analyze social media data in a way that maximizes the signal-to-noise ratio. Despite the literature being relatively nascent, the methods for analyzing social media language to assess psychological traits and states are maturing. To date, we have seen evolution along two main axes of development: Data collection/aggregation strategies and language models (see Table 5.1 for a high-level overview).
| Sampling and data aggregation methods | Language models |
|---|---|
| Gen 1: Aggregation of random posts | Level 1: Closed vocabulary (curated or word-annotation-based dictionaries) |
| Gen 2: Aggregation across persons | Level 2: Open vocabulary (data-driven AI, ML predictions) |
| Gen 3: Aggregation across a longitudinal cohort design | Level 3: Contextual representations (large pre-trained language models) |
Note. AI = Artificial Intelligence, ML= Machine Learning. See Table 5.2 for more information about the three generations of data aggregation methods and Table 5.3 for the three levels of language models.
The first axis of development – data collection and aggregation strategies – can be categorized into three generations which have produced stepwise increases in prediction accuracies and reductions in the impact of sources of error, such as bots (detailed in Table 2):
Gen 1: Aggregation of random posts (i.e., treating each communities’ posts as unstructured “bags of posts”).
Gen 2: Person-level sampling and aggregation of posts, with the potential to correct for sample biases (i.e., aggregation across persons).
Gen 3: Aggregation across a longitudinal cohort design (i.e., creating digital cohorts in which users are followed over time and temporal trends are described by extrapolating from the changes observed within users).
The second axis of development – language models – describes how language is analyzed; that is, how numerical well-being estimates are derived from language. We argue that these have advanced stepwise, which we refer to as Levels for organizational purposes. These iterations improve the accuracy with which the distribution of language use is mapped onto estimates of well-being (see Table 3 for a detailed overview). The Levels have advanced from closed-vocabulary (dictionary-based) methods to machine learning and large language model methods that ingest the whole vocabulary.[34] We propose the following three levels of developmental stages in language models:
Level 1: Closed-vocabulary approaches use word-frequency counts that are derived based on defined or crowdsourced (annotation-based) dictionaries, such as for sentiment (e.g., ANEW[35]) or word categories (e.g., Linguistic Inquiry and Word Count 2015 or 2022).[36]
Level 2: Open-vocabulary approaches use data-driven machine learning predictions. Here, words, phrases, or topic features (e.g., LDA)[37] are extracted and used as inputs in supervised machine learning models, in which language patterns are automatically detected.
Level 3: Contextual word embedding approaches use large language models to represent words in their context; so, for example, “down” is represented differently in “I’m feeling down” as compared with “I’m down for it.” Pre-trained models include BERT,[38] RoBERTa,[39] and BLOOM.[40]
Generations and Levels increase the complexity with which data is processed and analyzed – and typically also, as we detail below, the accuracy of the resultant well-being estimates.
The out-of-sample prediction accuracies of the machine learning models demonstrate empirically that these biases can be handled.
Addressing social media biases
The language samples from social media are noisy and can suffer from a variety of biases, and unfamiliar audiences sometimes dismiss social-media-based measurement on these grounds. We discuss them in relation to selection, sampling, and presentation biases.
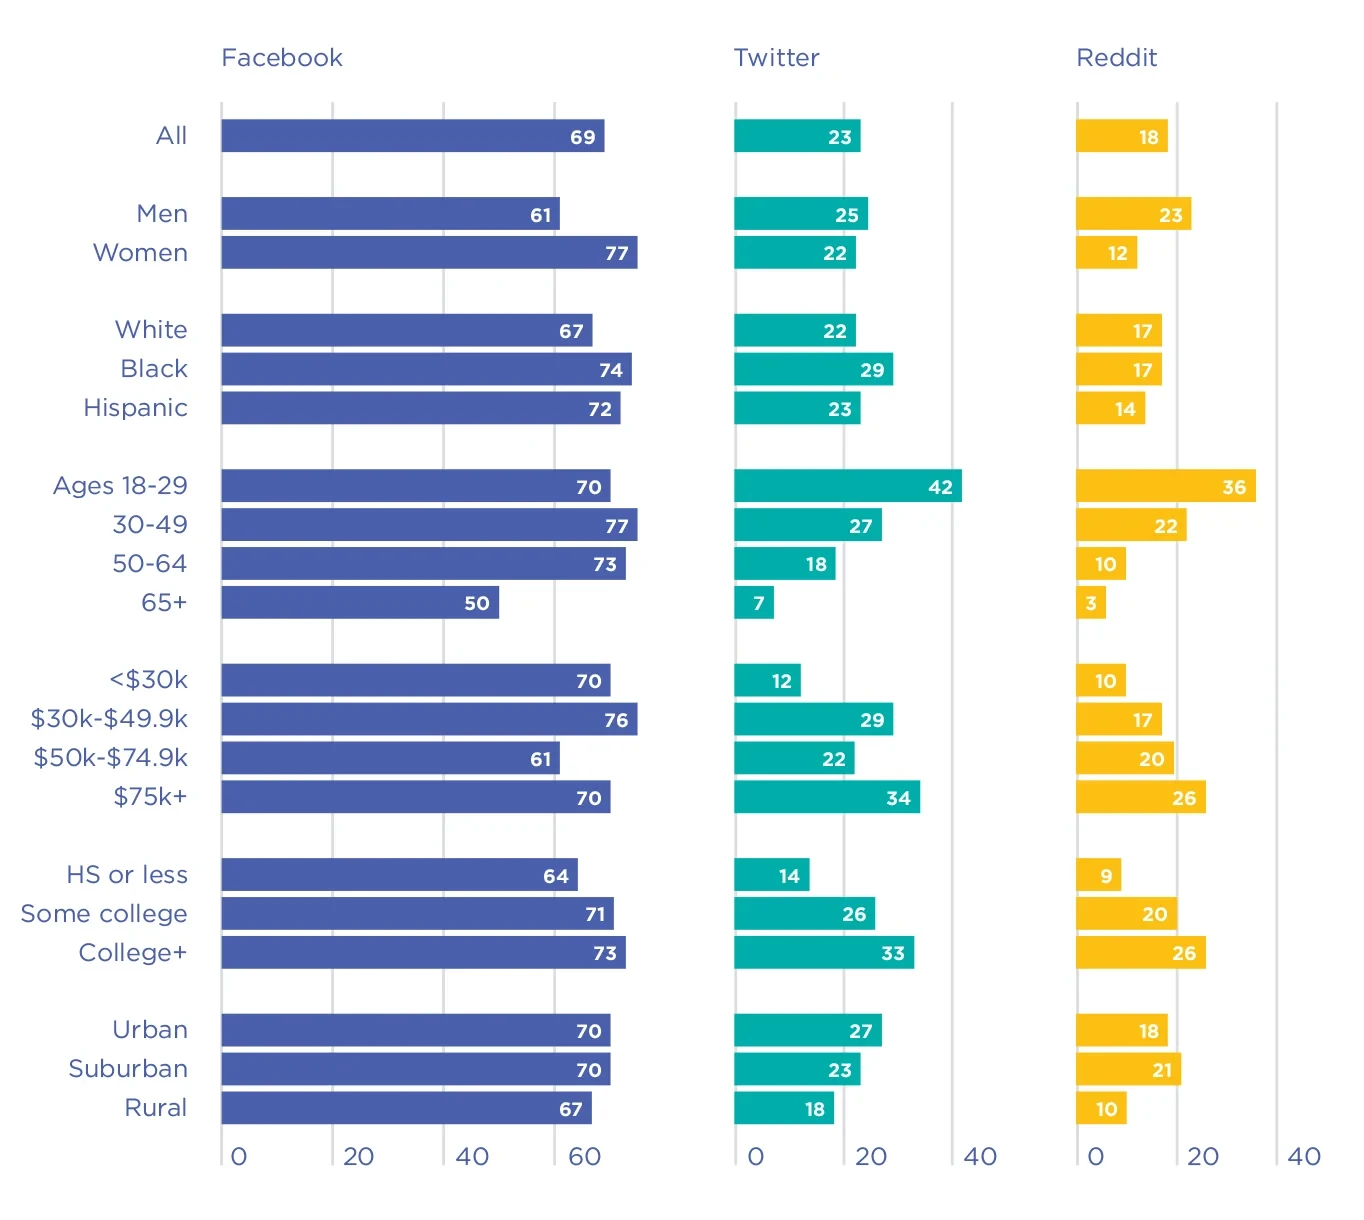
Selection biases include demographic and sampling biases. Demographic biases – i.e., that individuals on social media platforms are not representative of the larger population (refer to Figure 5.2),[41] reveal concerns that assessments do not generalize to a population with another demographic structure. Generally, social media platforms differ from the general population; Twitter users, for example, tend to be younger and more educated than the general U.S. population.[42] These biases can be addressed in several ways; for example, demographic biases can be addressed by applying post-stratification weights to better match the target population on important demographic variables.[43]
Sampling biases involve concerns that a few accounts generate the majority of content,[44] including super-posting social bots, and organizational accounts, which in turn have a disproportionate influence on the estimates. Robust techniques to address these sampling biases, such as person-level aggregation, largely remove the disproportionate impact of super-posting accounts.[45] It is also possible to identify and remove social bots with high accuracy (see break-out Box 5.1).[46]
Presentation biases include self-presentation (or impression management), and social desirability biases, and involve concerns that individuals “put on a face” and only present curated aspects of themselves and their life to evoke a positive perception of themselves.[47] However, empirical studies indicate that these biases have a limited effect on machine learning algorithms that take the whole vocabulary into account (rather than merely counting keywords). As discussed below, machine-learning-based estimates (Level 2) reliably converge with non-social-media assessments, such as aggregated survey responses (out-of-sample convergence above Pearson r of .60).[48] These estimates thus provide an empirical upper limit on the extent that these biases can influence machine learning algorithms.
Taken together, despite the widespread prima facie concern about selection, sampling, and presentation biases, the out-of-sample prediction accuracies of the machine learning models demonstrate empirically that these biases can be handled[49] – as we discuss below.
Figure 5.2. Percentage of adults using each social media platform within each demographic group in the US[50]
| Data sampling and aggregation method | Typical examples | Advantages | Disadvantages | |
|---|---|---|---|---|
| Gen 1: Past (2010–) | Aggregation of (Pseudo) Random Sampling of Posts | Aggregate posts geographically, extract language features, use machine learning to predict outcomes (cross-sectionally) | Relatively easy to implement (e.g., random Twitter API + sentiment model). | Suffers from the disproportionate impact of super-posting accounts (e.g., bots). For longitudinal applications: A new random sample of individuals in every temporal period. |
| Gen 2: Present (2018–) | Person-Level Aggregation and Sampling (some with sample bias correction) | Person-level aggregation[51] and poststratification to adjust the sample towards a more representative sample (e.g., U.S. Census).[52] | Addresses the impact of super-posting social media users (e.g., bots). With post-stratification: known sample demographics and correction for sample biases. Increases measurement reliability and external validity. | For longitudinal applications: A new random sample of individuals in every temporal period. |
| Gen 3: Near future | Digital Cohort Sampling (following the same individuals over time) | Robust mental health assessments in time and space through social media language analyses.[53] | All of Gen 2 + Increases the temporal stability of estimates. Defined resolution across time and space (e.g., county-months), enables quasi-experimental designs | Higher complexity in collecting person-level time series data (security, data warehousing). Difficult to collect enough data for higher spatiotemporal resolutions (e.g., county-day). |
| Language analysis approach | Proto-typical | Examples | Advantages | Disadvantages | |
|---|---|---|---|---|---|
| Level 1 | Closed-vocabulary, or crowdsourced dictionaries | Word-frequency counts are derived based on defined dictionaries such as sentiment or word categories. | LIWC | Straightforward, easy-to-use software interface (LIWC). Good for understanding the same patterns in language use across studies (e.g., use of pronouns). | Top-down approaches typically rely on hand-coded categories defined by researchers. Most words have multiple words senses, which human raters do not anticipate; e.g., “I feel great” and “I am in great sorrow.”[54] Dictionaries without weights (like LIWC) may insufficiently capture differences in valence between words (e.g., good vs. fantastic). |
| Level 2 | Open-vocabulary, data-driven ML or AI predictions | Words, phrases, or topic features are extracted, filtered (based on [co-]occurrence), and used as inputs for machine learning models. | Words | Data-driven, bottom-up, unsupervised methods rely on the statistical patterns of word use (rather than subjective evaluations). Words are represented with high precision (not just binary). Topics can naturally appear and provide basic handling of word sense ambiguities. | Numerical representations do not take context into account. Data-driven units of analysis (such as topics) can be challenging to compare across studies. |
| Level 3 | Contextual representations, large language models | Contextualized word embeddings through self-attention. | Transformer models: BERT RoBERTa | Produces state-of-the-art representations of text. Takes context into account. Disambiguates word meaning. Leverages large internet corpora. | Computationally resource-intensive (needs GPUs). Semantic biases: transformers models get their representations of text from the structure of the training dataset (corpus) that is used; this involves the risk of reproducing existing biases in the corpus (N.b.: there are methods to examine and reduce these biases). |
AI = Artificial Intelligence; ML = Machine Learning; LabMT = Language Assessment by Mechanical Turk (LabMT) word list (Dodds et al., 2015); ANEW = Affective Norms for English Words (Bradley & Lang, 1999); LIWC = Linguistic Inquiry and Word Count (Boyd et al., 2022; Pennebaker et al., 2001); Warriner’s ANEW – a list with 13915 words (Warriner et al., 2013). LSA = Latent Semantic Analysis (Deerwester et al., 1990); LDA = (Blei et al., 2003); BERT = Bidirectional Encoder Representations from Transformers (Devlin et al., 2019); RoBERTa = Robustly Optimized Bidirectional Encoder Representations from Transformers Pretraining Approach (Y. Liu et al., 2019); BLOOM = BigScience Large Open-science Open-access Multilingual Language Model. GPU = Graphical Processing Units (Graphics Cards)
Box 5.1: Effects of bots on social media measurement
On social media, bots are accounts that automatically generate content, such as for marketing purposes, political messages, and misinformation (fake news). Recent estimates suggest that 8 – 18% of Twitter accounts are bots[55] and that these accounts tend to stay active for between 6 months to 2.5 years.[56] Historically, bots were used to spread unsolicited content or malware, inflate follower numbers, and generate content via retweets.[57] More recently, bots have been found to play a large part in spreading information from low-credibility sources; for example, targeting individuals with many followers through mentions and replies.[58] More sophisticated bots, namely social spambots, are now interacting with and mimicking humans while evading standard detection techniques.[59] There is concern that the growing sophistication of generative language models (such as GPT) may lead to a new generation of bots that become increasingly harder to distinguish from human users.
How bots impact measurement of well-being using social media
The content generated by bots should not, of course, influence the assessment of human well-being. While bots compose fewer original tweets than humans, they have been shown to express sentiment and happiness patterns that differ from the human population.[60] Applying the person-level aggregation (Gen 2) technique effectively limits the bot problem since all their generated content is aggregated into a single “data point.” Additional heuristics, such as removing retweets, should minimize the bot problem by removing content from retweet bots. Finally, work has shown that bots exhibit extremely average human-like characteristics, such as estimated age and gender.[61] Thus, applying post-stratification techniques down-weight bots in the aggregation process since accounts with average demographics will be over-represented in the sample. With modern machine learning systems, bots can be detected and removed.[62]
Generations of sampling and data aggregation methods
The following methodological review is organized by generations of data aggregation methods (Gen 1, 2, and 3), which we observed to be the primary methodological choice when working with social media data. But within these generations, the most important distinction in terms of reliability is the transition from dictionary-based (word-level) Level 1 approaches to those relying on machine learning to train language models (Level 2) and beyond.

Gen 1: Random Samples of Social Media Posts
Initially, a prototypical example of analyzing social media language for population assessments involved simply aggregating posts geographically or temporally – e.g., a random sample of tweets from the U.S. for a given day. In this approach, the aggregation of language is carried out based on a naive sampling of posts – without taking into account the people writing them (see Fig. 5.3).
The language analysis was typically done using a Level 1 closed-vocabulary approach – for example, the LIWC positive emotion dictionary was applied to word counts. Later, Level 2 approaches have been used with random samples of tweets, such as open-vocabulary approaches based on machine learning; this includes using modern sentiment systems or predicting county-level Gallup well-being survey outcomes directly using machine learning cross-sectionally.
Figure 5.3. Example of a Gen 1 Twitter pipeline: A pseudo-random collection of tweets is aggregated directly to the county level.

Gen 1 with Level 1 dictionary/annotation-based methods
In the U.S. In 2010, Kramer analyzed 100 million Facebook users’ posts using word counts based on the Linguistic Inquiry and Word Count (LIWC) 2007 positive and negative emotions dictionaries (Gen 1, Level 1).[63] The well-being index was created as the difference between the standardized (z-scored) relative frequencies of the LIWC 2007 positive and negative emotion dictionaries. However, the well-being index of users was only weakly correlated with users’ responses to the Satisfaction with life scale,[64] a finding that was replicated in later work[65] in a sample of more than 24,000 Facebook users.
Surprisingly, SWLS scores and negative emotion dictionary frequencies correlated positively across days (r = .13), weeks (r = .37), and months (r = .72), whereas the positive emotion dictionary showed no significant correlation. This presented some early evidence that using Level 1 closed-vocabulary methods (here in the form of LIWC 2007 dictionaries) can yield unreliable and implausible results.
Moving from LIWC dictionaries to crowdsourced annotations of single words, the Hedonometer project (ongoing, https://hedonometer.org/, Fig. 5.4A)[66] aims to assess the happiness of Americans on a large scale by analyzing language expressions from Twitter (Gen 1, Level 1; Fig. 5.4B).[67] The words are assigned a happiness score (ranging from 1 = sad to 9 = happy) from a crowdsourced dictionary of 10,000 common words called LabMT (“Language Assessment By Mechanical Turk”).[68] The LabMT dictionary has been used to show spatial variations in happiness over timescales ranging from hours to years[69] – and geospatially across states, cities,[70] and neighborhoods[71] based on random feeds of tweets.
However, applying the LabMT dictionary to geographically aggregated Twitter language can yield unreliable and implausible results. Some researchers examined spatially high-resolution well-being assessments of neighborhoods in San Diego using the LabMT dictionary[72] (see Fig. 5.4C). The estimates were, however, negatively associated with self-reported mental health at the level of census tracts (and not at all when controlling for neighborhood factors such as demographic variables). Other researchers found additional implausible results; using person-to-county-aggregated Twitter data[73] (Gen 2), LabMT estimates of 1,208 US counties and Gallup-reported county Life Satisfaction have been observed to anti-correlate, which is further discussed below (see Fig 5.5).
Outside in the U.S. To date, Gen 1 approaches have been applied broadly, in different countries, with different languages. In China, it has been used for assessing positive and negative emotions (e.g., joy, love, anger, and anxiety) on a national level across days, months, and years using blog posts (63,505 blogs from Sina.com by 316 bloggers) from 2008 to 2013 (Gen 1, Level 1).[74] A dictionary targeting subjective well-being for Chinese, Ren-CECps-SWB 2.0 was used for this purpose, spanning 17,961 entries. The validation involved examining the face validity of the resulting time series by comparing the highs and lows of the index with national events in China.
In Turkey, sentiment analysis has been applied to 35 million tweets posted between 2013 and 2014 by more than 20,000 individuals (Gen 1, Level 1).[75] More than 35 million tweets were analyzed using the Turkish sentiment dictionary “Zemberek”.[76] However, the index did not significantly correlate with well-being from the province survey results of the Turkish Statistical Institute (see supplementary material for additional international studies).
In general, applying dictionary-based (Level 1) approaches to random Twitter samples (Gen 1) has been the most common choice across research groups around the world, but results have generally not been validated in the literature beyond the publication of maps time series.
Figure 5.4. The Hedonometer measures happiness by analyzing keywords from random Twitter feeds – across A) time based on a 10% random Twitter feed,[77] B) U.S. States[78] and C) Census tracts.[79]
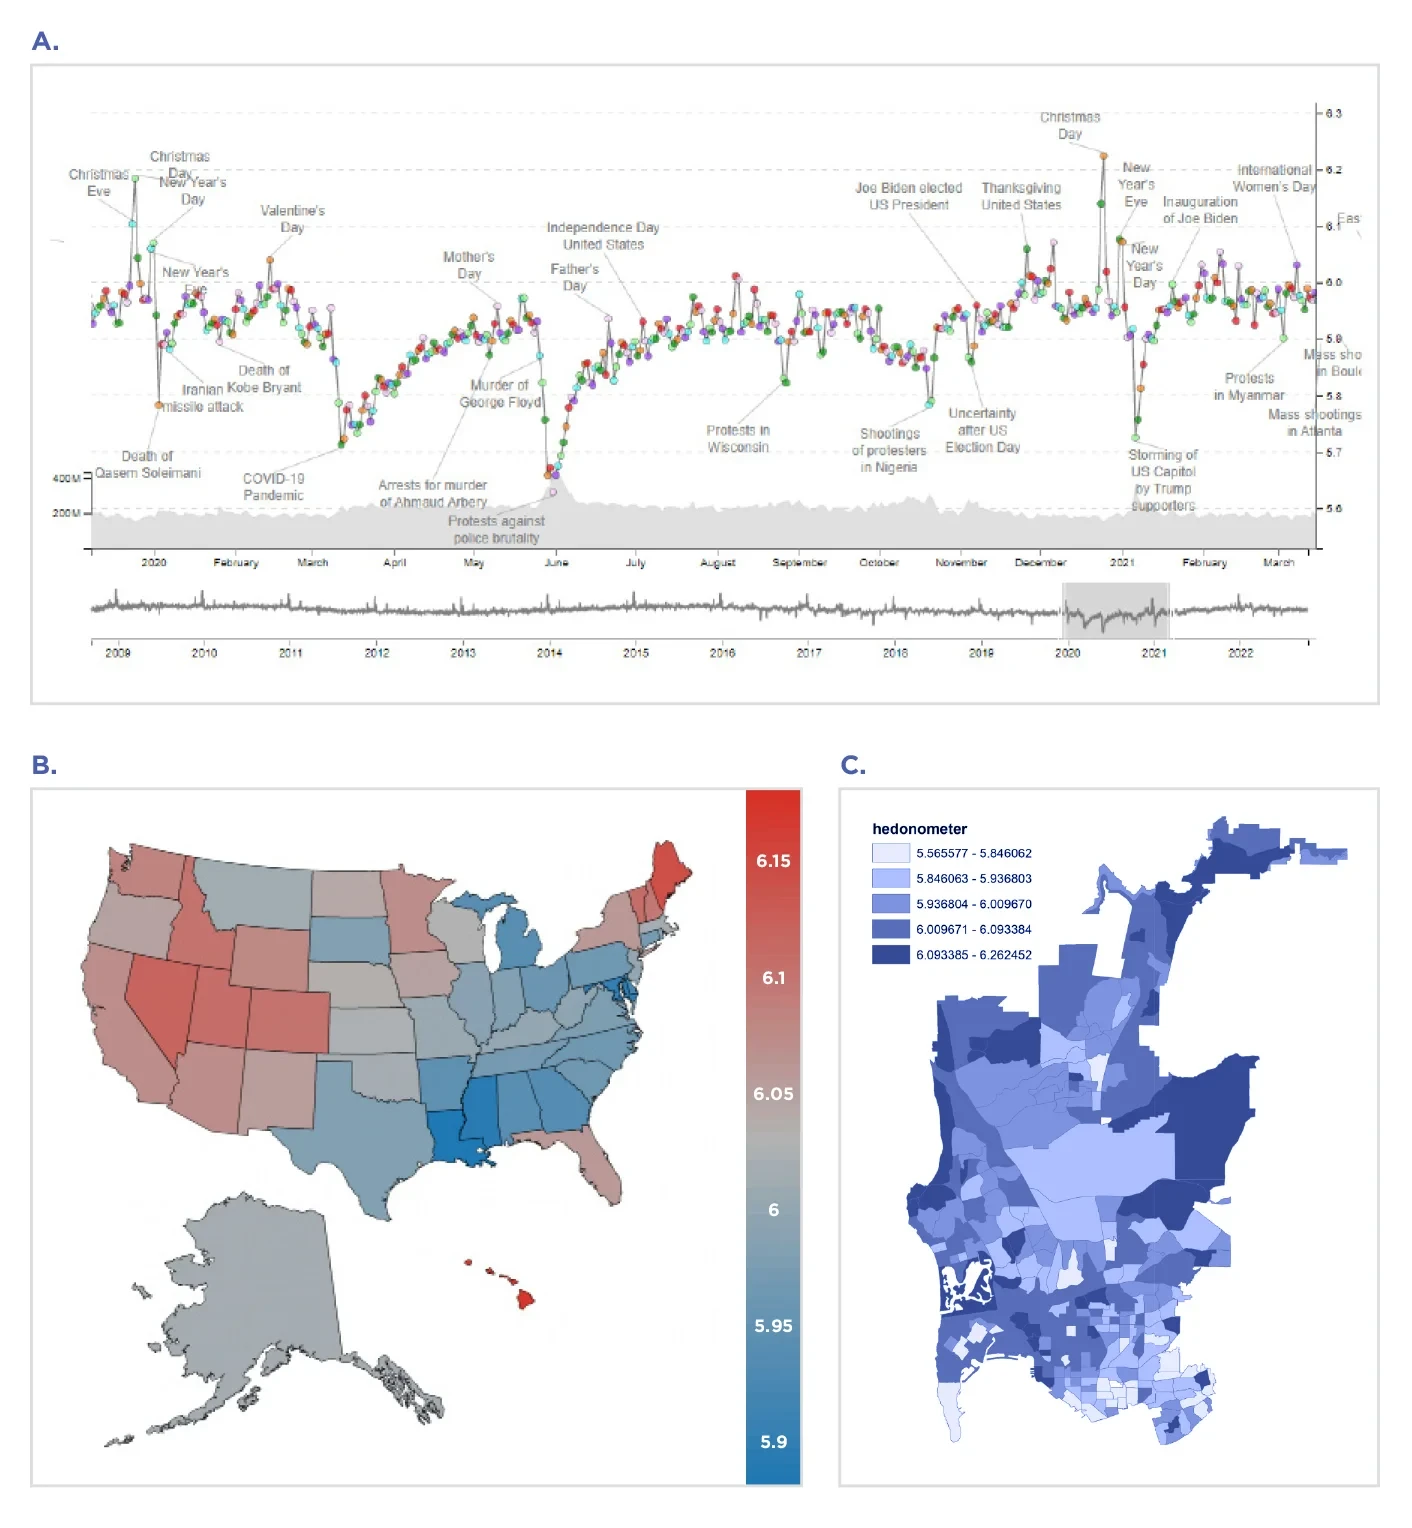
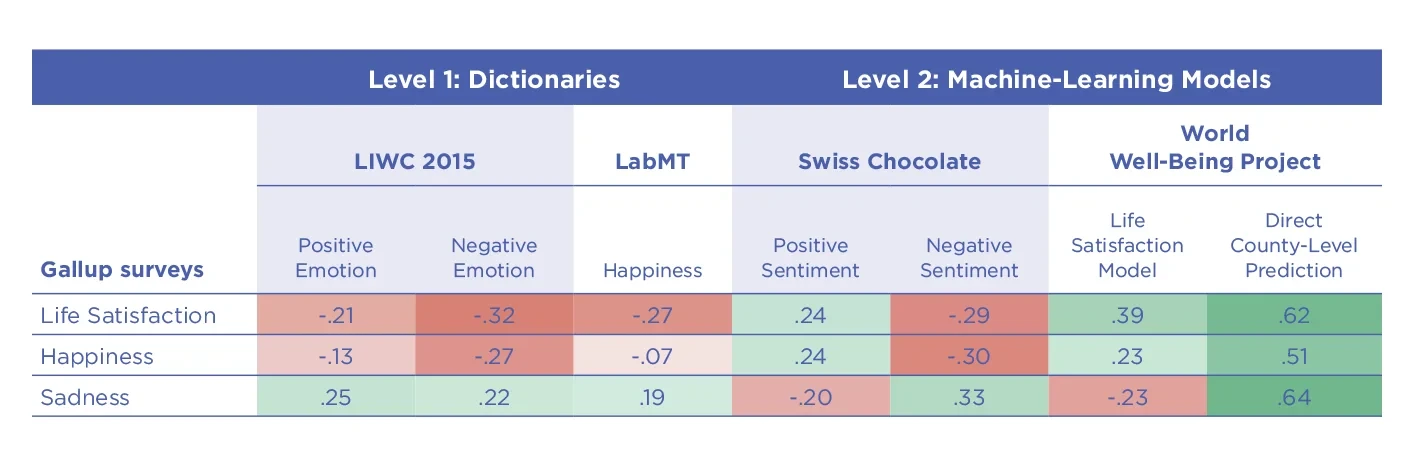
Figure 5.5. Using different kinds (“levels”) of language models in the prediction for Gallup-reported county-level Life Satisfaction, Happiness, and Sadness (using a Gen 2: User-level-aggregated 2009-2015 10% Twitter dataset) across 1,208 US counties. Level 2-based estimates, such as those based on Swiss Chocolate – a modern Sentiment system derived through machine learning – yield consistent results.[80] However, estimates derived through the Level 1 Linguistic Inquiry and Word Count (LIWC 2015) Positive Emotions dictionary or the word-level annotation-based Language Assessment by Mechanical Turk (labMT) dictionary anti-correlate with the county-level Gallup-reported survey measure for Life Satisfaction.[81]
Gen 1 using Level 2 machine learning methods
More advanced language analysis approaches, including Level 2 (machine learning) and Level 3 (large language models), have been applied to random Twitter feeds. For example, random tweets aggregated to the U.S. county level were used to predict life satisfaction (r = .31; 1,293 counties)[82] and heart disease mortality rates (r = .42, 95% CI = [.38, .45]; 1,347 counties; Gen 1, Level 1–2);[83] in these studies, machine learning models were applied to open-vocabulary words, phrases, and topics (see supplementary material for social media estimates with a spatial resolution below the county level).
In addition, researchers have used text data from discussion forums at a large online newspaper (Der Standard) and Twitter language to capture the temporal dynamics of individuals’ moods.[84] Readers of the newspaper (N = 268,128 responses) were asked to rate their mood of the preceding day (response format: “good,” “somewhat good,” “somewhat bad,” or “bad”), which were aggregated to the national level (Gen 1, Level 1 and 3).[85] Language analyses based on a combination of Level 1 (German adaptation of LIWC 2001)[86] and Level 3 (German Sentiment, based on contextual embeddings, BERT) yielded high agreement across days with the aggregated Der Standard self-reports over 20 days (r =.93 [.82, .97]). Similarly, in a preregistered replication, estimates from Twitter language (more than 500,000 tweets by Austrian Twitter users) correlated with the same daily-aggregated self-reported mood at r = .63 (.26, .84).
Gen 1: Random post aggregation - Summary
To aggregate random tweets directly into geographic estimates is intuitively straightforward and relatively easy to implement; and it has been used for over a decade (2010+). However, it is susceptible to many types of noise, such as changing sample composition over time, inconsistent posting patterns, and the disproportionate impact of super-posting accounts (e.g., bots, see Box 5.1), which may decrease measurement accuracy.
Gen 2: Person-Level Sampling of Twitter Feeds
Measurement accuracies can be increased substantively by improving the sampling and aggregation methods, especially by aggregating tweets first to the person level. Person-level sampling addresses the disproportionate impact that a small number of highly active accounts can have on geographic estimates. In addition to person-level sampling, demographic person characteristics (such as age and gender) can be estimated through language, and on their basis, post-stratification weights can be determined, which is similar to the methods used in representative phone surveys (see Fig. 5.6 for a method sketch). This approach shows remarkable improvements in accuracy (see Fig. 5.7).
Gen 2 with Level 1 dictionary/annotation-based methods
One of the earliest examples of Gen 2 evaluated the predictive accuracy of community-level language (as measured with Level 1 dictionaries such as LIWC) across 27 health-related outcomes, such as obesity and mentally unhealthy days.[87] Importantly, this work evaluated several aggregation methods, including random samples of posts (Gen 1 methods) and a person-focused approach (Gen 2). This person-focused aggregation significantly outperformed (in terms of out-of-sample predictive accuracy) the Gen 1 aggregation methods with an accuracy (average Pearson r across all 27 health outcomes) of .59 for Gen 1 vs. .63 for Gen 2.
Gen 2 using Level 2 machine learning methods
User-level aggregation. Some researchers have proposed a Level 2 person-centered approach, which first measures word frequencies at the person-level and then averages those frequencies to the county-level, effectively yielding a county language average across users.[88] Furthermore, through sensitivity analyses, this work calibrated minimum thresholds on both the number of tweets needed per person (30 tweets or more) and the number of people needed per county to produce stable county-level language estimates (at least 100 people), which are standard techniques in geo-spatial analysis.[89] Across several prediction tasks, including estimating life satisfaction, the Gen 2 outperformed Gen 1 approaches, as seen in Fig. 5.7. Additional work has shown that Gen 2 language estimates show how external validity (e.g., language estimates of county-level personality correlate with survey-based measures) and are robust to spatial autocorrelations (i.e., county correlations are not an artifact of, or dependent on, the physical spatial nature of the data).[90]
The person-centered approach has also been expanded to consider who uses social media relative to their respective community.
Correction for representativeness. One common limitation with work on social media text is selection bias – the social media sample is not representative of the population from which we would like to infer additional information. The person-centered approach has also been expanded to consider who uses social media relative to their respective community. When using state-of-the-art machine learning approaches, sociodemographics (such as age, gender, income, and education) can be estimated for each Twitter user from their social media language, thus allowing for the measurement of the sociodemographic makeup of the sample.[91] Comparing the sociodemographic distribution of the sample to the population’s distribution gives a measure of Twitter users’ degree of over- or under-presentation. This comparison can be used to reweight each user’s language estimate in the county-aggregation process using post-stratification techniques commonly used in demography and public health.[92] Applying these reweighting techniques to closed vocabulary (e.g., LIWC dictionaries, Level 1)[93] and open-vocabulary features (e.g., LDA topics, Level 2)[94] increased predictive accuracy above that of previous Gen 2 methods (see Fig. 5.7, top).
Averaging across genders. In chapter 4 of the World Happiness Report 2022 (WHR 2022), the authors[95] report results from a study that assessed emotions, including happy/joy/positive affect, sadness, and fear/anxiety/scared over two years in the U.K. Prior work has found demographics like gender and age to impact patterns in language use more than personality and are thus important confounding variables to consider when analyzing language use.[96] The authors in chapter 4 of the WHR 2022,[97] separately derived (and then combined) gender-specific estimates from Twitter data using both Level 1 (LIWC) and Level 3 (contextualized word embeddings; RoBERTa) approaches.[98] Twitter-estimated joy correlated at r = .55 [.27, .75] with YouGov reported happiness over eight months from November 2020 to June 2021.
Person-level aggregation can down-weight highly active accounts and minimize the influences of bots.
Gen 2 person-level aggregation – Summary
Person-level Gen 2 methods are built on a decade of research using Gen 1 random feed aggregation methods based on the (in hindsight obvious) intuition that communities are groups of people who produce language rather than a random assortment of tweets. This intuition has several methodological advantages. First, person-level aggregation treats each person as a single observation, which can down-weight highly active accounts and minimize the influences of bots or organizations. Second, it paves the way for addressing selection biases as one can now weight each person in the sample according to their representativeness in the population. Furthermore, these methods can be applied to any digital data. Finally, these methods more closely reflect the methodological approaches in demography and public health that survey people and lay the foundation for tracking digital cohorts over time (Gen 3).
Figure 5.6. Example of a Gen 2 Twitter pipeline: Person-level aggregation and post-stratification.
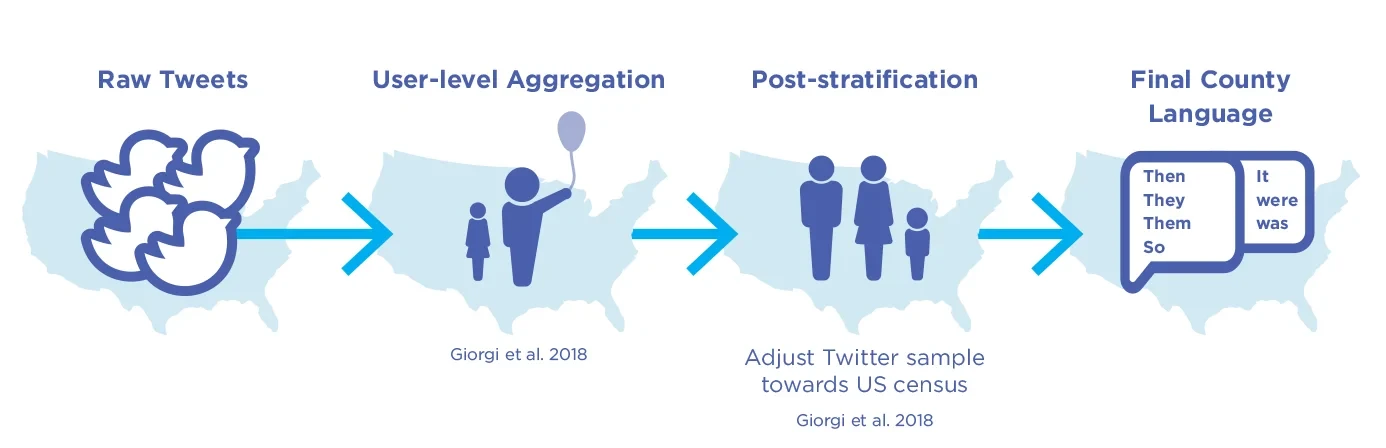
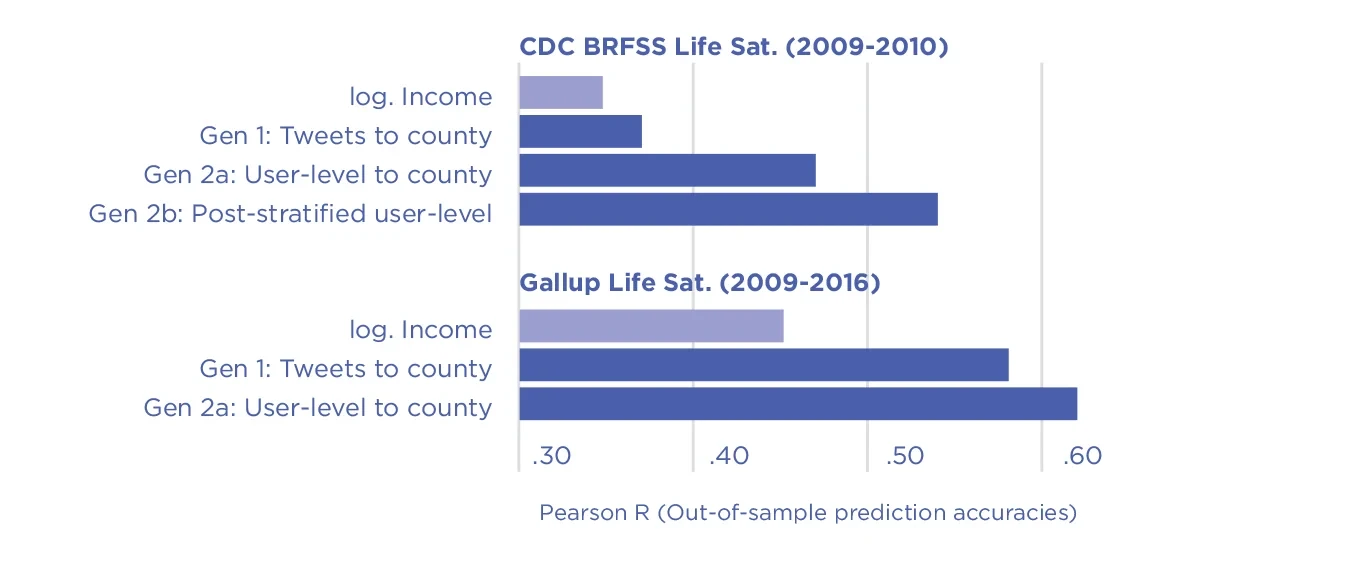
Figure 5.7. Cross-sectional Twitter-based county-level cross-validated prediction performances using (Gen 1) direct aggregation of tweets to counties, Gen 2a: person-level aggregation before county aggregation, and Gen 2b: robust post-stratification based on age, gender, income, and education.[99] Life satisfaction values were obtained from: Top, the CDC’s Behavioral Risk Factor Surveillance System (BRFSS) estimates (2009 to 2010, N = 1,951 counties)[100]; Bottom: the Gallup-Sharecare Well-Being Index (2009-2016, N = 1,208 counties).[101] Twitter data was the same in both cases, spanning a random 10% sample of Twitter collected from 2009-2015.[102] Publicly released here.
Gen 3: Digital Cohort Sampling – the Future of Longitudinal Measurement
Most of the work discussed thus far has been constrained to cross-sectional, between-community analysis, but social media offers high-resolution measurement over time at a level that is not practically feasible with survey-based methods (e.g., the potential for daily measurement at the community level). This abundance of time-specific psychological signals has motivated much prior work. In fact, a lot of early work using social media text datasets focused heavily on longitudinal analyses, ranging from predicting stock market indices using sentiment and mood lexicons (Gen 1, Level 1)[103] to evaluating the temporal diurnal variation of positive and negative affect within individuals expressed in Twitter feeds (Gen 1, Level 1).[104] For example, some analyses showed that individuals tend to wake up with a positive mood that decreases over the day.[105]
This early work on longitudinal measurement seemed to fade after one of the most iconic projects, Google Flu Trends (Gen 1, Level 1),[106] began to produce strikingly erroneous results.[107] Google Flu Trends monitored search queries for keywords associated with the flu; this approach could detect a flu outbreak up to a week ahead of the Center for Disease Control and Prevention’s (CDC’s) reports. While the CDC traditionally detected flu outbreaks from healthcare provider intake counts; Google sought to detect the flu from something people often do much earlier when they fall sick – google their symptoms.
However, Google Flu Trends had a critical flaw – it could not fully consider the context of language;[108] for example, it could not distinguish symptom discussions because of concerns around the bird flu from that of describing one’s own symptoms. This came to a head in 2013 when its estimates turned out to be nearly double those from the health systems.[109] In short, this approach was susceptible to these kinds of noisy influences partly because it relied on random time series analyzed primarily with dictionary-based (keyword) approaches (Gen 1 and Level 1).
After the errors of Google Flu Trends were revealed, interest at large subsided, but research within Natural Language Processing began to address this flaw, drawing on machine learning methods (Level 2 and 3). For infectious diseases, researchers have shown that topic modeling techniques could distinguish mentions of one’s symptoms from other medical discussions.[110] For well-being, as previously discussed, techniques have moved beyond using lists of words assumed to signify well-being (by experts or annotators; Level 1) to estimates relying on machine learning techniques to empirically link words to accepted well-being outcomes (often cross-validated out-of-sample; Level 2).[111] Most recently, large language models such as (contextualized word embeddings, RoBERTa) have been used to distinguish the context of words (Level 3).[112] Here, we discuss what we believe will be the third generation of methods that take the person-level sampling and selection bias correction of Gen 2 and combine them with longitudinal sampling and study designs.
Pioneering digital cohort samples
Preliminary results from ongoing research demonstrate the potential of longitudinal digital cohort sampling (Fig. 5.8). This takes a step beyond user-level sampling while enabling tracking variance in well-being outcomes across time: Changes in well-being are estimated as the aggregate of the within-person changes observed in the sample. Digital cohort sampling presents several new opportunities. Changes in well-being and mental health can be assessed at both the individual and (surrounding) group level, opening the door to studying their interaction. Further, short-term (weekly) and long-term patterns (changes on multi-year time scales) can be discovered. Finally, the longitudinal design unlocks quasi-experimental designs, such as difference-in-difference, instrumental variable or regression discontinuity designs. For example, trends in socioeconomically matched counties can be compared to study the impact of specific events, such as pandemic lockdowns, large-scale unemployment, or natural disasters.
Short-term (weekly) and long-term patterns (changes on multi-year time scales) can be discovered.
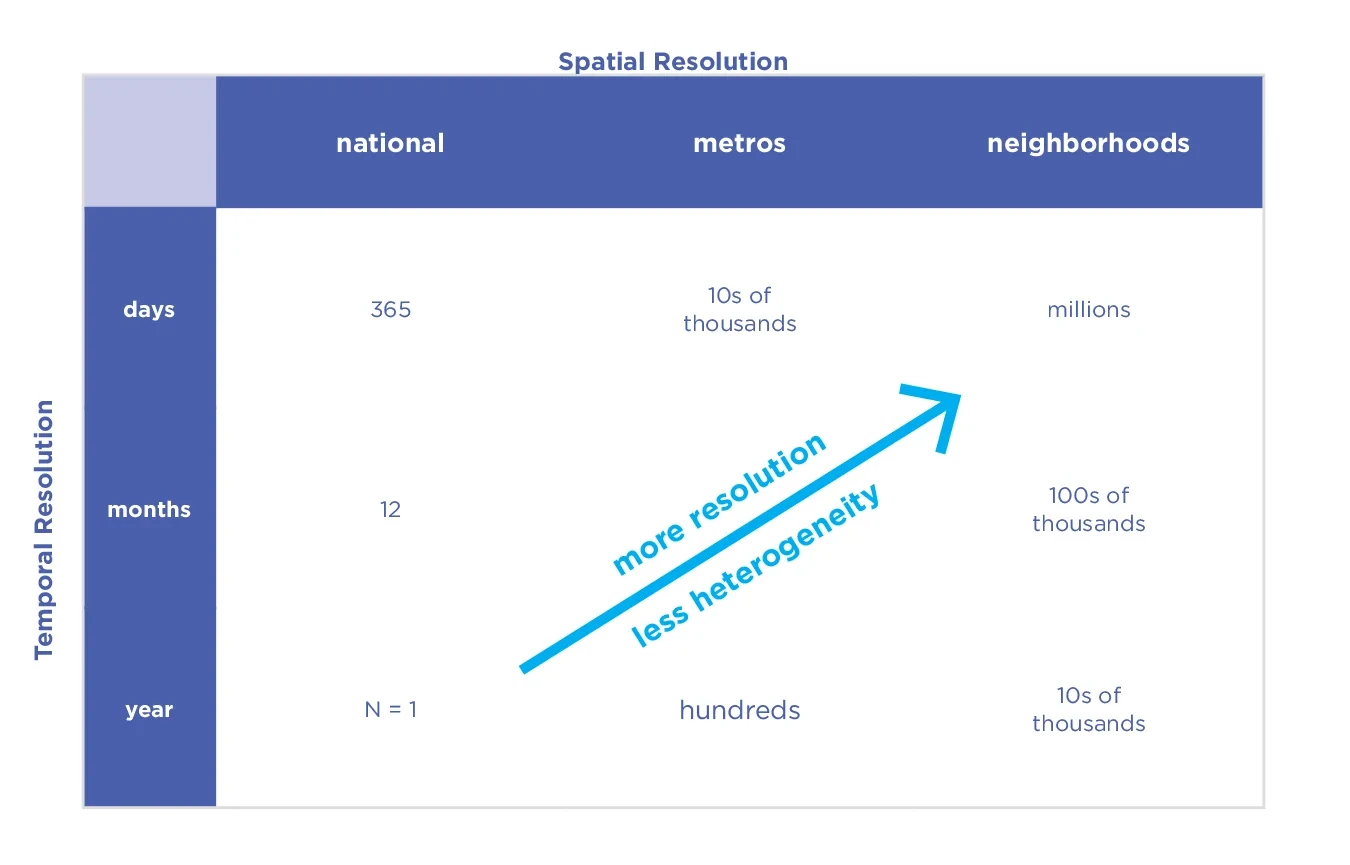
The choice of spatiotemporal resolution. Social media data is particularly suitable for longitudinal designs since many people frequently engage with social media. For example, in the U.S., 38% of respondents reported interacting with others “once per day or more” through one of the top five social media platforms (this ranges from 19% in India to 59% in Brazil across seven countries).[113] Even in research studies conducted by university research labs, sample sizes of more than 1% of the U.S. population are feasible (e.g., the County-Tweet Lexical Bank with 6.1 million Twitter users).[114] In principle, such an abundance of data allows for high resolution in both space and time, such as estimates for county–weeks (see Fig. 5.9). The higher resolution can provide economists and policymakers with more fine-grained, reliable information that can be used for evaluating the impact of policies within a quasi-experimental framework.
Enabling data linkage. Estimates at the county-month level also appear to be well-suited for data linkage with the population surveillance projects in population health (for example, the Office of National Drug Control Policy’s [ONDCP] Non-Fatal Opioid Overdose Tracker) and serve as suitable predictors of sensitive time-varying health outcomes, such as county-level changes in rates of low birth weights. The principled and stabilized estimation of county-level time series opens the door for social-media-based measurements to be integrated with the larger ecosystem of datasets designed to capture health and well-being
Figure 5.8. Example of a Gen 3 Twitter pipeline: longitudinal digital cohorts compose spatial units.
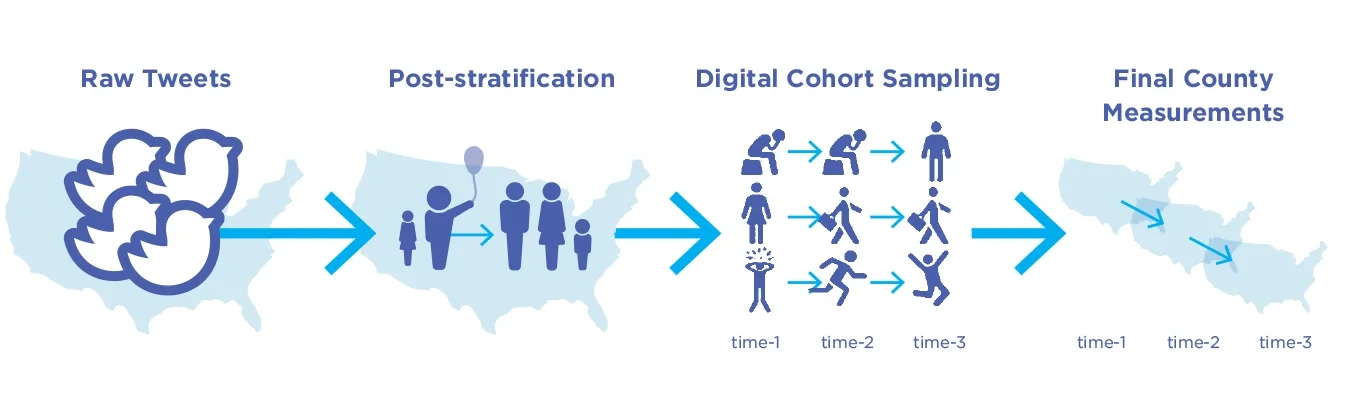
Figure 5.9. The number of measurement data points produced as a function of different choices of temporal and spatial resolution in digital cohort design studies (Gen 3).
Forthcoming work: Well-being and mental health assessment in time and space
Studies employing digital cohorts have only recently emerged (i.e., preliminary studies in preprints) related to tracking the opioid epidemic from social media. For example, some researchers (Gen 3, Level 1) use Reddit forum data to identify and follow more than 1.5 million individuals geolocated to a state and city to test relationships between discussion topics and changes in opioid mortality rate.[115] Similarly, other researchers (Gen 3, Level 2) tracks opioid rates of a cohort of counties to predict future changes in opioid mortality rates. Albeit utilizing coarse-grained temporal resolutions (i.e., annual estimates), these works lay a foundation of within-person and within-community cohort designs that can be mirrored for well-being monitoring at scale.[116]
The field is on the verge of combining Gen 3 sampling and aggregation with Level 3 contextualized embedding-based language analyses (Gen 3, Level 3), which will provide state-of-the-art resolutions and accuracies.
Gen 3 digital cohort designs – Summary and Limitations
The digital cohort approach comes with the advantages of the person-level approaches, as well as increased methodological design control and temporal stability of estimates, including improved measurement resolution across time and space (e.g., county–months). As such, it unlocks the control needed for quasi-experimental designs. However, disadvantages include higher complexity in collecting and analyzing person-level time series data (including the need for higher security and data warehousing). It may also be challenging to collect enough data for higher spatiotemporal resolutions (e.g., resolutions down to the county-day).
Summary and Future Directions
A full methodological toolkit to address biases and provide accurate measurement
Regarding the question of self-presentation biases, while they can lead keyword-based dictionary methods astray (Level 1; as discussed in the section Addressing Social Media Biases), research indicates that these biases have less impact on machine learning algorithms fit to representative samples (Level 2) that consider the entire vocabulary to learn language associations, rather than just considering pre-selected keywords out of context (Fig. 5.5).[117] Instead of relying on assumptions about how words relate to well-being (which is perilous due to most words having many senses, and words generally only conveying their full meaning in context),[118] Level 2 open-vocabulary and machine-learning methods derive relations between language and well-being statistically. Machine-learning-based social media estimates can show strong agreement with assessments from extra-linguistic sources, such as survey responses, and demonstrate that, at least to machine-learning models, language use is robustly related to well-being.[119]
Person-level approaches (Gen 2) take large steps towards addressing the problems of the potential influence of social media bots. The person-level aggregation facilitates the reliable identification and removal of bots from the dataset. This reduces their influence on the estimates.[120] Further, the post-stratified person-level-aggregation methods address the problem that selection biases dominate social media analysis. There is an important difference between non-representative data and somebody not being represented in the data “at all” (i.e., every group may be represented, but they are relatively under- or over-represented) – using robust post-stratification methods can correct non-representative data towards representativeness (as long as demographic strata are sufficiently represented in the data). Lastly, the digital cohort design (Gen 3) overcomes the shortcomings of data aggregation strategies that rely on random samples of tweets from changing samples of users. Instead, ongoing research shows the possibility of following a well-characterized sample over time and “sampling” from it through unobtrusive social media data collection. This approach opens the door to the toolkit of quasi-experimental methods and to meaningful data linkage with other fine-grained population monitoring efforts in population health.
Limitations: Language evolves in space and time
Regional semantic variation. One challenge of using language across geographic regions and time periods is that words (and their various senses) vary with location and time. Geographic and temporal predictions pose different difficulties: Geographically, some words express subcultural differences (e.g., “jazz” tends to refer to music, but in Utah, it often refers to the Utah Jazz basketball team). Some words are also used in ways that are temporally dependent (e.g., happy is, for example, frequently invoked in Happy New Year, which is a speech act with high frequency – on January 1st, while at other times, it may refer to an emotion or evaluation/judgment (e.g., “happy about,” “a happy life”). Language use is also demographically dependent (“sick” means different things among youths and older adults). While Level 3 approaches (contextual word embeddings) can typically disambiguate word senses, there are also examples where Level 2 methods (data-driven topics) have been successfully used to model regional lexical variation.[121] It is important to examine the covariance structure of the most influential words in language models with markers of cultural and socioeconomic gradients.[122]
Semantic drift (over time). Words in natural languages are also subject to drifts in meaning over time as they adapt to the requirements of people and their surroundings.[123] It is possible to document semantic drift using machine learning techniques acting over the span of 5-10 years.[124] Because of semantic drift, machine learning models are not permanently stable and thus may require updating (retraining or “finetuning”) every decade as culture and language use evolve.
Limitations: Changes in the Twitter platform
An uncertain future of Twitter under Musk. The accessibility of social media data may change across platforms. For example, after buying and taking over Twitter at the end of 2022, Elon Musk is changing how Twitter operates. Future access to Twitter interfaces (APIs) presents the biggest risk to Twitter for research, as these may only become accessible subject to very high fees. There are also potentially unknown changes in the sample composition of Twitter post-November 2022, as users may be leaving Twitter in protest (and entering it in accordance with perceived political preference). In addition, changes in user interface features (e.g., future mandatory verification) may change the type of conversations taking place and sample composition. Different account/post status levels (paid, verified, unverified) may differentiate the reach and impact of tweets, which will have to be considered; thus, temporal models may likely have to account for sample/platform changes.
A history of undocumented platform changes. This is a new twist on prior observations that the language composition of Twitter has changed discontinuously in ways that Twitter has historically not documented and only careful analysis could reveal.[125] For example, it has been shown that changes in Twitter’s processing of tweets have resulted in corrupted time series of language frequencies (i.e., word frequencies show abrupt changes not reflecting actual changes in language use but merely changes in processing – such as different applications of language filters in the background.[126] These corrupted time series are not documented by Twitter and may skew research. To some extent, such inconsistencies can be addressed by identifying and removing time series of particular words, but also through the more careful initial aggregation of language into users. Methods relying on the random aggregation of tweets may be particularly exposed to these inconsistencies, while the use of person-level and cohort designs (Gen 2 and 3) that rely on well-characterized samples of specific users may likely prove to be more robust.
Future directions: Beyond social media and across cultures
Data beyond social media. A common concern for well-being assessments derived from social media language analyses is that people may fall silent on social media or migrate to other social media platforms. It is hard to imagine that social media usage will disappear, although there will be challenges with gathering data while preserving privacy. In addition, work suggests that other forms of communication may also be used. For example, individuals’ text messages can be used to assess both self-reported depression[127] and suicide risk[128]; and online discussion forums at a newspaper can be used to assess mood.[129] The limiting factor for these analyses is often how much data is easily accessible, public-by-default social media platforms such as Twitter and Reddit generate data that is considered in the public domain. This is particularly easy to collect at scale without consenting individual subjects.
Measurement Beyond English. Beyond these difficulties within the same language, more research is needed in cross-cultural and cross-language comparisons. Most research on social media and well-being is carried out on single-language data, predominantly in English. A recent meta-analysis identified 45 studies using social media to assess well-being, with 42 studying a single language, with English being the most common (n = 30);[130] To improve the potential of comparisons across languages, more research is needed to understand how this may be done. One potential breakthrough in this domain may be provided by the recent evolution of large multi-language models,[131] which provide shared representations in multiple common languages and, in principle, may allow for the simultaneous measurement of well-being in multiple languages based on limited training data to “fine-tune” these models. Beyond measurement, research is also needed on how social media is used differently across cultures. For example, research indicates that individuals tend to generate content on social media that is in accordance with the ideal affect of their culture.[132]
We are beginning to see the use of social media-based indicators in policy contexts. Foremost among them, the Mexican Instituto Nacional de Estadística y Geografía (INEGI) has shown tremendous leadership in developing Twitter-based well-being measurements for Mexican regions.
Well-being across cultures. Beyond cross-cultural differences in social media use, as the field is considering a generation of measurement instruments beyond self-report, it is essential to carefully reconsider the assumptions inherent in the choice of measured well-being constructs. Cultures differ in how well-being—or the good life more generally—is understood and conceptualized.[133] One of the potential advantages of language-based measurement of the good life is that many aspects of it can be measured through fine-tuned language models. In principle, language can measure harmony, justice, a sense of equality, and other aspects that cultures around the world value.
Ethical considerations
The analysis of social media data requires careful handling of privacy concerns. Key considerations include maintaining the confidentiality and privacy of individuals, which generally involves de-identifying and removing sensitive information automatically. This work is overseen and approved by institutional review boards (IRBs). When data collection at the individual level is part of the study design – for example, when collecting language data from a sample of social media users who have taken a survey to train a language model – obtaining IRB-approved informed consent from these study participants is always required. While a comprehensive discussion on all relevant ethical considerations is beyond the scope of this chapter, we encourage the reader to consult reviews of ethical considerations.[134]
It is our hope that more research groups and institutions use these methods to develop well-being indicators around the world.
Conclusion and outlook
The approaches for assessing well-being from social media language are maturing: Methods to aggregate and sample social media data have become increasingly sophisticated as they have evolved from the analysis of random feeds (Gen 1) to the analyses of demographically-characterized samples of users (Gen 2) to digital cohort studies (Gen 3). Language analysis approaches have become more accurate at representing and summarizing the extent to which language captures well-being constructs – from counting lists of dictionary keywords (Level 1) to relying on robust language associations learned from the data (Level 2) to the new generation of large language models that consider words within contexts (Level 3).
The potential for global measurement. Together, these advances have resulted in both increased measurement accuracy and the potential for more advanced quasi-experimental research designs. As always with big data methods – “data is king” – the more social media data that is being collected and analyzed, the more accurate and fine-grained these estimates can be. After a decade of the field developing methodological foundations, the vast majority of which are open-source and in the public domain, it is our hope that more research groups and institutions use these methods to develop well-being indicators around the world, especially in languages other than English, drawing on additional kinds of social media, and outside of the US. It is through such a joint effort that social-media-based estimation of well-being may mature into a cost-effective, accurate, and robust complement to traditional indicators of well-being.
References
Alessa, A., & Faezipour, M. (2018). A review of influenza detection and prediction through social networking sites. Theoretical Biology and Medical Modelling, 15(1), 1–27.
Auxier, B., & Anderson, M. (2021). Social media use in 2021. Pew Research Center, 1, 1–4.
Bellet, C., & Frijters, P. (2019). Big data and well-being. World Happiness Report 2019. 2019, 97-122.
Benton, A., Coppersmith, G., & Dredze, M. (2017). Ethical research protocols for social media health research. Proceedings of the First ACL Workshop on Ethics in Natural Language Processing, 94–102.
Blei, D. M., Ng, A. Y., & Jordan, M. I. (2003). Latent dirichlet allocation. Journal of Machine Learning Research, 3(Jan), 993–1022.
Bollen, J., Mao, H., & Zeng, X. (2011). Twitter mood predicts the stock market. Journal of Computational Science, 2(1), 1–8.
Boyd, R. L., Ashokkumar, A., Seraj, S., & Pennebaker, J. W. (2022). The development and psychometric properties of LIWC-22. Austin, TX: University of Texas at Austin.
Bradley, M. M., & Lang, P. J. (1999). Affective norms for English words (ANEW): Instruction manual and affective ratings. Technical Report C-1, The Center for Research in Psychophysiology, University of Florida.
Butler, D. (2013). When Google got flu wrong. Nature, 494(7436), Article 7436. https://doi.org/10.1038/494155a
Chew, C., & Eysenbach, G. (2010). Pandemics in the age of Twitter: Content analysis of Tweets during the 2009 H1N1 outbreak. PloS One, 5(11), e14118.
Cresci, S., Di Pietro, R., Petrocchi, M., Spognardi, A., & Tesconi, M. (2017). The paradigm-shift of social spambots: Evidence, theories, and tools for the arms race. Proceedings of the 26th International Conference on World Wide Web Companion, 963–972.
Culotta, A. (2014a). Estimating county health statistics with Twitter. Proceedings of the SIGCHI Conference on Human Factors in Computing Systems, 1335–1344.
Culotta, A. (2014b). Reducing sampling bias in social media data for county health inference. Joint Statistical Meetings Proceedings, 1–12.
Davis, C. A., Varol, O., Ferrara, E., Flammini, A., & Menczer, F. (2016). Botornot: A system to evaluate social bots. Proceedings of the 25th International Conference Companion on World Wide Web, 273–274.
De Choudhury, M., Counts, S., & Horvitz, E. (2013). Social media as a measurement tool of depression in populations. Proceedings of the 5th Annual ACM Web Science Conference, 47–56.
Deerwester, S., Dumais, S. T., Furnas, G. W., Landauer, T. K., & Harshman, R. (1990). Indexing by latent semantic analysis. Journal of the American Society for Information Science, 41(6), 391.
DeLucia, A., Wu, S., Mueller, A., Aguirre, C., Resnik, P., & Dredze, M. (2022). Bernice: A Multilingual Pre-trained Encoder for Twitter. 6191–6205. https://aclanthology.org/2022.emnlp-main.415
Devlin, J., Chang, M.-W., Lee, K., & Toutanova, K. (2019). BERT: Pre-training of Deep Bidirectional Transformers for Language Understanding. Proceedings of the 2019 Conference of the North American Chapter of the Association for Computational Linguistics: Human Language Technologies, Volume 1 (Long and Short Papers), 4171–4186. https://doi.org/10.18653/v1/N19-1423
Dodds, P. S., Clark, E. M., Desu, S., Frank, M. R., Reagan, A. J., Williams, J. R., Mitchell, L., Harris, K. D., Kloumann, I. M., & Bagrow, J. P. (2015). Human language reveals a universal positivity bias. Proceedings of the National Academy of Sciences, 112(8), 2389–2394.
Dodds, P. S., Harris, K. D., Kloumann, I. M., Bliss, C. A., & Danforth, C. M. (2011). Temporal patterns of happiness and information in a global social network: Hedonometrics and Twitter. PloS One, 6(12), e26752.
Dodds, P. S., Minot, J. R., Arnold, M. V., Alshaabi, T., Adams, J. L., Dewhurst, D. R., Reagan, A. J., & Danforth, C. M. (2020). Long-term word frequency dynamics derived from Twitter are corrupted: A bespoke approach to detecting and removing pathologies in ensembles of time series. ArXiv Preprint ArXiv:2008.11305.
Durahim, A. O., & Coşkun, M. (2015). # iamhappybecause: Gross National Happiness through Twitter analysis and big data. Technological Forecasting and Social Change, 99, 92–105.
Ebert, T., Götz, F. M., Mewes, L., & Rentfrow, P. J. (2022). Spatial analysis for psychologists: How to use individual-level data for research at the geographically aggregated level. Psychological Methods.
Eichstaedt, J. C., Schwartz, H. A., Kern, M. L., Park, G., Labarthe, D. R., Merchant, R. M., Jha, S., Agrawal, M., Dziurzynski, L. A., & Sap, M. (2015). Psychological language on Twitter predicts county-level heart disease mortality. Psychological Science, 26(2), 159–169.
Elmas, T., Overdorf, R., & Aberer, K. (2022). Characterizing Retweet Bots: The Case of Black Market Accounts. Proceedings of the International AAAI Conference on Web and Social Media, 16, 171–182.
Ferrara, E., Varol, O., Davis, C., Menczer, F., & Flammini, A. (2016). The rise of social bots. Communications of the ACM, 59(7), 96–104.
Flanagan O., LeDoux J. E., Bingle B., Haybron D. M., Mesquita, B., Moody-Adams, M., Ren, S., Sun A., & Wilson, Y. Y. With responses from critics Frey J. A., Markus H. R., Sachs J. D., and Tsai, J. L. Against Happiness, Columbia University Press
Forgeard, M. J., Jayawickreme, E., Kern, M. L., & Seligman, M. E. (2011). Doing the right thing: Measuring wellbeing for public policy. International Journal of Wellbeing, 1(1).
Fukuda, M., Nakajima, K., & Shudo, K. (2022). Estimating the Bot Population on Twitter via Random Walk Based Sampling. IEEE Access, 10, 17201–17211. https://doi.org/10.1109/ACCESS.2022.3149887
Gallup, & Meta. (2022). The State of Social Connections.
Gibbons, J., Malouf, R., Spitzberg, B., Martinez, L., Appleyard, B., Thompson, C., Nara, A., & Tsou, M.-H. (2019). Twitter-based measures of neighborhood sentiment as predictors of residential population health. PLOS ONE, 14(7), e0219550. https://doi.org/10.1371/journal.pone.0219550
Ginsberg, J., Mohebbi, M. H., Patel, R. S., Brammer, L., Smolinski, M. S., & Brilliant, L. (2009). Detecting influenza epidemics using search engine query data. Nature, 457(7232), 1012–1014.
Giorgi, S., Eichstaedt, J. C., Preotiuc-Pietro, D., Gardner, J.R., Schwartz, H. A., Ungar, L. (under review). Filling in the White Space: Spatial Interpolation with Gaussian Processes and Social Media Data.
Giorgi, S., Lynn, V. E., Gupta, K., Ahmed, F., Matz, S., Ungar, L. H., & Schwartz, H. A. (2022). Correcting Sociodemographic Selection Biases for Population Prediction from Social Media. Proceedings of the International AAAI Conference on Web and Social Media, 16, 228–240.
Giorgi, S., Preoţiuc-Pietro, D., Buffone, A., Rieman, D., Ungar, L., & Schwartz, H. A. (2018). The Remarkable Benefit of User-Level Aggregation for Lexical-based Population-Level Predictions. In Proceedings of the 2018 Conference on Empirical Methods in Natural Language Processing (pp. 1167-1172).
Giorgi, S., Ungar, L., & Schwartz, H. A. (2021). Characterizing Social Spambots by their Human Traits. Findings of the Association for Computational Linguistics: ACL-IJCNLP 2021, 5148–5158.
Glenn, J. J., Nobles, A. L., Barnes, L. E., & Teachman, B. A. (2020). Can text messages identify suicide risk in real time? A within-subjects pilot examination of temporally sensitive markers of suicide risk. Clinical Psychological Science, 8(4), 704–722.
Global Partnership for Sustainable Development Data, The World Bank, United Nations, & Sustinable Development Solution Network. (2022). REAL-TIME DATA FOR THE SDGS: Accelerating progress through timely information. https://www.data4sdgs.org/sites/default/files/2019-05/Real-time Data for the SDGs_Concept Note.pdf
Golder, S. A., & Macy, M. W. (2011). Diurnal and seasonal mood vary with work, sleep, and daylength across diverse cultures. Science, 333(6051), 1878–1881.
Hedonometer. Average Happiness for Twitter. (2022, December 19). Retrieved from https://hedonometer.org/.
Hogan, B. (2010). The presentation of self in the age of social media: Distinguishing performances and exhibitions online. Bulletin of Science, Technology & Society, 30(6), 377–386.
Hsu, T. W., Niiya, Y., Thelwall, M., Ko, M., Knutson, B., & Tsai, J. L. (2021). Social media users produce more affect that supports cultural values, but are more influenced by affect that violates cultural values. Journal of Personality and Social Psychology.
Iacus, S. M., Porro, G., Salini, S., & Siletti, E. (2020). An Italian composite subjective well-being index: The voice of Twitter users from 2012 to 2017. Social Indicators Research, 1–19.
INEGI (2022, December 19). Map of the state of mind of Twitter users in Mexico. Retrieved from https://www.inegi.org.mx/app/animotuitero/#/app/map.
Jaggi, M., Uzdilli, F., & Cieliebak, M. (2014). Swiss-chocolate: Sentiment detection using sparse SVMs and part-of-speech n-grams. Proceedings of the 8th International Workshop on Semantic Evaluation (SemEval 2014), 601–604.
Jaidka, K., Chhaya, N., & Ungar, L. (2018). Diachronic degradation of language models: Insights from social media. Proceedings of the 56th Annual Meeting of the Association for Computational Linguistics (Volume 2: Short Papers), 195–200. https://doi.org/10.18653/v1/P18-2032
Jaidka, K., Giorgi, S., Schwartz, H. A., Kern, M. L., Ungar, L. H., & Eichstaedt, J. C. (2020). Estimating geographic subjective well-being from Twitter: A comparison of dictionary and data-driven language methods. Proceedings of the National Academy of Sciences, 117(19), 10165–10171.
Jose, R., Matero, M., Sherman, G., Curtis, B., Giorgi, S., Schwartz, H. A., & Ungar, L. H. (2022). Using Facebook language to predict and describe excessive alcohol use. Alcoholism: Clinical and Experimental Research.
Kramer, A. D. (2010). An unobtrusive behavioral model of “gross national happiness”. Proceedings of the SIGCHI Conference on Human Factors in Computing Systems, 287–290.
Lavertu, A., Hamamsy, T., & Altman, R. B. (2021). Monitoring the opioid epidemic via social media discussions. MedRxiv.
Lazer, D., Kennedy, R., King, G., & Vespignani, A. (2014). The parable of Google Flu: Traps in big data analysis. Science, 343(6176), 1203–1205.
Little, R. J. (1993). Post-stratification: A modeler’s perspective. Journal of the American Statistical Association, 88(423), 1001–1012.
Liu, T., Meyerhoff, J., Eichstaedt, J. C., Karr, C. J., Kaiser, S. M., Kording, K. P., Mohr, D. C., & Ungar, L. H. (2022). The relationship between text message sentiment and self-reported depression. Journal of Affective Disorders, 302, 7–14.
Liu, Y., Ott, M., Goyal, N., Du, J., Joshi, M., Chen, D., Levy, O., Lewis, M., Zettlemoyer, L., & Stoyanov, V. (2019). Roberta: A robustly optimized bert pretraining approach. ArXiv Preprint ArXiv:1907.11692.
Lomas, T., Lai, A., Shiba, K., Diego-Rosell, P., Uchida, Y., & VanderWeele, T. J. (2022). Insights from the first global survey of balance and harmony. World Happiness Report 2022, 127–154.
Luhmann, M. (2017). Using big data to study subjective well-being. Current Opinion in Behavioral Sciences, 18, 28–33.
Mangalik, S., Eichstaedt, J. C., Giorgi, S., Mun, J., Ahmed, F., Gill, G., … & Schwartz, H. A. (2023). Robust language-based mental health assessments in time and space through social media. arXiv preprint arXiv:2302.12952.
Metzler, H., Pellert, M., & Garcia, D. (2022). Using social media data to capture emotions before and during COVID-19. World Happiness Report 2022, 75–104.
Mitchell, L., Frank, M. R., Harris, K. D., Dodds, P. S., & Danforth, C. M. (2013). The geography of happiness: Connecting Twitter sentiment and expression, demographics, and objective characteristics of place. PloS One, 8(5), e64417.
Mohammad, S., Bravo-Marquez, F., Salameh, M., & Kiritchenko, S. (2018). Semeval-2018 task 1: Affect in tweets. Proceedings of the 12th International Workshop on Semantic Evaluation, 1–17.
OECD. (2013). OECD guidelines on measuring subjective well-being. OECD publishing. http://dx.doi.org/10.1787/9789264191655-en
Paul, M., & Dredze, M. (2011). You are what you tweet: Analyzing Twitter for public health. Proceedings of the International AAAI Conference on Web and Social Media, 5(1), 265–272.
Paul, M. J., & Dredze, M. (2012). A model for mining public health topics from Twitter. Health, 11(16–16), 1.
Paul, M. J., & Dredze, M. (2014). Discovering health topics in social media using topic models. PloS One, 9(8), e103408.
Pellert, M., Metzler, H., Matzenberger, M., & Garcia, D. (2022). Validating daily social media macroscopes of emotions. Scientific Reports, 12(1), Article 1. https://doi.org/10.1038/s41598-022-14579-y
Pennebaker, J. W., Boyd, R. L., Jordan, K., & Blackburn, K. (2015). The development and psychometric properties of LIWC2015. UT Faculty/Researcher Works.
Pennebaker, J. W., Francis, M. E., & Booth, R. J. (2001). Linguistic inquiry and word count: LIWC 2001. Mahway: Lawrence Erlbaum Associates, 71, 2001.
Qi, J., Fu, X., & Zhu, G. (2015). Subjective well-being measurement based on Chinese grassroots blog text sentiment analysis. Information & Management, 52(7), 859–869. https://doi.org/10.1016/j.im.2015.06.002
Sametoglu, S., Pelt, D., Ungar, L. H., & Bartels, M. (2022). The Value of Social Media Language for the Assessment of Wellbeing: A Systematic Review and Meta-Analysis.
Santillana, M., Zhang, D. W., Althouse, B. M., & Ayers, J. W. (2014). What Can Digital Disease Detection Learn from (an External Revision to) Google Flu Trends? American Journal of Preventive Medicine, 47(3), 341–347. https://doi.org/10.1016/j.amepre.2014.05.020
Scao, T. L., Fan, A., Akiki, C., Pavlick, E., Ilić, S., Hesslow, D., Castagné, R., Luccioni, A. S., Yvon, F., & Gallé, M. (2022). BLOOM: A 176B-Parameter Open-Access Multilingual Language Model. ArXiv Preprint ArXiv:2211.05100.
Schwartz, H. A., Eichstaedt, J., Blanco, E., Dziurzynski, L., Kern, M., Ramones, S., Seligman, M., & Ungar, L. (2013). Choosing the right words: Characterizing and reducing error of the word count approach. Second Joint Conference on Lexical and Computational Semantics ( SEM), Volume 1: Proceedings of the Main Conference and the Shared Task: Semantic Textual Similarity*, 296–305.
Schwartz, H. A., Eichstaedt, J. C., Kern, M. L., Dziurzynski, L., Lucas, R. E., Agrawal, M., Park, G. J., Lakshmikanth, S. K., Jha, S., & Seligman, M. E. (2013). Characterizing Geographic Variation in Well-Being Using Tweets. ICWSM.
Schwartz, H. A., Sap, M., Kern, M. L., Eichstaedt, J. C., Kapelner, A., Agrawal, M., Blanco, E., Dziurzynski, L., Park, G., & Stillwell, D. (2016). Predicting individual well-being through the language of social media. 516–527.
Seabrook, E. M., Kern, M. L., Fulcher, B. D., & Rickard, N. S. (2018). Predicting depression from language-based emotion dynamics: Longitudinal analysis of Facebook and Twitter status updates. Journal of Medical Internet Research, 20(5), e9267.
Shah, D. S., Schwartz, H. A., & Hovy, D. (2020). Predictive Biases in Natural Language Processing Models: A Conceptual Framework and Overview. Proceedings of the 58th Annual Meeting of the Association for Computational Linguistics, 5248–5264. https://doi.org/10.18653/v1/2020.acl-main.468
Shao, C., Ciampaglia, G. L., Varol, O., Yang, K.-C., Flammini, A., & Menczer, F. (2018). The spread of low-credibility content by social bots. Nature Communications, 9(1), 1–9.
Silver, L., Smith, A., Johnson, C., Taylor, K., Jiang, J., Anderson, M., & Rainie, L. (2019). Mobile connectivity in emerging economies. Pew Research Center, 7.
Smith, L., Giorgi, S., Solanki, R., Eichstaedt, J., Schwartz, H. A., Abdul-Mageed, M., Buffone, A., & Ungar, L. (2016). Does ‘well-being’ translate on Twitter? Proceedings of the 2016 Conference on Empirical Methods in Natural Language Processing, 2042–2047.
Townsend, L., & Wallace, C. (2017). The ethics of using social media data in research: A new framework. In The ethics of online research (Vol. 2, pp. 189–207). Emerald Publishing Limited.
U.N. (2016). Transforming our world: The 2030 agenda for sustainable development.
Vural, A. G., Cambazoglu, B. B., Senkul, P., & Tokgoz, Z. O. (2013). A framework for sentiment analysis in turkish: Application to polarity detection of movie reviews in turkish. In Computer and Information Sciences III (pp. 437–445). Springer.
Wang, N., Kosinski, M., Stillwell, D. J., & Rust, J. (2014). Can Well-Being be Measured Using Facebook Status Updates? Validation of Facebook’s Gross National Happiness Index. Social Indicators Research, 115(1), 483–491. https://doi.org/10.1007/s11205-012-9996-9
Wang, Z., Hale, S., Adelani, D. I., Grabowicz, P., Hartman, T., Flöck, F., & Jurgens, D. (2019). Demographic inference and representative population estimates from multilingual social media data. The World Wide Web Conference, 2056–2067.
Warriner, A. B., Kuperman, V., & Brysbaert, M. (2013). Norms of valence, arousal, and dominance for 13,915 English lemmas. Behavior Research Methods, 45(4), 1191–1207. https://doi.org/10.3758/s13428-012-0314-x
Wojcik, S., & Hughes, A. (2019). Sizing up Twitter users. PEW Research Center, 24.
Wolf, M., Horn, A. B., Mehl, M. R., Haug, S., Pennebaker, J. W., & Kordy, H. (2008). Computergestützte quantitative textanalyse: Äquivalenz und robustheit der deutschen version des linguistic inquiry and word count. Diagnostica, 54(2), 85–98.
Yaden, D. B., Giorgi, S., Jordan, M., Buffone, A., Eichstaedt, J., Schwartz, H. A., Ungar, L., & Bloom, P. (2022). Characterizing Empathy and Compassion Using Computational Linguistic Analysis. in press.
Zamani, M., Buffone, A., & Schwartz, H. A. (2018). Predicting human trustfulness from Facebook language. ArXiv Preprint ArXiv:1808.05668.
Endnotes
Giorgi et al., 2018 ↩︎
Giorgi et al., 2022; Jaidka et al., 2020 ↩︎
Jaidka et al., 2020 ↩︎
Yaden et al., 2022; Zamani et al., 2018 ↩︎
Jaidka et al., 2020; Metzler et al., 2022 ↩︎
Giorgi et al., 2022; Jaidka et al., 2020 ↩︎
INEGI, 2022, https://www.inegi.org.mx/app/animotuitero/#/app/map ↩︎
U.N., 2016 ↩︎
Global Partnership for Sustainable Development Data et al., 2022 ↩︎
e.g., see the World Happiness Report 2019, Chapter 6, Frijters & Bellet, 2019 ↩︎
Silver et al., 2019 ↩︎
De Choudhury et al., 2013; Seabrook et al., 2018 ↩︎
Jose et al., 2022 ↩︎
Paul & Dredze, 2011; Paul & Dredze, 2012 ↩︎
Alessa & Faezipour, 2018 ↩︎
Chew & Eysenbach, 2010 ↩︎
Culotta, 2014a ↩︎
Eichstaedt et al., 2015 ↩︎
Boyd et al., 2022 ↩︎
e.g., Mohammad et al., 2018 ↩︎
Luhmann, 2017, p. 28 ↩︎
Sametoglu et al., 2022 ↩︎
Jaidka et al., 2020 ↩︎
Jaidka et al., 2020; Schwartz et al., 2016 ↩︎
Smith et al., 2016 ↩︎
INEGI, 2022 ↩︎
Jaidka et al., 2020 ↩︎
Forgeard et al., 2011; Smith et al., 2016 ↩︎
INEGI, 2022 ↩︎
Jaidka et al., 2020 ↩︎
Giorgi et al., in revision; see supplementary material for information on spatial interpolation. ↩︎
see World Happiness Report 2022, Chapter 6; Lomas et al., 2022 ↩︎
Flanagan et. al. (2023) ↩︎
as previously discussed in WHR 2022, Chapter 4; Metzler, Pellert & Garcia, 2022; see also Jaidka, et al., 2020 ↩︎
Bradley & Lang, 1999 ↩︎
Boyd et al., 2022 ↩︎
Blei et al., 2003 ↩︎
Devlin et al., 2019 ↩︎
Y. Liu et al., 2019 ↩︎
Scao et al., 2022 ↩︎
Auxier & Anderson (2021) ↩︎
Auxier & Anderson, 2021 ↩︎
Giorgi et al., 2022 ↩︎
Wojcik & Hughes, 2019 ↩︎
Giorgi et al., 2018 ↩︎
Giorgi et al., 2021 ↩︎
Hogan, 2010 ↩︎
see Jaidka et al., 2020 ↩︎
e.g., Jaidka et al., 2020 ↩︎
adapted from Auxier & Anderson, 2021 ↩︎
[Giorgi et al. (2018)]{.mark} ↩︎
Giorgi et al. (2022) ↩︎
[Mangalik et al. (2023)]{.mark} ↩︎
Schwartz, Eichstaedt, Blanco, et al., 2013 ↩︎
Fukuda et al., 2022 ↩︎
Elmas et al., 2022 ↩︎
Ferrara et al., 2016 ↩︎
Shao et al., 2018 ↩︎
Cresci et al., 2017 ↩︎
Davis et al., 2016 ↩︎
Giorgi et al., 2021 ↩︎
Davis et al., 2016 ↩︎
Kramer, 2010 ↩︎
SWLS; Diener et al., 1985 ↩︎
N. Wang et al., 2014 ↩︎
Hedonometer, 2022 ↩︎
Dodds et al., 2011; Mitchell et al., 2013 ↩︎
Dodds et al., 2011 ↩︎
Dodds et al., 2011 ↩︎
Mitchell et al., 2013 ↩︎
Gibbons et al., 2019 ↩︎
Gibbons et al., 2019 ↩︎
Jaidka et al., 2020 ↩︎
Qi et al., 2015 ↩︎
Durahim & Coşkun, 2015 ↩︎
Vural et al., 2013 ↩︎
From https://hedonometer.org/, see also Dodds et al., 2011 ↩︎
Mitchell et al., 2013 ↩︎
Gibbons et al., 2019 ↩︎
see Jaidka et al., 2020 for a full discussion ↩︎
Sources and references: LIWC 2015 (Pennebaker et al., 2015); LabMT (Dodds et al., 2011); Swiss Chocolate (Jaggi et al., 2014); World Well-Being Project Life Satisfaction model and direct prediction (Jaidka et al., 2020). ↩︎
[Schwartz, Eichstaedt, Kern, et al., 2013]{.mark} ↩︎
[Eichstaedt et al., 2015]{.mark} ↩︎
Pellert et al., 2022 ↩︎
Pellert et al., 2022 ↩︎
Wolf et al., 2008 ↩︎
Culotta, 2014a, 2014b ↩︎
Giorgi et al., 2018 ↩︎
Ebert et al., 2022 ↩︎
Giorgi et al., 2022 ↩︎
Giorgi et al., 2022; Z. Wang et al., 2019 ↩︎
Little, 1993 ↩︎
Culotta, 2014b; Jaidka et al., 2020 ↩︎
Giorgi et al., 2022 ↩︎
Metzler et al., 2022 ↩︎
Eichstaedt et al., 2021 ↩︎
Metzler et al., 2022 ↩︎
Metzler et al., 2022 ↩︎
Giorgi et al., 2022 ↩︎
Giorgi et al., 2022 ↩︎
Jaidka et al., 2020 ↩︎
Publicly released here: https://github.com/wwbp/county_tweet_lexical_bank. ↩︎
Bollen et al., 2011 ↩︎
Golder & Macy, 2011 ↩︎
Golder and Macy, 2011 ↩︎
Ginsberg et al., 2009; Santillana et al., 2014 ↩︎
Butler, 2013; Lazer et al., 2014 ↩︎
Butler, 2013 ↩︎
Lazer et al., 2014 ↩︎
Paul & Dredze, 2014 ↩︎
Jaidka et al., 2020 ↩︎
e.g., Garcia et al., 2022 ↩︎
[Gallup & Meta, 2022, *p.*18]{.mark} ↩︎
Giorgi et al., 2018 ↩︎
Lavertu et al., 2021, preprint ↩︎
Matero et al., 2022 ↩︎
e.g., see Jaidka et al., 2020 ↩︎
see Jaidka et al., 2020 and Schwartz, Eichstaedt, Blanco, et al., 2013 ↩︎
Jaidka et al., 2020 ↩︎
e.g., see Giorgi et al., 2021 ↩︎
Eisenstein et al., 2010; see supplementary material for more information ↩︎
See Jaidka et al., 2020; Eichstaedt et al., 2021; Schwartz, Eichstaedt, Blanco, et al., 2013 for a fuller discussion. ↩︎
Jaidka et al., 2018 ↩︎
Jaidka et al., 2018 ↩︎
Dodds et al., 2020 ↩︎
Dodds et al., 2020 ↩︎
T. Liu et al., 2022 ↩︎
Glenn et al., 2020 ↩︎
Pellert et al., 2022 ↩︎
Sametoglu et al., 2022 ↩︎
DeLucia et al., 2022 ↩︎
Hsu et al., 2021 ↩︎
See Flannagan et. al. (2023) for a review ↩︎
We encourage the reader to see Benton et al., 2017, Shah et al., 2020, and Townsend and Wallace, 2017 ↩︎