Annex: Using a New Global Urban-Rural Definition, Called the Degree of Urbanisation, to Assess Happiness
The longstanding lack of a global definition of urban and rural areas is an obstacle to reliably comparing these areas across national borders. Six international organisations (EU, FAO, ILO, OECD, UN-Habitat and World Bank) have developed a new harmonised definition that can be applied to every country in the world, called the Degree of Urbanisation. This work was presented to the UN Statistical Commission and endorsed on 5 March 2020. Instead of relying on only two classes, this new method uses three classes to capture the urban-rural continuum: 1) Cities, 2) Towns and semi-dense areas and 3) Rural areas.
The Gallup World Poll data in 115 countries (see annex for the list) was coded by Degree of Urbanisation for the years 2016, 2017 and 2018. The years 2019 to 2022 will also be coded in this way. The countries covered by our data include the United States plus all countries where face-to-face interviews are used. Because the Gallup World Poll mostly uses telephone interviews in high-income countries, only 11 high-income countries could be included. This explains some of the differences between our results and those presented in chapter 4.
The perceived level of urbanisation reported in the Gallup World Poll in these 115 countries tends to match the Degree of Urbanisation (Figure 1). Of the people who say they live in a large city, 80% are classified as in a city. Of the people who say they live in rural areas or on a farm, 75% are classified as in a rural area by the Degree of Urbanisation. Small towns and villages fall primarily into two Degrees of Urbanisation: towns and semi-dense areas and rural areas, respectively. Of the people who say they live in a small town or a village, 83% classified in those two degrees of urbanisation. The remaining 17% of the people who say they live in a small town or village are classified as living in a city. This could be because people who live in a small city may select the category ‘small town or village’ instead of the category ‘large city.’ People who say they live in a suburb are mostly classified as living in a city (62%) or in towns and semi-dense areas (19%).
Figure A1: Population by perceived urbanisation and the Degree of Urbanisation, 2016-2018
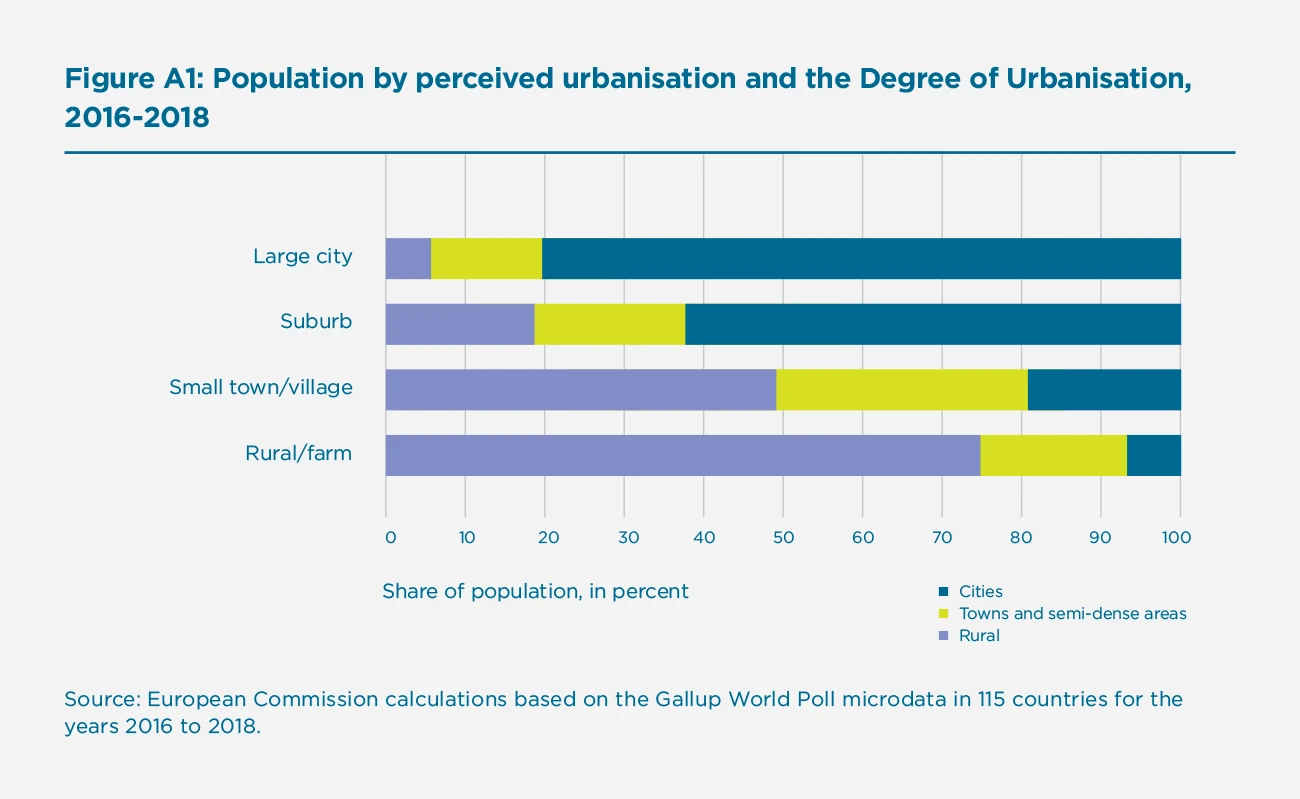
Chapter 4 reports differences between rural areas and farms, on the one hand, and large cities plus suburbs, on the other hand. The distinction between rural and urban in Chapter 4 produces slightly larger gaps than between rural areas and cities as defined by the Degree of Urbanisation. The Degree of Urbanisation includes villages in rural areas and it also includes smaller cities, and thus accounts for more of the middle of the urban-rural continuum in those two classes. This in turn reduces the size of gap as compared to the perceived level of urbanisation that focuses on more of the extremes of the urban-rural continuum.
Life evaluation, feelings and making friends by Degree of Urbanisation
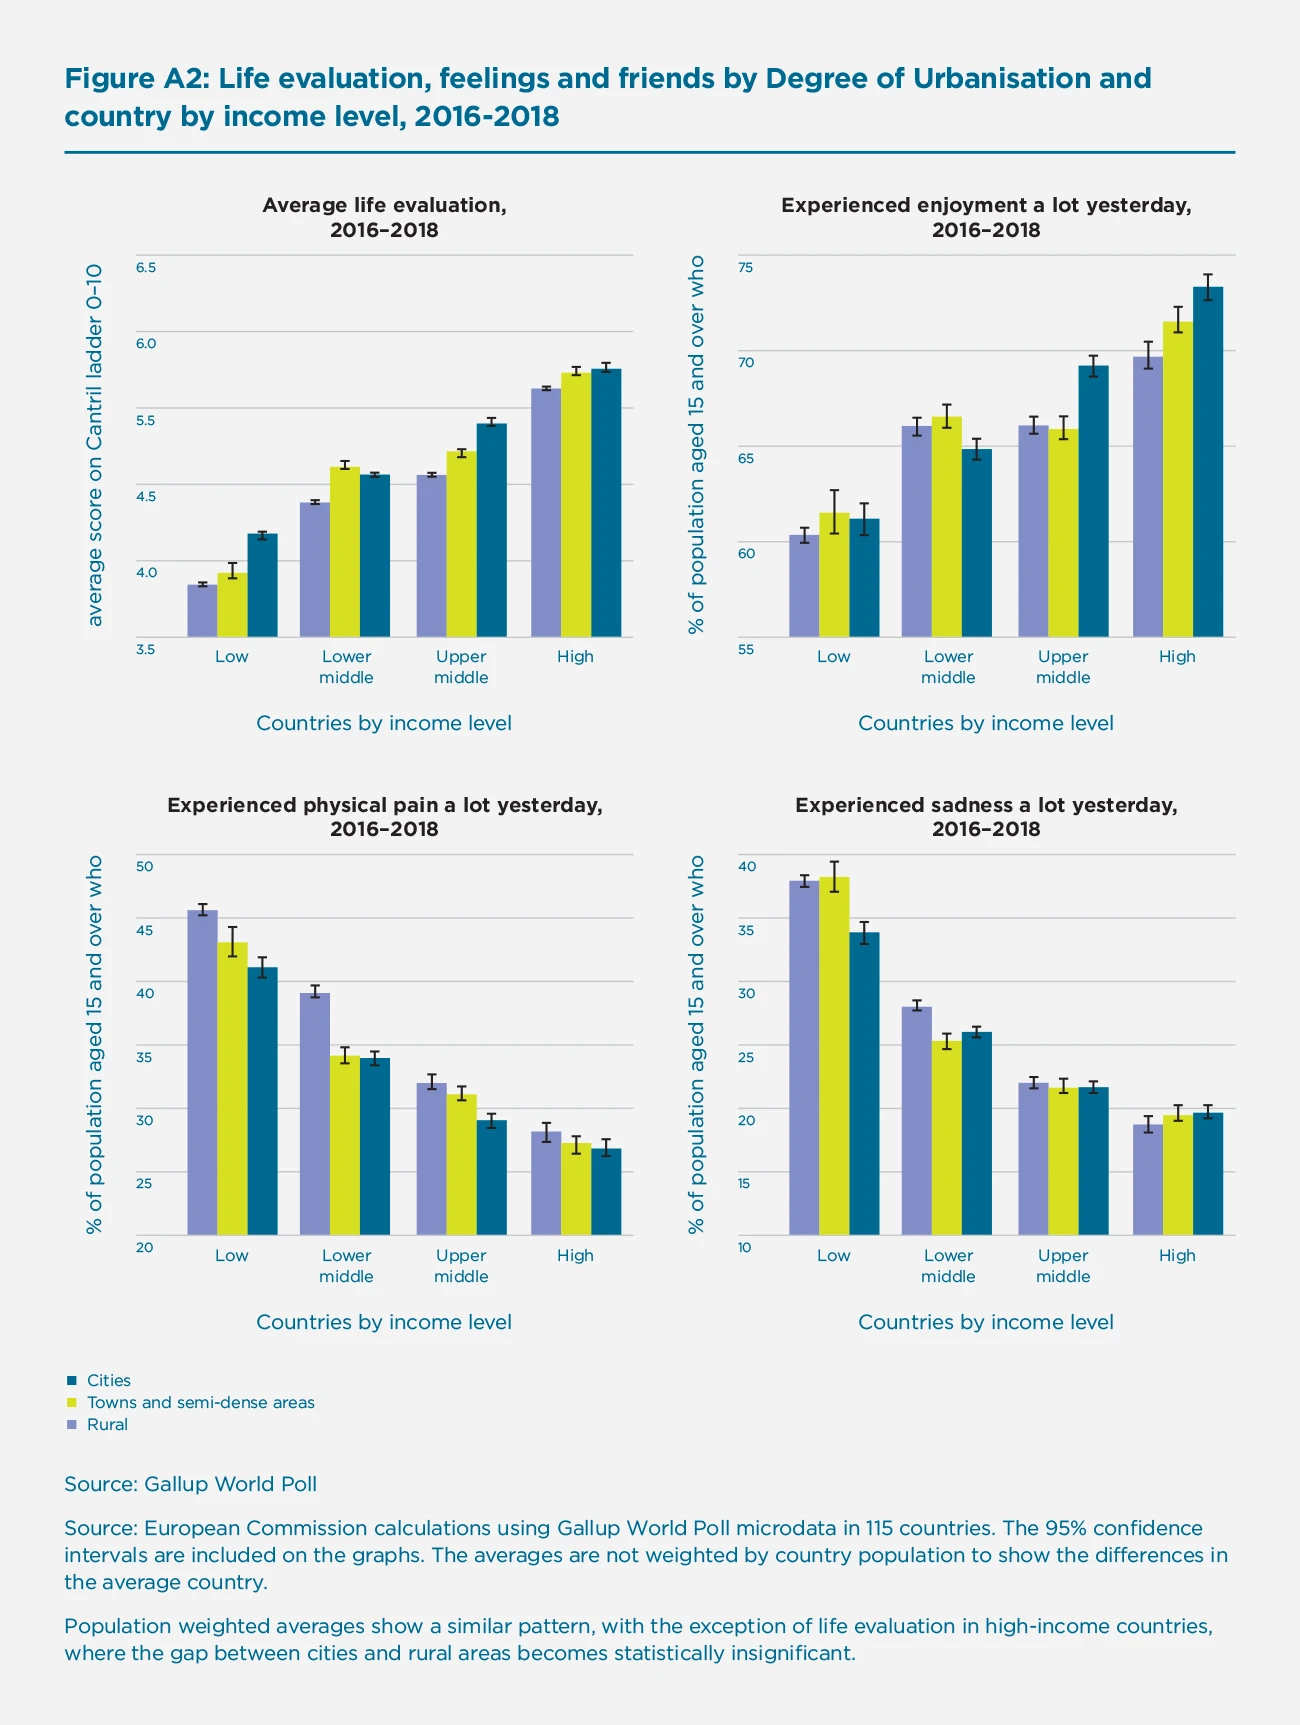
In cities, life evaluation scores are generally higher than those in rural areas. In an average country in this sample, life evaluation is between 0.2 and 0.6 higher in cities than in rural areas, depending on the country income level (See Figure 2). The difference in life evaluation scores between cities and rural areas is smallest in the high-income countries included in this sample of 115 countries. People living in towns and semi-dense areas tend to rate their life evaluations in between those in cities and rural areas.
The higher life evaluation in cities is mirrored by parallel findings for the prevalence of positive and negative feelings. More people experienced enjoyment in cities than in rural areas, and physical pain and sadness are more common in rural areas than in cities. This gap is especially big in the low-income countries in which 46% of the people in rural areas stated they experienced physical pain a lot yesterday compared to 43% in towns and semi-dense areas and 41% in cities. Sadness is also more prevalent in rural areas in low-income countries with 38% stating they experience sadness a lot of the day as compared to only 34% in cities.
These differences may in part be due to lower access to services (such as health care) in rural areas, different type of jobs (with more hard and manual labour in rural areas), and lower incomes. In rural areas, more people work in agriculture, which tends to pay less and is more vulnerable to changes in weather and fluctuations in market prices. The Gallup World Poll shows that more people are self-employed in rural areas, which may also lead to a less predictable income. Furthermore, the Gallup World Polls shows that more people in rural areas lack money to pay for food than in cities.
Figure A2: Life evaluation, feelings and friends by Degree of Urbanisation and country by income level, 2016-2018
Despite the image of rural life being more closely knit, fewer people in rural areas than in cities say they have relatives or friends they can count on to help them when they are in trouble. This gap is again the biggest in the low-income countries, with 63% of the people in rural areas saying they can count on family or friends as compared to 68% in cities. In high-income countries, more people say they can count on family or friends than in low- and middle-income countries and the gap between rural areas and cities is smaller (87% in rural areas and 89% in cities). This may be in part because in rural areas economies tend to be less diversified, which means that if one person’s income shrinks or disappears many of his or her neighbours will be in the same situation, making it harder to help each other. This could happen, for example, due to a drought or a big employer shutting down.
Life in cities is socially more satisfying than in rural areas. The difference between cities and rural areas for the share of people satisfied with the opportunities to meet people and make friends is biggest in high-income countries, in which 79% of the people living in cities are satisfied compared to 68% in rural areas. Towns and semi-dense areas score almost as well as cities in all the four income groups.
In cities more people experience joy and fewer experience pain or sadness than in rural areas, especially in low- and middle-income countries. More city dwellers feel they can rely on family or friends for help, meet people, and make friends than people living in rural areas. It should not come as a surprise that city dwellers evaluate their life more highly and that migration tends to go from rural areas to cities.
Methodology
The figures presented here are based on data from the Gallup World Poll in 115 countries coded by Degree of Urbanisation for the years of 2016, 2017 and 2018 and the World Bank country income classifications. The European Commission and Gallup have agreed to continue the coding of the Gallup World Poll in countries with geo-tagged face-to-face interviews and the USA until 2022. The newly developed Degree of Urbanisation variable is available through a free download (as a .csv file) that Gallup data subscribers can integrate back into the World Poll data sets.
The figures presented are the unweighted averages of the weighted respondents for those countries covered by face-to-face surveys and the USA for scores by Degree of Urbanisation. In other words, they show the experience and opinion of someone living in a city, town and semi-dense area, or rural area in an average country of that specific income level; not the average rural or city resident. This approach was chosen because it shows average gap between cities and rural areas. A population-weighted average would primarily reflect the gaps in the biggest countries, while the small countries would only have negligible impact.
It is important to note that a significant number of middle- and high-income countries are not included in the analysis, as in those countries the surveys telephone-based and precise information about the location of the respondent is not available. For that reason, many EU countries are not present.
Both authors work for the European Commission. Nevertheless, this document reflects the views only of the authors; the European Commission cannot be held responsible for any use made of the information contained therein.